PHOSPHORUS EXTRACTED BY ION EXCHANGE RESINS AND
MEHLICH-1 FROM OXISOLS (LATOSOLS) TREATED WITH
DIFFERENT PHOSPHORUS RATES AND SOURCES FOR
VARIED SOIL-SOURCE CONTACT PERIODS
(1)Irio Fernando de Freitas(2), Roberto Ferreira Novais(3), Ecila Mercês de Albuquerque Villani(4) & Sarah Vieira Novais(5)
SUMMARY
Despite the large number of studies addressing the quantification of phosphorus (P) availability by different extraction methods, many questions remain unanswered. The aim of this paper was to compare the effectiveness of the extractors Mehlich-1, Anionic Resin (AR) and Mixed Resin (MR), to determine the availability of P under different experimental conditions. The laboratory study was arranged in randomized blocks in a [(3 x 3 x 2) + 3] x 4 factorial design, with four replications, testing the response of three soils with different texture: a very clayey Red Latosol (LV), a sandy clay loam Red Yellow Latosol (LVA), and a sandy loam Yellow Latosol (LA), to three sources (triple superphosphate, reactive phosphate rock from Gafsa-Tunisia; and natural phosphate from Araxá-Minas Gerais) at two P rates (75 and 150 mg dm-3), plus three control treatments (each
soil without P application) after four contact periods (15, 30, 60, and 120 days) of the P sources with soil. The soil acidity of LV and LVA was adjusted by raising base saturation to 60 % with the application of CaCO3 and MgCO3 at a 4:1 molar ratio (LA
required no correction). These samples were maintained at field moisture capacity for 30 days. After the contact periods, the samples were collected to quantify the available P concentrations by the three extractants. In general, all three indicated that the available P-content in soils was reduced after longer contact periods with the P sources. Of the three sources, this reduction was most pronounced for triple superphosphate, intermediate for reactive phosphate, while Araxá phosphate was
(1) Extracted from the Master Thesis of the first author by the Post-Graduation Program in Soils and Plant Nutrition, Federal University of Viçosa - UFV. Received for publication on July 11, 2012 and approved on March 6, 2013.
(2) Master degree of Soil Departament, Federal University of Viçosa - UFV. Av. P.H. Rolfs, s/n. CEP 36570-000. Viçosa, MG. E-mail: iriocoop@yahoo.com.br
(3) Professor of Soil Departament, UFV. E-mail: rfnovais@ufv.br
least sensitive to the effect of time. It was observed that AR extracted lower P levels from all three soils when the sources were phosphate rocks, while MR extracted values close to Mehlich-1 in LV (clay) and LVA (medium texture) for reactive phosphate. For Araxá phosphate, much higher P values were determined by Mehlich-1 than by the resins, because of the acidity of the extractor. For triple superphosphate, both resins extracted higher P levels than Mehlich-1, due to the consumption of this extractor, particularly when used for LV and LVA.
Index terms: phosphorus fertilizers, rock phosphates, phosphorus extractants.
REUSMO:FÓSFORO EXTRAÍDO COM RESINAS TROCADORAS DE ÍONS E
MEHLICH-1 DE LATOSSOLOS SUBMETIDOS A FONTES E DOSES DE FÓSFORO E TEMPOS DE CONTATO
Apesar do grande número de publicações voltadas para a avaliação da disponibilidade de fósforo (P) por diferentes métodos de extração, persistem ainda muitas indagações sobre o assunto. O objetivo deste trabalho foi comparar os extratores Mehlich-1, Resina Aniônica (RA) e Resina Mista (RM), quanto à avaliação da disponibilidade de P, em diferentes condições experimentais. O trabalho foi conduzido em condições de laboratório, em blocos casualizados, no fatorial [(3 x 3 x 2) + 3] x 4, com quatro repetições, empregando-se três solos com diferentes constituições texturais: um Latossolo Vermelho (LV), muito argiloso; um Latossolo Vermelho-Amarelo (LVA), franco-argiloarenoso; e um Latossolo Vermelho-Amarelo (LA), franco-arenoso, três fontes de P (superfosfato triplo, fosfato reativo de Gafsa e fosfato natural de Araxá), em duas doses de P total da fonte (75 e 150 mg dm-3) mais três solos sem adição de P e quatro tempos (15, 30, 60
e 120 dias) de contato das fontes de P com os solos. A acidez dos solos LV e LVA foi corrigida pelo método da saturação por bases, elevando-a para 60 % com a aplicação de CaCO3 e
MgCO3 (4:1); para o LA não houve necessidade de correção. Essas amostras foram mantidas
por 30 dias com a umidade na capacidade de campo. Foram coletadas amostras nos tempos de contato estabelecidos e determinadas as concentrações do P-disponível pelos três extratores. Verificou-se, de modo geral, redução no teor do P-disponível pelos extratores Mehlich-1, RM e RA, com o aumento do tempo de contato das fontes de P com os solos. Considerando-se as três fontes de P, essas reduções dos teores foram mais expressivas quando se utilizaram o superfosfato triplo com o fosfato reativo em posição intermediária e o fosfato de Araxá, o menos sensível ao efeito do tempo. Observou-se que a RA extraiu menores teores de P, nos três solos, quando as fontes foram os fosfatos naturais, ao passo que a RM aproximou-se dos valores obtidos pelo Mehlich-1 no LV (argiloso) e LVA (textura média), para o fosfato reativo. Para o fosfato de Araxá, os valores de P foram maiores para o Mehlich-1 do que para as Resinas, em razão do caráter ácido desse extrator. Para o superfosfato triplo, ambas as Resinas extraíram maiores teores de P do que o Mehlich-1, em decorrência do desgaste desse extrator, de modo particular no LV e LVA.
Termos de indexação: fertilizantes fosfatados, fosfatos naturais, extratores de fósforo.
INTRODUCTION
The content of available phosphorus (P), consisting of the sum of the factors soil quantity plus intensity (Q + I) quantified by soil chemical analysis, is represented mainly by the Q value, since the I value tends to be undetectable. Thus, for a correct interpretation of P availability, the phosphorus buffering capacity (PBC) or P capacity factor must be known. This factor is estimated from soil properties correlated with the clay content or with remaining P, when PBC-sensitive extractants such as Mehlich-1 are used (Oliveira et al., 2000; Simões Neto et al., 2009).
Several extractors can be used to determine available P. Mehlich-1 or North Carolina, for example, are recommended for acid soils with low CEC, not fertilized with natural or rock phosphate (RPh). Althouth Mehlich-1 is a well-suited extractor for clay soils, it can underestimate available P by consuming H+in buffered soils and because of SO
42-, which is
adsorbed to oxy-hydroxides, which are better represented in the clay fraction than in sandier soils (Novais et al., 2007).
2008a; Bortolon et al., 2011). For soils rich in Ca-bound P (P-Ca), the Anionic Exchange or Mixed Resin, Bray-1 and Mehlich-3, with low extraction capacity of P-Ca, should be more efficient than Mehlich-1 to measure plant-available P, particularly for short-cycle crops (Alcântara et al., 2008). However, the levels of P obtained by P-Ca sensitive extractors, e.g. Mehlich-1, may be correlated with the response of perennial crops (Fernández et al., 2000), when RPh is the main P source. However, the effectiveness of Mehlich-1 is insufficient when P-Ca is the predominant plant P source, particularly for short cycle- crops (Santos & Kliemann, 2005).
The Anionic Resin (AR)-based method developed by Amer et al. (1955), has been commonly used to determine available P in soil treated or not with reactive RPh. Currently, the extractor used to quantify available P in soil fertility laboratories of the official network of the State of São Paulo is the Ion Exchange or Mixed Resin (MR) extractant (50 % anionic and 50 % cationic resins) (Raij et al., 1987). In a single extraction, MR evaluates not only the availability of P but also of other exchangeable cations, such as K+,
Ca2+, Mg2+. This process induces P adsorption in
solution (I) to the positive charges of AR, and consequently, the removal of P adsorbed on the surface of soil particles, but in equilibrium with solution P (I), so basically the labile P (Q) of the soil is quantified (Skogley & Doberman, 1996). However, the substitution of AR for MR may overestimate the P availability, in comparison with the values obtained with AR alone. The Ca-extraction by cation resin allows to drain P derived from bound, non-labile forms, inducing additional solubilization of RPh, or generically of P-Ca forms that may exist in the soil (Robinson & Syers, 1990).
The fractionation of soil inorganic P has shown that P accumulated in the plant (short cycle) correlates mainly with P-Al and P-Fe fractions and is practically not or weakly correlated with the P-Ca fraction (Viégas et al., 2010). On the other hand, not immediately available forms such as P-Ca generally become slowly and gradually available to perennial plants. Thus, the comparison between the P contents quantified by AR alone or by MR, for soils treated with soluble P fertilizer and RPhs, will answer questions regarding the behavior of these two extraction forms of available P in comparison with the traditional Mehlich-1 extractant.
About the effect of the contact time of the processed (soluble) or natural (reactive or unreactive RPh) P source with the soil, it is known that with increasing soil adsorption capacity, P solubilized from the source will generally be adsorbed by the soil (labile form) and later fixed (non-labile) by kinetics that are positively related to the solubility/reactivity of the sources (Novais & Smyth, 1999). Therefore, the time effect is related to the solubility/reactivity of the P source and the soil properties (higher or lower P adsorption
capacity). To evaluate this effect over time, anionic exchange resin or chemical extractants are often used. The more acidic (pH 1.2) extractors, e.g. Mehlich-1, are seriously limited, while ideally the increase in soil
Ca2+ content caused by rock phosphate would be
exploited.
The aim of this study was to quantify available P in three Latosols treated with different P sources and rates and exposed to different soil-P source contact times, using the extractors Mehlich-1, Anionic Resin and Mixed Resin.
MATERIAL AND METHODS
The study was conducted in a laboratory of the Department of Soil Science, Federal University of Viçosa, at room temperature (25-35 oC). For this
purpose, samples were collected from the 0-20 cm layer of three Latosols with different textures: a very clayey Red Latosol (LV), from the region of Sete Lagoas; a sandy clay loam Red-Yellow Latosol (LVA), from the region Três Marias; and a sandy loam Yellow Latosol (LA), from the North of Espírito Santo. The soil samples were air-dried, sieved (2 mm) and mixed (ADFE) and sent to a laboratory for physical and chemical analyses.
The soil physical and chemical properties were quantified (Table 1), using Mehlich-1 to determine P and K; extractor 1 mol L-1 KCl for Ca2+, Mg2+and Al3+;
extractor calcium acetate 0.5 mol L-1 pH 7.0 for H+Al;
Property LV LVA LA
pH (H20) 4.79 4.37 5.39
Organic matter (g kg-1) 56.3 12.8 20.5
P (mg dm-3) 1.3 0.4 7.1
Prem(1) (mg L-1) 12.0 25.3 47.4
K (mg dm-3) 21.0 19.0 121.0
Ca2+ (cmol
c dm-3) 1.43 0.15 2.93 Mg2+ (cmol
c dm-3) 0.08 0.0 1.03 Al3+ (cmol
c dm-3) 1.09 0.50 0.00
H+Al (cmolc dm-3) 10.6 3.6 1.6
Al3+ saturation (%) 41.1 71.4 0.0
Sum of bases (cmolc dm-3) 1.56 0.20 4.27
Base saturation (%) 12.8 5.3 72.7
Effective CEC (cmolc dm-3) 2.65 0.70 4.27 CEC pH 7.0 (cmolc dm-3) 12.16 3.80 5.87
Coarse sand (g kg-1) 80 340 610
Fine sand (g kg-1) 30 340 160
Silt (g kg-1) 90 40 40
Clay (g kg-1) 800 280 190
Table 1. Chemical and physical properties of the soil samples used in the experiment
and soil pH in water at a soil:water ratio of 1:2.5. Remaining P was estimated as proposed by Alvarez V. et al. (2000). The organic carbon content was determined by the Walkley-Black method; P by colorimetry, K by flame photometry (Braga & Defelipo, 1974); and Ca and Mg by atomic absorption spectrophotometry.
The method proposed by Ruiz (2005) was applied for particle-size analysis.
The three sources (triple superphosphate, Gafsa phosphate rock and Araxá nonreactive phosphate) were subjected to nitric-perchloric digestion to quantify total P, Ca and Mg (Table 2).
A randomized block design was used, with treatments arranged in a factorial arrangement [(3 x 3 x 2) + 3] x 4 with four replications, consisting of three soils with different texture (loamy, sandy and average), three sources (triple superphosphate, Gafsa and Araxá phosphate rock), two P source rates (75 and 150 mg dm-3), plus three soils without P application
(controls) for four contact periods (15, 30, 60, and 120 days) of P sources with soils. The experiment was arranged in a split plot design in time, in which the soil, the P sources and P rates were the plot treatments, and the contact time, the subplot treatments.
The soil acidity of LV and LVA was adjusted by raising base saturation to 60 % with the application of CaCO3 and MgCO3 at a molar ratio of 4:1 (LA
required no correction). The soils were packed in plastic bags. These samples were maintained at field moisture capacity for 30 days. Thereafter, the soils were dried, ground and separated in 1-dm3 portions for the P
treatments. After applying the phosphate source and mixing it with the soil, the soil moisture was raised to field capacity and the material packed in 2 dm3
plastic bags.
Subsamples were collected from each experimental unit 15, 30, 60, and 120 days after application of the P sources and the P levels extracted by Mehlich-1 were determined (0.0125 mol L-1 H
2SO4 + 0.05 mol L-1)
HCL (Nelson et al., 1953), Anionic Resin (AR, Amberlite IRA-400) (Amer et al., 1955), and mixed resin (MR, 50 % of Amberlite IRA-400 + 50 % of Amberlite IR-120) (Raij & Quaggio, 2001). The resins were prepared as described by Raij & Quaggio (2001). To quantify available P based on AR and MR, 2.5 cm3 of soil were placed in 80 mL conical plastic
vessels, together with 25 mL of deionized H2O and a
medium-sized glass sphere, and agitated in a horizontal circular shaker for 15 min at 220 rpm to break up the soil. After this period, the glass ball was removed and 2.5 cm3 of AR or MR added, treated
with 1 mol L-1 NaHCO
3 at pH 8.5. This mixture
containing MR or AR plus deionized H2O was
subjected to horizontal circular shaking (220 rpm for 16 h). After this agitation period, the resin was separated from the soil employing polyester sieve (0.4 mm mesh) and jets of deionized water and transferred individually to a 100 mL flask, to which 50 mL of 0.8 mol L-1 NH
4Cl in 0.2 mol L-1 HCl was
added and allowed to rest for 30 min to eliminate carbon dioxide. Thereafter, the bottles were closed, for circular horizontal agitation (220 rpm for 1 h). The P contained in the resin-extracted solution (AR or MR) was measured by colorimetry, as proposed by Braga & Defelipo (1974).
For the determination of soil P by Mehlich-1, 10 cm3
of soil (TFSA) were filled in a 125 mL Erlenmeyer flask, together with 100 mL extractor. These mixtures were shaken horizontally (190 rpm for 5 min), and after 16 h settling, aliquots of the supernatant were removed and the P contents quantified (Braga & Defelipo, 1974).
The results were subjected to analysis of variance and the effect of contact time for each combination of soil, source and P rate was assessed by regression equations. The treatment means of each soil were compared by Tukey’s test at 5 % for each combination of P source, rate and contact time.
RESULTS AND DISCUSSION
Effect of contact time
In general, a reduction in P levels extracted from the soils by all three extractants (Mehlich-1 - M1, Mixed Resin - MR and Anionic Resin - AR), was found after longer contact periods with the P sources (Tables 3, 4, 5 and 6). This reduction was most pronounced for triple superphosphate, intermediate for reactive phosphate, while Araxá phosphate was least sensitive to the effect of time. Similar results were reported elsewhere for soluble P sources (Gonçalves et al., 1985; Campello et al., 1994), rock phosphates (Novelino et al., 1985). Gonçalves et al. (1985) observed that by incorporating a soluble P source in soil with the characteristic P-drain, more than 90 % of P is adsorbed in the first hours of contact. It is noteworthy that in this study, samples of three Latosols with characteristic P-drain were used, and that the marked decrease in P levels indicated by the three extractors when using superphosphate is a consequence of the immediate release of P into the soil solution (Novais & Smyth, 1999). It was also observed that the reductions in available P levels were much lower, or
Source P2O5 Ca M g
g kg-1 Reactive phosphate from Gafsa - Tunisia 304.3 346.8 14.1 Natural phosphate from Araxá - MG 264.2 328.1 1.9
Triple superphosphate 456.4 149.9 2.9
Table 2. Total contents(1) of P, Ca and Mg in the P
sources
in some cases zero, after 30 days of contact, as a result of P immobilization reactions in soils.
Although a longer contact time has a positive influence on the solubilization of Araxá RPh, estimated by the increased Ca2+ content in the soil, it is known
that the P content of the non-labile fraction increases faster than the labile fraction (Novais et al., 1980; Novelino et al., 1985), so that in soil with lower values of remaining P (more weathered and therefore more buffered), the effect of contact time favors the decrease of P content, and consequently, limits plant growth. In little weathered or organic matter - rich soils, with strong preponderance of negative over positive
charges, solubilization of RPhs is most likely primarily caused by Ca2+ consumption released from phosphate
by the soil CEC (Corrêa et al., 2005), so that the effect of contact time on plant growth is less negative or even insignificant. Under these conditions, the P plant drain can become more effective than the P soil drain during the contact period, controlling the solubilization kinetics and P availability to plants.
In the specific case of MR, the P levels decreased with time after application of Araxá RPh, but less than after Gafsa RPh and still less after superphosphate application. It was also observed that the effect of time is generally most clearly detected in
Source Rate
LV(1) LVA(2) LA(3)
Extractor
AR MR M1 AR MR M1 AR MR M1
mg dm-3
15 Test.(4) 0 3.35 a 5.85 a 1.99 a 3.60 a 3.85 a 0.46 a 8.52 a 11.38 a 8.25 a Gafsa 75 15.30 b 37.33 a 42.04 a 13.59 b 35.87 a 36.55 a 14.46 c 45.47 b 81.27 a
150 24.55 c 55.85 b 81.16 a 28.43 c 63.41 b 103.81 a 16.81 c 75.49 b 132.48 a Araxá 75 4.37 b 8.67 b 31.21 a 4.40 b 6.46 b 31.29 a 12.54 b 16.00 b 69.42 a 150 4.87 c 12.83 b 61.36 a 4.34 c 14.89 b 68.63 a 13.15 c 23.47 b 125.44 a TS(5) 75 24.32 b 29.92 a 14.51 c 27.95 a 31.44 a 15.03 b 49.90 a 47.62 a 52.58 a 150 46.34 b 55.74 a 29.70 c 61.75 a 63.92 a 37.80 b 103.59 a 106.50 a 101.11 a
30 Test. 0 5.78 a 5.75 a 2.20 a 3.77 a 4.03 a 1.05 a 6.14 a 11.26 a 8.32 a
Gafsa 75 13.11 b 23.99 a 27.20 a 14.31 c 27.57 b 33.25 a 19.82 c 42.06 b 76.31 a 150 19.65 b 48.66 a 54.04 a 24.24 c 57.64 b 79.09 a 18.74 c 69.74 b 116.15 a Araxá 75 7.56 b 8.65 b 23.77 a 7.53 b 7.23 b 27.67 a 6.87 c 15.41 b 50.51 a 150 6.32 c 12.04 b 54.20 a 6.02 c 12.85 b 64.71 a 10.87 c 21.15b 106.23 a TS 75 21.15 a 25.88 a 12.17 b 24.65 a 26.26 a 12.02 b 47.95 a 42.34 b 46.09 a 150 40.43 b 47.92 a 23.31 c 53.83 a 56.55 a 31.32 b 103.67 a 93.90 b 92.47 b
60 Test. 0 3.56 a 2.10 a 1.63 a 3.50 a 1.65 a 0.53 a 8.86 a 7.97 a 7.05 a
Gafsa 75 10.38 b 23.08 a 18.90 a 12.05 b 28.09 a 22.74 a 10.79 c 36.22 b 66.40 a 150 16.47 c 47.70 b 57.19 a 17.70 c 45.97 b 72.64 a 12.87 c 57.49 b 148.92 a Araxá 75 3.97 b 9.54 b 23.77 a 4.09 b 7.70 b 24.40 a 4.84 c 13.12 b 54.92 a 150 4.31 c 10.82 b 46.63 a 4.19 c 10.24 b 55.18 a 9.79 c 15.89 b 106.78 a TS 75 15.97 b 22.44 a 9.09 c 20.02 a 24.81 a 10.41 b 35.65 b 47.54 a 44.11 a 150 34.08 a 39.28 a 20.05 b 44.39 b 54.14 a 28.99 c 75.75 b 94.17 a 91.71 a
120 Test. 0 3.48 a 5.61 a 2.04 a 3.48 a 0.89 a 0.71 a 8.70 a 8.20 a 7.82 a
Gafsa 75 10.71 b 21.47 a 23.39 a 13.47 b 28.13 a 24.21 a 15.70 c 38.76 b 62.68 a 150 20.48 c 48.57 b 56.15 a 28.68 c 47.35 b 71.44 a 19.37 c 73.45 b 146.32 a Araxá 75 3.48 b 8.65 b 21.89 a 3.48 b 7.77 b 25.22 a 10.10 b 13.61 b 53.50 a 150 8.31 b 12.03 b 45.06 a 8.06 b 13.17 b 58.86 a 10.86 c 18.90 b 111.98 a TS 75 16.56 a 19.24 a 10.45 b 21.51 a 22.42 a 10.85 b 45.29 a 49.89 a 45.86 a 150 34.02 a 36.53 a 20.49 b 51.13 a 51.80 a 29.16 b 99.69 a 96.38 a 92.15 b Contact
period
Table 3. Phosphorus contents determined after extraction with anionic resin (AR), mixed resin (MR) and Mehlich-1 (M1) in Latosols samples treated with P sources and levels, after different contact periods of the P sources with soil
clay soil (LV, 800 g kg-1 clay), by the three extractors,
as also mentioned by Robinson et al. (1992). It is noteworthy that, at rates of 75 and 150 mg dm-3,
available P showed the same tendency for soils, sources and extractors.
Effect of preferential extraction of P-Ca and of Mehlich-1 consumption
The M1-extracted P levels exceeded those extracted by the two resins, considering the average Araxá RPh rates and contact times (Table 7). Acid extractors solubilize predominantly P-Ca, resulting in an overestimation of available P, as in the treatments with Araxá RPh and at smaller amounts, with Gafsa RPh, as also observed by Novelino et al. (1985). Nevertheless, P extracted by very P-Ca-sensitive extractors, e.g. M1, may be correlated with the plant response when RPh is the main P source, particularly in the case of plants with rhizosphere acidification and high CA-demand (plants with high Ca-drain) and for those with slower growth, in general, perennials (Fernández et al., 2000).
It was observed that AR extracted lower P amounts from all three soils when Gafsa RPh was the P source and even lower levels after Araxá RPh applications (at mean rates of 75 and 150 mg dm-3), since this
extractor is not P-Ca-sensitive. However, for this same P source, MR extracted levels close to those obtained by M1, although statistically different for LVA and in particular, for LV soil (Table 7). A similar result was reported by Ieiri et al. (2010), who also extracted less P using AR than M1, from a medium-textured dystrophic Red Latosol fertilized with Gafsa RPh.
For triple superphosphate, both resins extracted very close but statistically different P levels, and higher than M1. However, in the clayey soil (LV), with lower remaining P (Table 1), the difference between the results in the comparison of the extractors was greater (much less for M1). In the sandy soils (LVA and LA) (Table 1), which is a condition for lower M1consumption, the extracted P contents approached, although statistically still lower, the levels of the resins (Table 7). This comparison requires the use of a buffer measure of
Source Rate Equation R2
Anionic resin
Control 0 RA = RA = 4.04
Gafsa 75 = 17.9056 – 0.19148** T + 0.001100* T2 0.9999
150 = 28.9783 – 0.35886** T + 0.00240** T2 0.9748
Araxá 75 = = 4.85
150 = 4. 3927 + 0.02776* T 0.5202
Triple superphosphate 75 = 28.9203 – 0.32362** T + 0.00184* T2 0.9973
150 = 52.5406 – 0.46830** T + 0.00262** T2 0.9974
Mixed resin
Control 0 = 4.82
Gafsa 75 -10.96210** T1/2+ 0.60780** T 0.8790
150 = 75.9062 – 6.92734* T1/2+ 0.40658** T 0.9101
Araxá 75 = 8.88
150 = 11.93
Triple superphosphate 75 = 29.6121 – 0.09310** T1/2 0.8901
150 = 86.0585 – 9.55474** T1/2+ 0.45891* T 0.9986
Mehlich-1
Control 0 = 1.96
Gafsa 75 = 53.2699 – 0.94693** T + 0.00583** T2 0.9557
150 87.9258 – 0.94455** T + 0.00572** T2 0.6288
Araxá 75 28.8687 – 0.06593** T 0.5500
150 68.5273 – 0.54472** T + 0.00291** T2 0.9966
Triple superphosphate 75 = 11.55
150 34.0712 – 0.37841** T + 0.00222** T2 0.9472
RA RA RA RA RA RA
RA
RM RM
RM RM RM RM RM RM RM RM
69,1511
M1 M1
M1 M1 M1 M1 M1 M1 M1
Table 4. Equations for the P contents (mg dm-3) by the extractants: Anionic resin (AR), Mixed resin (MR) and
Mehlich-1 (M1), in function of the contact time (T, in days) with a very clayey Red Latosol (LV), after applying P sources at different rates
the soil, e.g., of the clay content (Bortolon & Gianello, 2008), or more appropriate, remaining P (Simões Neto et al., 2009), to compare the results of available P extracted by consumption-sensitive extractors such as M1 and non-sensitive (or very little sensitive) extractants such as Ionic Resins. This tendency was explained by Schlindwein & Gianello (2008b) and Simões Neto et al. (2009), who mentioned the key influence of the soil clay content on the extraction capacity of M1 and AR.
In medium-textured and clayey soils, M1 consumption became increasingly more evident when soluble P sources such as superphosphate were used, given the immediate release of the P contents into the soil solution; in this situation, the degree of extractor consumption is less relevant. The literature reports that the extraction power of an extractor is exhausted or worn out, leading to the underestimation of the levels of available soil P, to the same extent as the clay content of the soil increases (Bortolon &
Gianello, 2008) or remaining P decreases (Simões Neto et al., 2011) (Tables 1 and 7).
In the sandiers soils (LVA and LA), which is a condition for a lower consumption of M1, the differences in P extraction between this extractor and MR tended to be smaller, though statistically different, after the application of Gafsa RPh, owing to two contrasting effects: the first characterized by great P-Ca extraction from Gafsa RPh and the second by the consumption of this extractor, resulting in underestimated available P levels. For Araxá RPh, these effects follow the same tendency as for Gafsa RPh, though with a greater difference between M1 and MR; in this case, there was a strong predominance of P-Ca extraction on loss of extraction power of M1 due to consumption, even for the more clayey and buffered (LV) soil (Table 7).
The extraction of P from rock phosphates by MR was similar to M1 because MR, when extracting anions and cations, acts as Ca-drain and is not worn
Source Rate Equation R2
Anionic resin
Control 0 = = 3.59
Gafsa 75 = = 13.35
150 = 36.0097 - 0.53629** T + 0.00396** T2 0.9886
Araxá 75 =
= = =
= 4.85
150 3.9761 + 0.02982* T 0.5857
Triple superphosphate 75 32.3842 - 0.31931** T + 0.00190* T2 0.9992
150 71.7971 - 0.74124** T + 0.00474** T2 1.0000
Mixed resin
Control 0 = = 2.60
Gafsa 75 = 55.0648 - 6.76421* T1/2+ 0.39618* T 0.8016
150 73.3454 - 0.67616** T + 0.00382** T2 0.9902
Araxá 75 = = 7.29
150 = = 12.79
Triple superphosphate 75 30.2669 - 0.07172** T 0.7617
150 67.5824 - 0.35299** T + 0.00186* T2 0.9142
Mehlich-1
Control 0 =
=
= =
= 0.69
Gafsa 75 44.8894 - 0.53615** T + 0.00302** T2 0.9658
150 = 116.1470 - 1.20266** T + 0.00695** T2 0.8786
Araxá 75 34.8136 - 0.27387 * T + 0.00162* T2 0.9917
150 76.8994 - 0.55078 ** T + 0.00333** T2 0.9739
Triple superphosphate 75 = = 12.08
150 41.5467 - 0.34471** T + 0.00202** T2 0.9103
RA RA RA RA RA RA RA
=
= =
RA RA
RA
RM
RM RM
M1 M1 M1 M1 M1 M1 M1 =
M1
M1 RM RM RM RM RM RM RM
Table 5. Equations for the P contents (mg dm-3) by the extractants: Anionic resin (AR), Mixed resin (MR) and
Mehlich-1 (M1), in function of the contact time (T, in days) for a sandy clay loam Red Yellow Latosol (LVA), after the application of P sources at different rates
out, unlike M1. For Souza Júnior et al. (2012), the behavior of MR is similar to that of Mehlich-1, even in Ca2+-rich soils with pH tending to be alkaline, which
is a condition for the predominance of P in P-Ca form. In this study, the extractor performance of MR and M1 was similar, mainly for Gafsa RPh in the LV, a dystrophic very clayey, very buffered Latosol (remaining P = 12.0 m L-1), a condition under which
extractor M1 is largely exhausted.
It should be noted that the AR is not exhausted as M1, although some authors claim that there is consumption of AR, though minimal (Campello et al., 1994; Fernández R. et al., 2008).
Effect of P-drain and Ca-drain
Resins should theoretically function similarly to roots, which, as they adsorb P from the solution, gradually consume the soil labile P (Gatiboni et al., 2005). In fact, AR can underestimate available P to
Source Rate Equation R2
Anionic resin
Control 0 = = 8.05
Gafsa 75 = = 15.19
150 =
= =
=
= 16.95
Araxá 75 = 16.6543 - 0.36101** T + 0.00256** T2 0.9278
150 14.8145 - 0.14288* T + 0.00092* T2 0.9388
Triple superphosphate 75 60.3655 - 0.64544 ** T + 0.00432 T2 0.8761
150 126.1600 - 1.31006** T + 0.00904 T2 0.7794
Mixed resin
Control 0 = = 9.70
Gafsa 75 66.7244 - 6.87001* T1/2+ 0.39252* T 0.9494
150 129.5440 - 18.06370** T1/2+ 1.17639** T 0.8691
Araxá 75 =
= =
= = =
= = =
= =
= 14.74
150 28.2554 - 0.32187** T + 0.00203* T2 0.9738
Triple superphosphate 75 44.3857 - 0.04379* T 0.4048
150 139.1090 - 11.49290** T1/2+ 0.69730** T 0.8351
Mehlich-1
Control 0 = = 7.86
Gafsa 75 88.9026 - 0.51898** T + 0.00250** T2 0.9963
150 124.0320 + 0.21216** T 0.4680
Araxá 75 105.8230 - 13.15110** T1/2+ 0.77310** T 0.6595
150 177.1530 - 18.29280** T1/2+1.13309** T 0.8390
Triple superphosphate 75 56.3566 - 0.35066** T + 0.00220** T2 0.8857
150 104.5670 - 0.37514** T + 0.00228** T2 0.7822
= RA RA RA RA RA RA RA
RA RA RA
RM RM RM RM RM RM RM
RM
RM
M1 M1 M1 M1 M1 M1 M1
M1
Table 6. Equations for P contents (mg dm-3) by the extractants: Anionic resin (AR), Mixed resin (MR) and
Mehlich-1 (M1), in function of the contact time (T, in days) with a sandy loam Yellow Latosol (LA), after application of P sources at different rates
*, **: Significant at 5 and 1 %, respectively, by the F test.
the plants, particularly for perennials, for not promoting the solubilization of some non-labile P forms such as P-Ca, which some plants solubilize in the acid environment of the rhizosphere or by high Ca-absorption. For the two RPhs it was also observed that the MR-extracted P levels were far higher than those obtained by AR, independent of the soil clay content (Table 7). These higher concentrations extracted by MR can probably be explained by the fact that MR extracts Ca simultaneously with P from the soil. With the dissolution of the RPhs in the soil,
the Ca2+ and of H
2PO4- (also of HPO42-)
Ca-drain was most important for the solubilization of Gafsa RPh, compared with the P-drain or even with the pH.
Some questions may arise regarding the MR and its behavior as multiple extractor, which could simplify the routine of soil analysis laboratories (Raij et al., 1986), based on comparisons of the behavior of this extractor with that of the plant, and the
dependence of P extraction from RPhs with Ca2+
extraction as well. It can be argued that plants also extract Ca, making MR convenient for having, similarly to plants, a Ca-drain. However, it should be remembered that a crop extracts per hectare somewhat less than 10 mmolc dm-3, whereas MR can
extract more than 100 times more Ca2+ from a soil
than plants.
Therefore, the much higher Ca-drain of MR than of plants suggests that the overestimated P values by this extractor, compared to AR, is probably closer to the plant demand than MR. Similarly, MR is closer to M1 than AR and can be held responsible for overestimated values of available P in weathered soils treated with RPhs or those naturally rich in P-Ca, as is generally the case with soils of temperate climate, mainly for short-cycle plants. It could be hypothesized that AR would be more suitable for short-cycle crops and MR for perennials.
Correlation matrix between extractors
The comparison between levels of soil P determined by different extractants in a correlation matrix, does not seem appropriate when different soils are involved, with different values of buffering capacity (clay content or Prem) and, not less important, using P sources from soluble to RPhs with different reactivity (a reactive versus a non-reactive source, for example). As discussed above, buffering capacity-sensitive soil extractors, e.g. M1, susceptible to increasing exhaustion of its extraction power with increasing soil buffering capacity, cannot be compared with Ionic Resins, unaffected by such consumption, unless a correction factor is included for the P levels extracted by M1 (Novais & Kamprath, 1978; Bahia Filho et al., 1983).
Similarly, P-Ca sensitive extractors such as M1 cannot be compared with AR, which is not P-Ca-sensitive, or this in turn with MR, which is moderately sensitive to M1 and AR. This shows that studies of simple linear correlation between extractors are little useful or cause gross errors and misinterpretations when different P sources are compared (Bahia Filho et al., 1983).
For the average soil P concentrations, sources and rates (Table 8), it was shown that the correlation coefficients between extractors are very little or
Resin
Soil Rate Anionic Mixed Mehlich-1
mg dm-3 Control
LV 0.0 4.04 ab 4.83 a 1.96 b
LVA 0.0 3.59 a 2.60 ab 0.69 b
LA 0.0 8.06 a 9.70 a 7.86 a
Gafsa phosphate
LV 75 and 150 16.33 c 38.33 b 45.01 a LVA 75 and 150 19.06 c 41.76 b 55.47 a LA 75 and 150 16.07 c 54.83 b 103.82 a
Araxá phosphate
LV 75 and 150 5.40 c 10.40 b 38.49 a LVA 75 and150 5.26 c 10.04 b 44.49 a LA 75 and 150 9.88 c 17.19 b 84.85 a
Triple superphosphate
LV 75 and 150 29.11 b 34.62 a 17.47 c LVA 75 and 150 38.15 b 41.42 a 21.95 c LA 75 and 150 70.19 b 72.29 a 70.76 ab
Table 7. Available phosphorus by the three tested extractants, considering rate 0 and mean P rates of 75 and 150 mg dm-3, and mean contact times,
for rock phosphates from Gafsa and Araxá and Triple superphosphate
Means followed by the same letter, in the row, did not differ statistically at 5 % by the Tukey test.
Contact time Variable AR MR
day
General(1) MR 0.8358**
M1 0.2600ns 0.5836**
15 MR 0.8297**
M1 0.2304ns 0.5623**
30 MR 0.8246**
M1 0.2787ns 0.5879**
60 MR 0.8644**
M1 0.2106ns 0.5409**
120 MR 0.8454**
M1 0.30490 0.6293**
Gafsa MR 0.6002**
M1 0.4022* 0.9103**
Araxá MR 0.7682**
M1 0.7316** 0.9324**
Triple superphosphate MR 0.9761**
M1 0.9467** 0.9485**
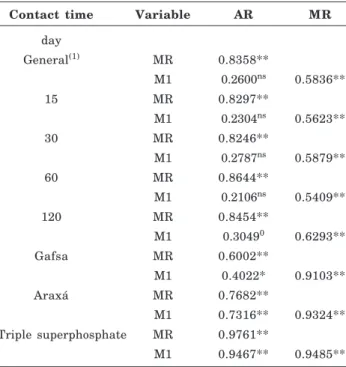
Table 8. Matrix of the general correlation between extractors (Anionic resin - AR, Mixed resin - MR and Mehlich-1 - M1) within each contact time for the means of soils, sources and P rates, and within each source, for the means of the contact times, soils and P rates
insensitive to the effect of contact time, which can be noted by the similarity between these coefficients with the average time. In all these comparisons, AR was correlated with MR (the effects of consumption and P source, essentially the first exhausted). On the other hand, the correlation between M1 and AR was non-significant (M1very sensitive to consumption, while AR non-sensitive and unable to extract P-Ca as M1). However, M1 was correlated with MR by absolute coefficient values of the order of 0.50 - 0.60, due to the higher P-Ca-sensitivity of MR than AR, and the great sensitivity of M1 to this form of mineral P.
When the effect of the P source was isolated, maintaining the soil effect and its influence on the effect of extractor consumption (Table 8), the dispersion between the values of correlation coefficients was greater due to the P source effect. The extractors showed the best correlation coefficients (regarding significance and highest absolute values) when the P source was triple superphosphate without the P-Ca form, which causes differential behavior between the extractors. Under this condition, which is more common in tropical, more weathered (P-Ca-poor) soils, not treated with RPhs, the behavior of the three extractors was similar, although under this condition the soil effect on M1-consumption was not isolated.
One can consider, for these conditions of non-influence of P-Ca on the behavior of M1, that the effect of consumption is less marked than that of P-Ca, considering it as the deviation from the maximum value of the correlation coefficient (1.00), in this case, the consumption effect, disregarding the experimental error, was assumed to be constant.
When the P source effect was eliminated, the previously non-significant correlations between M1 and AR became significant (Table 8).
As already discussed, for the conditions under which RPh (from Gafsa and Araxá) was used, M1 was closer (higher values of correlation coefficients with higher significance level) to MR than to AR. Therefore, one can conclude that MR is also P-Ca-sensitive, which does not seem to apply to AR, as theoretically expected.
CONCLUSIONS
1. Mixed resins (anionic + cationic) extract more P than anionic resins from soils treated or not treated with natural reactive phosphates.
2. Mehlich-1 was highly sensitive to natural phosphates, extracting higher P levels than the resins, in particular more than anionic resin.
3. The P content extracted from the soil by the three extractors decreased with increasing contact time of the P sources with soil. Of the three P sources, this reduction was most pronounced for triple superphosphate, intermediate for Gafsa (reactive)
phosphate, while Araxá (non-reactive) phosphate was least influenced by the effect of time
ACKNOWLEGEMENT
The authors thank the Fundação de Amparo à Pesquisa do Estado de Minas Gerais (FAPEMIG) for the Pos Doctoral scholarship to Dra. Ecila Mercês de Albuquerque Villani.
LITERATURE CITED
ALCÂNTARA, F.A.; FURTINI NETO, A.E.; CURI, N. & RESENDE, A.V. Extraction methods for phosphorus and their relationship with soils phosphorus-buffer capacity estimated by the remainingphosphorus methodology -A pot study with maize. Commun. Soil Sci. Plant -Anal., 39:603-615, 2008.
ALVAREZ V., V.H.; NOVAIS, R.F.; DIAS, L.E. & OLIVEIRA, J.A. Determinação e uso do fósforo remanescente. B. Inf. SBCS, 25:27-32, 2000.
AMER, F.; BOULDIN, C.A.; BLACK, C.A.Q. & DUCKE, F.R. Characterization of soil phosphorus by anion exchange resin absorption and 32P equilibration. Plant Soil, 6:391-407, 1955.
BAHIA FILHO, A.F.C.; BRAGA, J.M.; RESENDE, M. & RIBEIRO, A.C. Relação entre adsorção de fósforo e componentes mineralógicos da fração argila de Latossolo do Planalto Central com diferentes características texturais e mineralógicas. R. Bras. Ci. Solo, 7:221-226, 1983. BORTOLON, L. & GIANELLO, C. Interpretação de resultados
analíticos de fósforo pelos extratores 1 e Mehlich-3 em solos do Rio Grande do Sul. R. Bras. Ci. Solo, Mehlich- 32:2751-2756, 2008.
BORTOLON, L. & GIANELLO, C. Phosphorus availability to maize determined by several methods on Rio Grande do Sul (Brazil) soils. In: INTERNATIONAL SYMPOSIUM PHOSPHORUS DYNAMICS IN SOIL-PLANT CONTINUUM, 3., Uberlândia, 2006. Anais… Uberlândia, Embrapa, 2006. p.49-52.
BORTOLON, L.; GIANELLO, C.; WELTER, S.; ALMEIDA, R.G.O. & GIASSON, E. Simultaneous extraction of phosphorus, potassium, calcium and magnesium from soils and potassium recommendations for crops in Southern Brazil. Pedosphere, 21:365-372, 2011. BRAGA, J.M. & DEFELIPO, B.V. Determinação
espectrofotométrica de fósforo em extratos de solo e material vegetal. R. Ceres, 21:73-85, 1974.
CORRÊA, R.M.; NASCIMENTO, C.W.A.; SOUZA, S.K.S.; FREIRE, F.J. & SILVA, G.B. Gafsa rock phosphate and triple superphosphate for dry matter production and p uptake by corn. Sci. Agric., 62:159-164, 2005.
FERNÁNDEZ R., I.E.J.; NOVAIS, R.F.; NUNES, F.N. & KER, J.C. Reversibilidade do fósforo não-lábil em solos submetidos à redução microbiana e química. II - Extrações sucessivas do fósforo pela resina de troca aniônica. R. Bras. Ci. Solo, 32:2319-2330, 2008.
FERNÁNDEZ, J.Q.P.; DIAS, L.E.; BARROS, N.F.; NOVAIS, R.F. & MORAES, E.J. Productivity of Eucalyptus
camaldulensis affected by rate and placement of two
phosphorus fertilizers to a Brazilian Oxisol. For. Ecol. Manage., 127:93-102, 2000.
GATIBONI, L.C.; KAMINSKI, J. & SANTOS, D.R. Modificações nas formas de fósforo do solo após extrações sucessivas com Mehlich-1, Mehlich-3 e Resina trocadora de ânions. R. Bras. Ci. Solo, 29:363-371, 2005.
GONÇALVES, J.L.M.; FIRME, D.J.; NOVAIS, R.F & RIBEIRO, A.C. Cinética de adsorção de fósforo em solos de cerrado. R. Bras. Ci. Solo, 9:107-111, 1985.
IEIRI, A.Y.; LANA, R.M.Q.; KORNDÖRFER, G.H. & PEREIRA, H.S. Fontes, doses e modos de aplicação de fósforo na recuperação de pastagem com brachiaria. Ci. Agrotec., 34:1154-1160, 2010.
NELSON, W.L.; MEHLICH, A. & WINTERS, E. The development, evaluation and use of soil test for phosphorus availability. In: PIERRE, W.H. & NORMAN, A.G., eds. Soil fertilizer phosphorus. New York, Academic Press, 1953. p.153-188. (Agronomy, 14)
NOVAIS, R.F. & KAMPRATH, E.J. Phosphorus supplying capacities of previously heavily fertilized soils. Soil Sci. Soc. Am. J., 42:931-935, 1978.
NOVAIS, R.F.; BRAGA, J.M. & MARTINS FILHO, C.A.S. Efeito do tempo de incubação do fosfato-de-Araxá em solos sobre o fósforo disponível. R. Bras. Ci. Solo, 4:153-155, 1980.
NOVAIS, R.F. & SMYTH, T.J. Fósforo em solo e planta em condições tropicais. Viçosa, MG, Universidade Federal de Viçosa, 1999. 399p.
NOVAIS, R.F.; SMYTH, T.J. & NUNES, F.N. Fósforo. In: NOVAIS, R.F.; ALVAREZ V., V.H.; BARROS, N.F.; FONTES, R.L.F.; CANTARUTTI, R.B. & NEVES, J.C.L., eds. Fertilidade do solo. Viçosa, MG, Sociedade Brasileira de Ciências do Solo, 2007. p.471-550.
NOVELINO, J.O.; NOVAIS, R.F.; NEVES, J.C.L.; COSTA, L.M. & BARROS, N.F. Solubilização de Fosfato-de-Araxá, em diferentes tempos de incubação, com amostras de cinco Latossolos, na presença e na ausência de calagem. R. Bras. Ci. Solo, 9: 13-22, 1985.
OLIVEIRA, F.H.T.; NOVAIS, R.F.; SMYTH, T.J. & NEVES, J.C.L. Comparisons of phosphorus availability between anion exchange resin and Mehlich-1 extractions among Oxisols with different capacity factors. Commun. Soil Sci. Plant. Anal, 31:615-630, 2000.
RAIJ, B.van; QUAGGIO, J.A. & SILVA, N.M. Extraction of phosphorus, potassium, calcium and magnesium from soils by an ion-exchange resin procedure. Commun. Soil Sci. Plant Anal., 14:547-566, 1986.
RAIJ, B.van; QUAGGIO, J.A.; CANTARELA, H.; FERREIRA, M.E.; LOPES, A.S. & BATAGLIA, O.C. Análise química de solos para fins de fertilidade. Campinas, Fundação Cargill, 1987. 170p.
RAIJ, B.van & QUAGGIO, J.A. Determinação de fósforo, cálcio, magnésio e potássio extraídos com resina trocadora de íons. In: RAIJ, B.van; ANDRADE, J.C.; CANTARELLA, H. & QUAGGIO, J.A., eds. Análise química para avaliação da fertilidade de solos tropicais. Campinas, Secretaria de Agricultura e Abastecimento, APTA/IAC, 2001. p.189-199. ROBINSON, J.S. & SYERS, J.K. A critical evaluation of the factors influencing the dissolution of Gafsa phosphate rock. J. Soil Sci., 41:597-605, 1990.
ROBINSON, J.S.; SYERS, J.K. & BOLAN, N.S. Importance of proton supply and calcium-sink size in the dissolution of phosphate rock materials of different reactivity in soil. J. Soil Sci., 43:447-459, 1992.
RUIZ, H.A. Incremento da exatidão da analise granulométrica do solo por meio da coleta da suspensão (silte + argila). R. Bras. Ci. Solo, 29:297-300, 2005.
SANTOS, E.A. & KLIEMANN, H.J. Disponibilidade de fósforo de fosfatos naturais em solos de Cerrado e sua avaliação por extratores químicos. Pesq. Agropec. Trop., 35:139-146, 2005. SCHLINDWEIN, J.A. & GIANELLO,C. Nível de suficiência e índice de equivalência entre o fósforo determinado pelos métodos da resina de troca iônica e Mehlich-1. R. Bras. Agroci., 14:299-306, 2008a.
SCHLINDWEIN, J.A. & GIANELLO,C. Calibração de métodos de determinação de fósforo em solos cultivados sob sistema plantio direto. R. Bras. Ci. Solo, 32:2037-2049, 2008b. SIMÕES NETO, D.E.; OLIVEIRA, A.C.; ROCHA, A.T.; FREIRE,
F.J.; FREIRE, M.B.G.S. & NASCIMENTO, C.W.A. Níveis críticos de fósforo em solos cultivados com cana-de-açúcar em Pernambuco. R. Ceres, 58:802-810, 2011.
SIMÕES NETO, D.E.; OLIVEIRA, A.C.; FREIRE, F.J.; FREIRE, M.B.G.S.; NASCIMENTO, C.W.A. & ROCHA, A.T. Extração de fósforo em solos cultivados com cana-de-açúcar e suas relações com a capacidade tampão. R. Bras. Eng. Agríc. Amb., 13:840-848, 2009.
SKOGLEY, O. & DOBERMANN, A. Synthetic ion-exchange resins: Soil and environmental studies. J. Environ. Qual., 25:13-24, 1996.
SOUZA JÚNIOR, R.F.; OLIVEIRA, F.H.T.; SANTOS, H.C.; FREIRE, F.J. & ARRUDA, J.A. Frações de fósforo inorgânico do solo e suas correlações com o fósforo quantificado por extratores e pelo milho. R. Bras. Ci. Solo, 36:159-169, 2012.