http://dx.doi.org/10.1590/1806-9061-2016-0381
Slaughtering
Author(s)
Dias MRI
Dianin KCSII
Bersot LSII
Nero LAI
I Universidade Federal de Viçosa,
Departa-mento de Veterinária, Viçosa, MG, Brazil
II Universidade Federal do Paraná,
Departa-mento de Ciências Veterinárias - Setor Pa-lotina, PaPa-lotina, PR, Brazil
Mail Address
Corresponding author e-mail address Luciano dos Santos Bersot
Universidade Federal do Paraná, Departa-mento de Ciências Veterinárias - Setor Palotina, 85.950-000, Palotina, PR, Brazil Tel: +55 44 3211 8516
Email: lucianobersot@ufpr.br
Keywords
Chicken; self-monitoring; hygiene; slaughtering; processing.
Submitted: October/2016 Approved: February/2017
ABSTRACT
Self-monitoring procedures are adopted by food industries to ensure the quality and safety of final products, considering hygiene and processing criteria. This study aimed to evaluate contamination in chicken processing, considering the microbiological criteria proposed by self-monitoring systems. Environmental samples from reception, slaughtering and processing were collected from three chicken slaughterhouses (Sl1, Sl2, Sl3), and subjected to microbiological analysis to enumerate hygiene indicators microorganisms: mesophilic aerobes, enterobacteriaceae, coliforms and Escherichia coli. The obtained
counts were converted to log10, compared by ANOVA (p<0.05) and self-monitoring microbiological criteria for each slaughterhouse were considered. In reception, the mean counts of hygiene indicator microorganisms in Sl3 were significantly higher than mean counts observed in Sl1 and Sl2 (p<0.05). During slaughtering, the chilling was enough to decrease the mean counts of all hygiene indicator microorganisms in Sl1, Sl2 and Sl3 (p<0.05). Based on self-monitoring criteria, in the first stages of slaughtering the facilities presented higher frequencies of chicken carcasses with counts above their respective reference values. Sl02 presented carcasses with higher counts after final washing, resulting in environmental samples with higher counts when compared to Sl1 and Sl3 (p<0.05). Even considering the high counts observed in the initial steps of chicken processing and slaughtering, the results indicated the efficacy of hygienic procedures in providing chicken carcasses and cuts with low microbiological contamination. Self-monitoring criteria supported these results, and the high levels of microbial contamination during the initial steps of slaughtering require subsequent antimicrobial hygienic procedures.
INTRODUCTION
Food industries seek an ideal system to control microbiological contamination through processing, in order to assure the quality and safety of their end products. This control is a challenge, mainly for the industries that process animal-origin foods, where microbiological contamination is inherent in such raw products, and is usually presented at high levels (Potter et al., 2012; Stannard, 1997). In such
context, a diversity of monitoring tools and systems can be employed by food industries to control contamination through the food chain, and particularly meat processing industries have started to adopt self-monitoring systems based on the recommendations of the federal inspection service and in compliance with international standards for food safety and quality (Brasil 2005).
demands a full knowledge of the processing steps in the target food facility, in order to create a set list of requirements that must be constantly monitored. This set list contains different items, varying from aspects related to the infrastructure (equipment maintenance, environment area, lighting, air circulation), employees (health control, hygienic procedures, dressing), residues (waste, water, pest control) and food processing (monitoring tools, certification)(Brasil 2005). Specific criteria and requirements are defined for each item, based on the food facility characteristics and on internationally and scientifically accepted reference values.
Microbiological contamination is one aspect considered in the control of the food processing environment, once the enumeration of specific groups indicates the hygienic conditions of production (Capita et al., 2003; Ghafir et al., 2008; Scott et al.,
2015). With regards to the self-monitoring approach, microbiological contamination through a food processing step is not only assessed by comparing recorded counts with recognized reference values recommended by food hygiene official organs and commissions; self-monitoring systems also consider the historical record of microbiological contamination in a food processing environment to estimate some reference values, usually calculated as the mean count of a specific hygiene indicator added to its standard deviation. So, a specific reference value is calculated for a specific target hygiene microorganism in a specific facility, allowing proper comparison with subsequent data obtained during the hygiene monitoring of this same food industry. This approach allows the companies to identify fluctuations of the hygienic procedures during slaughtering, based not only on reference values, but on self-monitoring reference values in accordance with proper hygienic goals (Sala
et al., 2015; Milios et al., 2014; Potter et al., 2012;
Scott et al., 2015; Stannard, 1997).
The present study aimed to assess microbiological contamination through chicken processing, considering reference values calculated based on self-monitoring system approach.
MATERIAL AND METHODS
Three chicken slaughterhouses were included in the present study and briefly characterized as follows:
• Slaughterhouse 1 (Sl1): large facility located in Minas Gerais state, Brazil, with the capacity to process180,000 chickens per day, automatic evisceration system, adopted self-monitoring program, allowed to export a variety of chicken products; the processing is inspected by the Brazilian Ministry of Agriculture;
• Slaughterhouse 2 (Sl2): small facility located in Minas Gerais state, Brazil, with the capacity to process 3,500 to 4,000 chickens per day, manual evisceration system, chilled whole chicken is its main end product available for retail sale in its city; the processing is inspected by the city Agriculture Secretariat;
• Slaughterhouse 3 (Sl3): large facility located in Paraná State, Brazil, with the capacity to process 330,000 chickens per day, automatic evisceration system, adopted self-monitoring program, allowed to export a variety of chicken products; the processing is inspected by the Brazilian Ministry of Agriculture.
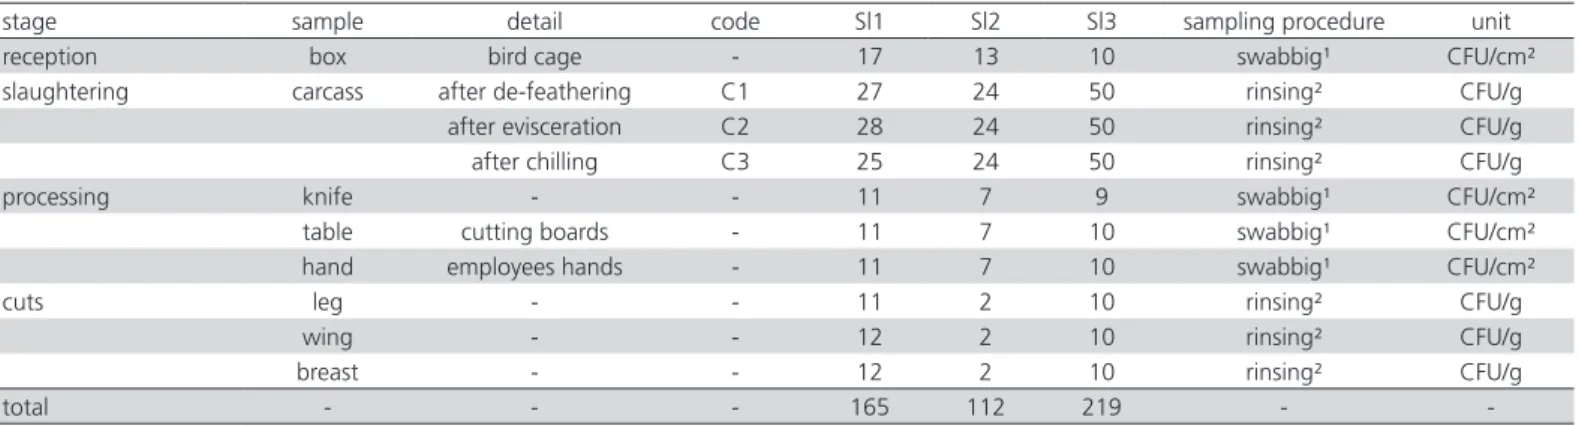
The facilities were visited five to ten times in a period of twelve months; in each visit, samples from different steps of slaughtering process were collected, covering environments, carcasses, equipment, utensils and end products (Table 1). Carcasses and end
Table 1 – Samples and sampling procedures adopted in three chicken slaughterhouses (Sl1, Sl2, Sl3) located in Minas Gerais and Paraná states, Brazil.
stage sample detail code Sl1 Sl2 Sl3 sampling procedure unit
reception box bird cage - 17 13 10 swabbig¹ CFU/cm²
slaughtering carcass after de-feathering C1 27 24 50 rinsing² CFU/g
after evisceration C2 28 24 50 rinsing² CFU/g
after chilling C3 25 24 50 rinsing² CFU/g
processing knife - - 11 7 9 swabbig¹ CFU/cm²
table cutting boards - 11 7 10 swabbig¹ CFU/cm²
hand employees hands - 11 7 10 swabbig¹ CFU/cm²
cuts leg - - 11 2 10 rinsing² CFU/g
wing - - 12 2 10 rinsing² CFU/g
breast - - 12 2 10 rinsing² CFU/g
total - - - 165 112 219 -
products were sampled by rinsing, according to USDA/ FSIS (2014): samples were obtained, transferred to sterile bags and weighed; then, 400 mL of phosphate buffer pH 7.0 (Oxoid Ltd., Basingstoke, England) were added to samples and homogenized. Surface samples were obtained by swabbing sterile sponges previously moistened with 40 mL of phosphate buffer pH 7.0 (Oxoid) in four 100 cm² limited areas of the target sample, and then transferred to sterile bags and added to 160 mL of phosphate buffer pH 7.0 (Oxoid), completing the final volume of 200 mL per sample. All samples were kept under refrigeration until analysis.
The collected samples were ten-fold diluted in NaCl 0.85% (w/v) and plated for enumeration of hygiene indicator microorganisms using Petrifilm™ plates (3M Microbiology, St.Paul, MN, USA). Mesophilic aerobes were enumerated using Petrifilm™ Aerobic Count, after incubation at 35 °C for 24 h; enterobacteriaceae organisms were enumerated using Petrifilm™ Enterobacteriaceae, after incubation at 35 °C for 24h; coliforms and Escherichia coli were enumerated using
Petrifilm™ Escherichia coli, after incubation at 35 °C
for 24 and 48 h, respectively. After incubation, typical colonies were enumerated for each microbiological group, and the results were expressed as colony-forming units per g or cm² (CFU/g or cm2).
The chlorine concentration (parts per million) and temperature (°C) of the water used in the chiller tanks at the end of the chicken slaughtering process were monitored during the visits according to the quality control procedures adopted in the facilities.
Microbiological counts were converted in log10 and compared by Analysis of Variance (p<0.05), in order to check significant differences between facilities and slaughtering stages. In addition, self-monitoring reference values were calculated for each microbiological group recorded from chicken carcasses during the slaughtering stages in each facility, considering their mean values added to their respective standard deviations; then, the frequencies of those chicken carcasses that presented counts higher than these reference values were calculated and compared by chi-square (p<0.05). All statistical analyses were conducted using the software XLStat Version 2013.5.06 (AddinSoft, New York, NY, USA).
RESULTS AND DISCUSSION
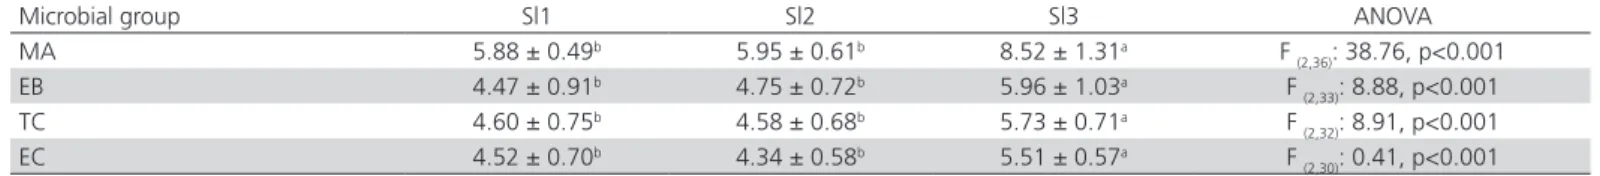
Table 2 presents the mean counts of hygiene indicator microorganisms recorded in the reception of the three chicken slaughterhouses. Sl3 presented higher counts for all microbiological groups when
Table 2 – Mean counts (± standard deviation) of mesophilic aerobes (MA), Enterobacteriaceae (EB), coliforms (TC) and
Escherichia coli (EC) in bird cages from three chicken slaughterhouses (Sl1, Sl2, Sl3). Values in log CFU/cm².
Microbial group Sl1 Sl2 Sl3 ANOVA
MA 5.88 ± 0.49b 5.95 ± 0.61b 8.52 ± 1.31a F
(2,36): 38.76, p<0.001
EB 4.47 ± 0.91b 4.75 ± 0.72b 5.96 ± 1.03a F
(2,33): 8.88, p<0.001
TC 4.60 ± 0.75b 4.58 ± 0.68b 5.73 ± 0.71a F
(2,32): 8.91, p<0.001
EC 4.52 ± 0.70b 4.34 ± 0.58b 5.51 ± 0.57a F
(2,30): 0.41, p<0.001
ANOVA: analysis of variance; p: level of significance (p<005). For each microbial group, values followed by different letters in the same line are significantly different.
compared to Sl1 and Sl2, suggesting poor hygienic conditions in chicken cages and the relevance of the intrinsic contamination in animals as the source of entry of microorganisms into slaughterhouses, as described by Nogrady et al. (2008) and Tirolli & Costa
(2006). However, other aspects of chicken production must be considered to explain such differences and not being considered in this study, such as the age of the birds, their body weights, the feed withdrawal and transport duration and the environment conditions: such aspects can interfere directly the initial microbial contamination of slaughtering facilities.
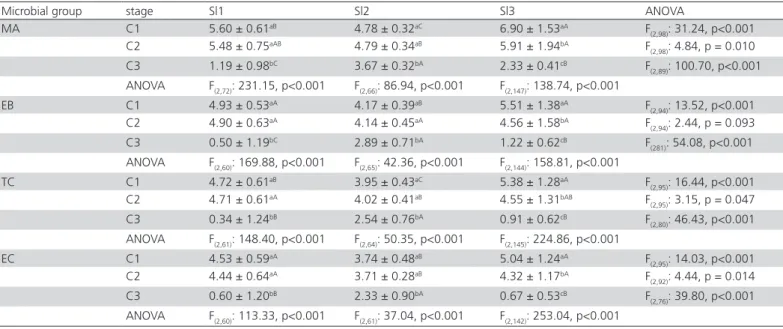
Mean counts of microbiological groups obtained during chicken slaughtering in Sl1, Sl2 and Sl3 are presented in Table 3. Table 4 presents the reference values calculated for each stage of slaughtering,
microbiological group and slaughterhouse and Figure 1 presents the frequencies of chicken carcass samples that presented microbiological counts higher than these reference values. Table 5 presents the mean values of chilling tank temperatures and chlorine recorded in Sl1, Sl2, and Sl3. By comparing the three slaughterhouses, it can be observed that Sl3 presented higher counts in the initial slaughtering stages (C1, chicken after de-feathering) when compared to Sl1 and Sl2 (p<0.05, Table 3), except for Enterobacteriaceae and E. coli (similar
Table 3). The higher temperatures in the chilling tanks from Sl2 when compared to Sl1 and Sl3 can explain these results (Table 5), showing that temperature and water renewal were more important as factors of microbiological control than chlorine, which on its own showed no effect, as also observed by Allen et al. (2000), Jimenez et al. (2003), Matias et al. (2010),
and Rodrigues et al. (2008). Chilling is considered to
play a major role in microbiological contamination during chicken slaughtering, and studies assessing the use of alternative procedures and equipment, such as
spraying of cold air instead of immersion in cold water, indicate its relevance in reducing the counts in chicken carcasses (Hutchison et al., 2006; Vaidya et al., 2005;
Zweifel et al., 2015). Despite not being considered
in the present study, pre-chilling also is important to reduce microbial counts in chicken carcasses, but temperature, water inflow and chlorine concentration must be also monitored for proper effect of this procedure (Cavani et al., 2010).
Table 5 – Mean values (± standard deviation) of temperature (°C) and chlorine content (ppm) in water used for chilling of chicken carcasses during slaughtering in three chicken slaughterhouses (Sl1, Sl2, Sl3).
Parameter Sl1 Sl2 Sl3
Temperature 0.93 ± 0.67 8.00 ± 1.73 0.63 ± 0.59 Chlorine 3.09 ± 0.74 1.63 ± 2.29 0.66 ± 0.24
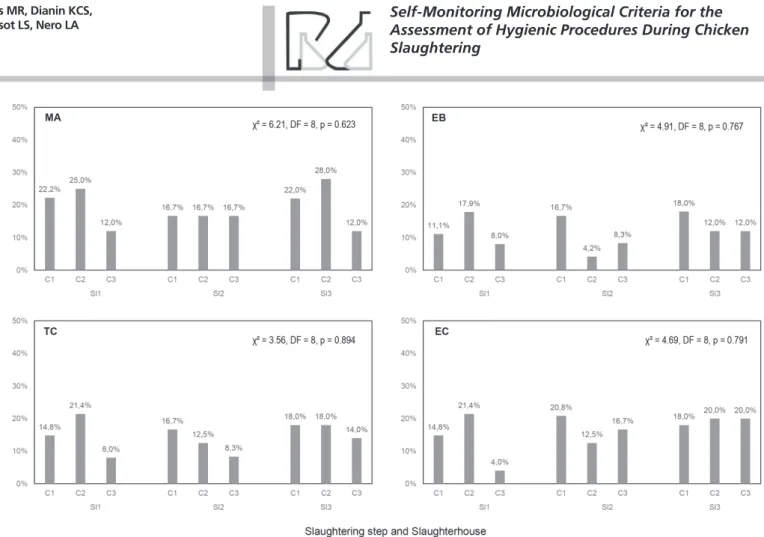
Considering the microbiological contamination of chicken carcasses in the slaughtering stages in each slaughterhouse, a clear pattern can be observed. Sl1 and Sl2 presented a significant decrease of microbiological counts only after C2 (p<0.05, Table 3), while Sl3 presented a significant decrease after C1 and C2 (p<0.05, Table 3). However, with regards to specific microbiological criteria from self-monitoring systems, a different scenario is observed in each slaughterhouse, according to each microbiological group (Figure 1). Even presenting similar counts in chicken carcasses in C1 and C2 (Table 3), Sl1 presented an increase of samples with counts higher than reference values
Table 3 – Mean counts (± standard deviation) of mesophilic aerobes (MA), Enterobacteriaceae (EB), coliforms (TC) and
Escherichia coli (EC) in different stages of chicken slaughtering process (C1: after de-feathering; C2: after evisceration; C3:
after chilling) from three chicken slaughterhouses (Sl1, Sl2, Sl3). Values in log CFU/g.
Microbial group stage Sl1 Sl2 Sl3 ANOVA
MA C1 5.60 ± 0.61aB 4.78 ± 0.32aC 6.90 ± 1.53aA F
(2,98): 31.24, p<0.001
C2 5.48 ± 0.75aAB 4.79 ± 0.34aB 5.91 ± 1.94bA F
(2,98): 4.84, p = 0.010
C3 1.19 ± 0.98bC 3.67 ± 0.32bA 2.33 ± 0.41cB F
(2,89): 100.70, p<0.001
ANOVA F(2,72): 231.15, p<0.001 F(2,66): 86.94, p<0.001 F(2,147): 138.74, p<0.001
EB C1 4.93 ± 0.53aA 4.17 ± 0.39aB 5.51 ± 1.38aA F
(2,94): 13.52, p<0.001
C2 4.90 ± 0.63aA 4.14 ± 0.45aA 4.56 ± 1.58bA F
(2,94): 2.44, p = 0.093
C3 0.50 ± 1.19bC 2.89 ± 0.71bA 1.22 ± 0.62cB F
(281): 54.08, p<0.001
ANOVA F(2,60): 169.88, p<0.001 F(2,65): 42.36, p<0.001 F(2,144): 158.81, p<0.001
TC C1 4.72 ± 0.61aB 3.95 ± 0.43aC 5.38 ± 1.28aA F
(2,95): 16.44, p<0.001
C2 4.71 ± 0.61aA 4.02 ± 0.41aB 4.55 ± 1.31bAB F
(2,95): 3.15, p = 0.047
C3 0.34 ± 1.24bB 2.54 ± 0.76bA 0.91 ± 0.62cB F
(2,80): 46.43, p<0.001
ANOVA F(2,61): 148.40, p<0.001 F(2,64): 50.35, p<0.001 F(2,145): 224.86, p<0.001
EC C1 4.53 ± 0.59aA 3.74 ± 0.48aB 5.04 ± 1.24aA F
(2,95): 14.03, p<0.001
C2 4.44 ± 0.64aA 3.71 ± 0.28aB 4.32 ± 1.17bA F
(2,92): 4.44, p = 0.014
C3 0.60 ± 1.20bB 2.33 ± 0.90bA 0.67 ± 0.53cB F
(2,76): 39.80, p<0.001
ANOVA F(2,60): 113.33, p<0.001 F(2,61): 37.04, p<0.001 F(2,142): 253.04, p<0.001
ANOVA: analysis of variance; p: level of significance (p<005). For each microbial group, values followed by different lowercase letters per row are significantly different, and values followed by different uppercase letters per line are significantly different.
Table 4 – Reference values for self-monitoring microbiolo-gical analysis of microbial contamination in chicken carcas-ses by mesophilic aerobes (MA), Enterobacteriaceae (EB), coliforms (TC) and Escherichia coli (EC) for each chicken
slaughterhouse (Sl1, Sl2, Sl3) and chicken slaughtering sta-ge. Values in CFU/g and calculated by mean values added to their respective standard deviations.
Slaughterhouse Stage Microbial group
MA EB TC EC
Sl1 C1 6.20 5.45 5.33 5.12
C2 6.23 5.54 5.32 5.08
C3 2.18 1.70 1.57 1.81
Sl2 C1 5.11 4.56 4.37 4.22
C2 5.13 4.59 4.43 3.99
C3 3.98 3.60 3.30 3.23
Sl3 C1 8.43 6.89 6.66 6.28
C2 7.86 6.14 5.86 5.49
among these slaughtering stages (Figure 1). In Sl2, an increase can be observed of samples with higher counts than reference values of Enterobacteriaceae and
E. coli among C2 and C3 (Figure 1), with significant
differences among mean counts even being recorded (Table 3). Finally, Sl3 presented an increase of sample frequencies with counts higher than reference values of mesophilic aerobes and E. coli among C1 and C2
(Figure 1), despite their mean counts being significantly different (Table 3). These results demonstrate the relevance of the intermediary stages of slaughtering as potential sources of microbiological contamination, like the automatic evisceration in large slaughterhouses in which the control can be more difficult (Goksoy et al.,
2004; Matias et al., 2010; Rodrigues et al., 2008; Vaidya et al., 2005; Zweifel et al., 2015). In addition, based
on this analysis it becomes clear that there is a need to consider additional microbiological criteria to assess the hygienic procedures in chicken slaughterhouses. Even presenting low microbiological counts in some key steps of slaughtering, the frequencies of chicken carcass samples with counts higher than reference values indicate an absence of proper control of hygienic procedures, jeopardizing the processing steps of slaughterhouses and indicating the need for corrective
measures in the process (Altekruse et al., 2009; Heggum et al., 2015; i Sala et al., 2015; Stannard, 1997).
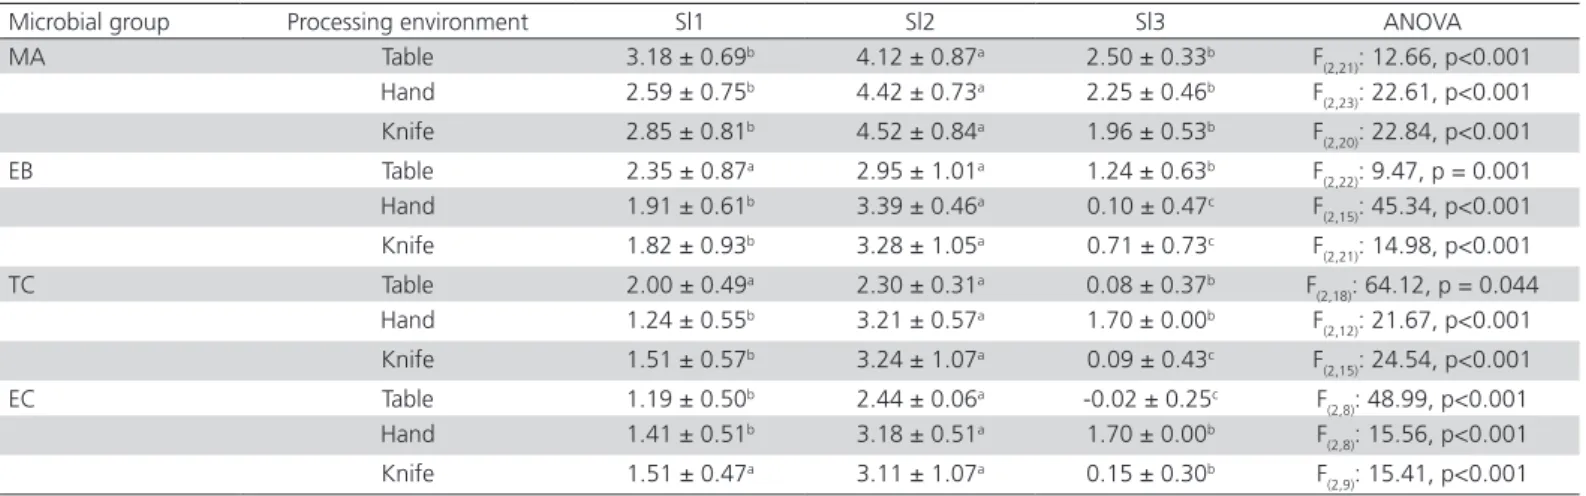
Table 6 presents the microbiological counts recorded in the samples obtained from the processing environment of Sl1, Sl2, and Sl3. In general, samples obtained in Sl2 presented higher microbiological counts when compared to samples obtained in Sl1 and Sl3, except by Enterobacteriaceae and coliforms counts in tables, which presented similar counts to those obtained in Sl1 (Table 6).Abu-Ruwaida et al.
(1994) described that equipment and utensils used for chicken slaughtering and processing are linked to microbiological contamination of chicken carcasses and end products. In addition, it is well known that contamination through food coming into contact with surfaces in the processing environment occurs due to poor hygienic conditions as a consequence of inadequate and/or inefficient cleaning and disinfection procedures (Reij & Den Aantrekker 2004).
The mean counts of microbiological groups recorded from chicken cuts obtained in Sl1, Sl2, and Sl3 are presented in Table 7. As observed for the samples obtained from the processing environment, higher microbiological counts were observed from samples obtained in Sl2 compared to Sl1 and Sl3.
Astorga et al. (2002) associated high counts in chicken
cuts to inadequate and poor hygienic procedures during chicken slaughtering and processing. The same interpretation can be considered in the present study, based on the previously described data that demonstrated poor hygienic conditions and absence of proper control in Sl2 (Tables 3 and 6, Figure 1). These results indicate that the microbiological contamination of end products is simply a reflection of the hygienic conditions during processing. Despite this, all chicken cuts and chicken carcasses obtained at the end of slaughtering (C3) presented results in accordance with current Brazilian standards, which determine a limit of 4 log CFU/g of thermotolerant coliforms in such foods, this being considered suitable for retail sale and consumption (Brasil 2001).
The obtained data indicated the relevance of microbiological groups in assessing the hygienic procedures during chicken slaughtering, and also the need to consider additional criteria for the proper control of processing. Self-monitoring microbiological criteria allowed an alternative interpretation of the adequacy of hygienic procedures and contamination control in the studied slaughterhouses. Based on such information, it was possible to identify the evisceration and chilling stages as being key steps in controlling microbiological contamination during chicken slaughtering in the studied facilities, as well as the water temperature in the chilling immersion tanks. Finally, contamination during chicken slaughtering and processing was considered relevant to the microbiological counts recorded in end products.
Table 6 – Mean counts (± standard deviation) of mesophilic aerobes (MA), Enterobacteriaceae (EB), coliforms (TC) and
Escherichia coli (EC) in different samples of processing environment from three chicken slaughterhouses (Sl1, Sl2, Sl3).
Values in log CFU/g.
Microbial group Processing environment Sl1 Sl2 Sl3 ANOVA
MA Table 3.18 ± 0.69b 4.12 ± 0.87a 2.50 ± 0.33b F
(2,21): 12.66, p<0.001
Hand 2.59 ± 0.75b 4.42 ± 0.73a 2.25 ± 0.46b F
(2,23): 22.61, p<0.001
Knife 2.85 ± 0.81b 4.52 ± 0.84a 1.96 ± 0.53b F
(2,20): 22.84, p<0.001
EB Table 2.35 ± 0.87a 2.95 ± 1.01a 1.24 ± 0.63b F
(2,22): 9.47, p = 0.001
Hand 1.91 ± 0.61b 3.39 ± 0.46a 0.10 ± 0.47c F
(2,15): 45.34, p<0.001
Knife 1.82 ± 0.93b 3.28 ± 1.05a 0.71 ± 0.73c F
(2,21): 14.98, p<0.001
TC Table 2.00 ± 0.49a 2.30 ± 0.31a 0.08 ± 0.37b F
(2,18): 64.12, p = 0.044
Hand 1.24 ± 0.55b 3.21 ± 0.57a 1.70 ± 0.00b F
(2,12): 21.67, p<0.001
Knife 1.51 ± 0.57b 3.24 ± 1.07a 0.09 ± 0.43c F
(2,15): 24.54, p<0.001
EC Table 1.19 ± 0.50b 2.44 ± 0.06a -0.02 ± 0.25c F
(2,8): 48.99, p<0.001
Hand 1.41 ± 0.51b 3.18 ± 0.51a 1.70 ± 0.00b F
(2,8): 15.56, p<0.001
Knife 1.51 ± 0.47a 3.11 ± 1.07a 0.15 ± 0.30b F
(2,9): 15.41, p<0.001
ANOVA: analysis of variance; p: level of significance (p<005). For each microbial group, values followed by different letters per line are significantly different.
Table 7 – Mean counts (± standard deviation) of mesophilic aerobes (MA), Enterobacteriaceae (EB), coliforms (TC) and
Escherichia coli (EC) in different samples of chicken cuts obtained from three chicken slaughterhouses (Sl1, Sl2, Sl3). Values
in log CFU/g.
Microbial group Cut Sl1 Sl2 Sl3 ANOVA
MA Breast 2.52 ± 0.47b 4.72 ± 0.00a 2.51 ± 0.21b F
(2,19): 17.14, p<0.001
Leg 2.60 ± 0.56b 4.97 ± 0.00a 2.26 ± 0.36b F
(2,18): 15.01, p = 0.000
Wing 2.48 ± 0.52b 5.07 ± 0.00a 2.80 ± 0.19b F
(2,17): 21.00, p<0.001
EB Breast 1.78 ± 0.49b 3.26 ± 0.83a 1.64 ± 0.47b F
(2,19): 8.77, p = 0.002
Leg 1.69 ± 0.79b 3.82 ± 0.15a 1.12 ± 0.58b F
(2,19): 13.50, p = 0.000
Wing 1.61 ± 0.68b 3.59 ± 0.56a 1.90 ± 0.37b F
(2,19): 10.81, p = 0.001
TC Breast 1.48 ± 0.53b 3.11 ± 0.81a 0.55 ± 0.36c F
(2,20): 26.64, p<0.001
Leg 1.41 ± 0.62b 3.13 ± 0.64a 0.67 ± 0.67c F
(2,19): 13.01, p = 0.000
Wing 1.41 ± 0.76b 3.15 ± 0.25a 1.03 ± 0.33b F
(2,19): 3.75, p = 0.001
EC Breast 1.086 ± 0.54b 2.76 ± 1.04a 0.23 ± 0.38c F
(2,20): 22.18, p<0.001
Leg 1.136 ± 0.44b 2.83 ± 0.73a 0.58 ± 0.56b F
(2,17): 15.77, p = 0.000
Wing 1.325 ± 0.70b 2.86 ± 0.97a 0.85 ± 0.35b F
(2,19): 10.17, p = 0.001
ACKNOWLEDGEMENTS
The authors are thankful to Conselho Nacional de Desenvolvimento Científico e Tecnológico (CNPq), Coordenação de Aperfeiçoamento de Pessoal de Nível Superior (CAPES), and Fundação de Amparo à Pesquisa do Estado de Minas Gerais (FAPEMIG).
REFERENCES
Abu-Ruwaida AS, Sawaya WN, Dashti BH, Murad M, Al-Othman HA. Microbiological quality of broilers during processing in a modern commercial slaughterhouse in Kuwait. Journal of Food Protection 1994;57(10):887-892.
Allen VM, Corry JEL, Burton CH, Whyte RT, Mead GC. Hygiene aspects of modern poultry chilling. International Journal of Food Microbiology 2000;58(1–2):39-48.
Altekruse SF, Berrang ME, Marks H, Patel B, Shaw WK, Saini P, et al. Enumeration of Escherichia coli cells on chicken carcasses as a potential measure of microbial process control in a random selection of slaughter establishments in the United States. Applied and Environmental Microbiology 2009;75(11):3522-3527.
Álvarez-Astorga M, Capita R, Alonso-Calleja C, Moreno B, Garcıa-Fernández MC. Microbiological quality of retail chicken by-products in Spain. Meat Science 2002;62(1):45-50.
Brasil. Resolução nº 12, de 2 de janeiro de 2001. Regulamento técnico sobre os padrões microbiológicos para alimentos. Brasília, DF: Anvisa; 2001. 48 p.
Brasil. Circular nº 175/2005/CGPE/DIPOA, de 16 de maio de 2005. Procedimentos de verificação dos programas de autocontrole. Brasília: MAPA; 2005.
Capita R, Alvarez-Astorga M, Alonso-Calleja C, Moreno B, Camino Garcia-Fernandez M. Occurrence of salmonellae in retail chicken carcasses and their products in Spain. International Journal of Food Microbiology 2003;81(2):169-173.
Cavani R, Schocken-Iturrino RP, Garcia TCFL, Oliveira AC. Comparison of microbial load in immersion chilling water and poultry carcasses after 8, 16 and 24 working hours. Ciência Rural 2010;40:1603-1609.
Ghafir Y, China B, Dierick K, De Zutter L, Daube G. Hygiene indicator microorganisms for selected pathogens on beef, pork, and poultry meats in Belgium. Journal of Food Protection 2008;71(1):35-45.
Goksoy EO, Kirkan S, Kok F. Microbiological quality of broiler carcasses during processing in two slaughterhouses in Turkey. Poultry Science 2004;83(8):1427-1432.
Heggum C, Vallejos JJG, Njie OB, Adegboye AO. Application of the moving window approach in the verification of the performance of food safety management systems. Food Control 2015;58:17-22.
Hutchison ML, Walters LD, Mead GC, Howell M, Allen VM. An assessment of sampling methods and microbiological hygiene indicators for process verification in poultry slaughterhouses. Journal of Food Protection 2006;69(1):145-153.
Sala RMP, Balabarca VC, Etoundi JM, Odame-Darkwah J, Oppong-Otoo J, Hinson DCT, et al. Establishment of good hygiene practice-based microbiological criteria in food industries: Guidelines using an example for meat preparations. Food Control 2015;587-11.
Jimenez SM, Tiburzi MC, Salsi MS, Pirovani ME, Moguilevsky MA. The role of visible faecal material as a vehicle for generic Escherichia coli, coliform, and other enterobacteria contaminating poultry carcasses during slaughtering. Journal of Applied Microbiology 2003;95(3):451-456.
Matias BG, Pinto PS, Cossi MV, Nero LA. Salmonella spp. and hygiene indicator microorganisms in chicken carcasses obtained at different processing stages in two slaughterhouses. Foodborne Pathogens and Disease 2010;7(3):313-318.
Milios KT, Drosinos EH, Zoiopoulos PE. Food Safety Management System validation and verification in meat industry: Carcass sampling methods for microbiological hygiene criteria – A review. Food Control 2014;43(1):74-81.
Nogrady N, Kardos G, Bistyak A, Turcsanyi I, Meszaros J, Galantai Z, et al. Prevalence and characterization of Salmonella Infantis isolates originating from different points of the broiler chicken-human food chain in Hungary. International Journal of Food Microbiology 2008;127(1-2):162-167.
Potter BD, Marcy JA, Owens CM, Slavik MF, Goodwin HL, Apple JK. Impact of performance-based sanitation systems on microbiological characteristics of poultry processing equipment and carcasses as compared with traditional sanitation systems. The Journal of Applied Poultry Research 2012;21(3):669-678.
Reij MW, Den Aantrekker ED. Recontamination as a source of pathogens in processed foods. International Journal of Food Microbiology 2004;91(1):1-11.
Rodrigues ACA, Pinto PSA, Vanetti MCD, Bevilacqua PD, Pinto MS, Nero LA. Análise e monitoramento de pontos críticos no abate de frangos utilizando indicadores microbiológicos. Ciência Rural 2008;38(7):1948-1953.
Scott VN, Powell M, Cabrera J, Carullo ME, Martinez I, Lohachoompol V. Development of microbiological criteria to assess the acceptability of a food lot – an example for milk powder. Food Control 2015;58(1):12-16.
Stannard C. Development and use of microbiological criteria for foods. Food Science and Technology Today 1997;11(3):137-177.
Tirolli ICC, Costa CA. Ocorrência de Salmonella spp. em carcaças de frangos recém abatidos em feiras e mercados da cidade de Manaus-AM. Acta Amazonica 2006;36(2):205-208.
USDA/FSIS. Isolation and identification of salmonella from meat, poultry, pasteurized egg, and catfish products and carcass and environmental sponges. Athens: Laboratory Guidebook Notice Change; 2014. 19 p.
Vaidya VM, Paturkar AM, Waskar VS, Zende RJ, Rawool DB. Detection of indicator organisms on poultry carcass sites in an organized slaughterhouse. Journal of Muscle Foods 2005;16(4):289-297.