* Corresponding author: E-mail: leonardo.aquino@ufv.br
Received: December 3, 2014 Approved:November 6, 2015
How to cite: Cunha MLP, Aquino LA, Novais RF, Clemente JM, Aquino PR, Oliveira TF. Diagnosis of the Nutritional Status of Garlic Crops. Rev Bras Cienc Solo. 2016;v40:e0140771.
Copyright: This is an open-access article distributed under the terms of the Creative Commons Attribution License, which permits unrestricted use, distribution, and reproduction in any medium, provided that the original author and source are credited.
Diagnosis of the Nutritional Status
of Garlic Crops
Mário Lúcio Pereira Cunha(1)
, Leonardo Angelo Aquino(2)*
, Roberto Ferreira Novais(2) , Junia Maria Clemente(1), Priscila Maria de Aquino(3) and Thaisa Fernanda Oliveira(1)
(1)
Universidade Federal de Viçosa, Instituto de Ciências Agrárias, Campus de Rio Paranaíba, Programa de Pós-graduação em Agronomia - Produção Vegetal, Rio Paranaíba, Minas Gerais, Brasil.
(2)
Universidade Federal de Viçosa, Instituto de Ciências Agrárias, Campus de Rio Paranaíba, Rio Paranaíba, Minas Gerais, Brasil.
(3)
Universidade Federal de Viçosa, Instituto de Ciências Agrárias, Campus de Rio Paranaíba, Curso de Agronomia, Rio Paranaíba, Minas Gerais, Brasil.
ABSTRACT: Univariate methods for diagnosing nutritional status such as the sufficiency
range and the critical level for garlic crops are very susceptible to the effects of dilution
and accumulation of nutrients. Therefore, this study aimed to establish bivariate and multivariate norms for this crop using the Diagnosis and Recommendation Integrated System (DRIS) and Nutritional Composition Diagnosis (CND), respectively. The criteria
used were nutritional status and the sufficiency range, and then the diagnoses were
compared. The study was performed in the region of Alto Paranaíba, MG, Brazil, during
the crop seasons 2012 and 2013. Samples comprised 99 commercial fields of garlic,
cultivated with the cultivar “Ito” and mostly established in Latossolo Vermelho-Amarelo
Distrófico (Oxisol). Copper and K were the nutrients with the highest number of fields
diagnosed as limiting by lack (LF) and limiting by excess (LE), respectively. The DRIS method presented greater tendency to diagnose LF, while the CND tended towards LE.
The sufficiency range of both methods presented narrow ranges in relation to those
suggested by the literature. Moreover, all ranges produced by the CND method provided narrower ranges than the DRIS method. The CND method showed better performance
than DRIS in distinguishing crop yield covered by different diagnoses. Turning to the
criterion of evaluation, the study found that nutritional status gave a better performance
than sufficiency range in terms of distinguishing diagnoses regarding yield.
Keywords: nutritional balance, diagnostic indexes, Allium sativum L.
INTRODUCTION
Leaf analysis allows us, inter alia, to monitor, evaluate and adjust agricultural fertilization programs (Menesatti et al., 2010; Tomio et al., 2015). The use of leaves to evaluate nutritional status of plants is based on the relations between the leaf content, nutrient uptake and plant yield (Fageria et al., 2009).
Because of the ease of interpretation, the sufficiency range method is the one most often
used to evaluate the values found by leaf analysis (Wadt et al., 2013). In this method, the nutritional contents are compared individually with reference values, and require very similar soil and climatic conditions among evaluated crops and places where the calibration experiments were carried out (Serra et al., 2010a).
The Diagnosis and Recommendation Integrated System (DRIS) (Beaufils, 1973) was developed to overcome several limitations inherent in the sufficiency range. This method
employs the DRIS index calculation by using the ratio between one nutrient and another. The main advantage is the greater constancy of the ratios among the nutrients in crops with the same nutritional status compared with individual contents.
Another alternative method to the sufficient range method is Compositional Nutrient Diagnosis - CND (Parent and Dafir, 1992). In this method, the nutrient balance is based
on all nutrients, rather than two, as in the DRIS method. The CND method considers all possible interactions among the nutrients and the non-mineral dry matter of the plant,
which allows more accurate diagnosis, as the concentration and dilution effects of the
nutrients in dry matter are minimized. In addition, CND has all the advantages inherent in DRIS and makes calculations easier (Wadt et al., 2013).
Currently, norms created by the sufficiency range method are in use and there is an
established critical level for the nutritional assessment of garlic crops. Besides the limitations presented by the univariate character of both methods (where the levels are
individually compared), the most recent sufficiency ranges are those proposed by Trani
and Raij (1997) and the critical levels established by Malavolta et al. (1997).
Some studies have aimed to establish norms for assessing the nutritional status of garlic plants as regards N (Backes et al., 2008). The reference values found were based not only on the nutritional content but also on the SPAD index (Soil Plant Analysis Development). However, attempts to improve the nutritional diagnosis of garlic have been limited to N.
In this context, the hypothesis was that the method multivariate (CND) may be more
effective in the bivariate (DRIS) for nutritional diagnosis of garlic crop. This study aimed to
generate norm and nutrient ranges by using modern methods for foliar diagnosis of garlic crops, to compare the methods and to determine the most limiting nutrient in terms of yield.
MATERIALS AND METHODS
The database of this study comprised the Alto Paranaíba region of Minas Gerais, Brazil, during the 2012 and 2013 cropping seasons. Data collection was carried out over two years in order to increase the database representation and perform diagnosis with a
two-season average. The regional climate is classified as Cwa, following the Köppen-Geiger
system. The altitude of the areas ranged from 900 to 1,200 m. The vast majority of
the garlic fields under study have soils classified as Latossolo Vermelho-Amarelo and a smaller number as Latossolo Vermelho and Latossolo Amarelo (Santos et al., 2013b).
The norms for the nutritional diagnosis of garlic crops were given by the Diagnosis and
The database of this study was made up of 142 commercial fields. Leaves and bulbs were sampled. All the fields evaluated were planted to the “Ito” garlic variety, belonging
to the noble group, with a late cycle and purple coloring. The cloves went through the process of vernalization before planting, with temperatures from 2 °C to 5 °C for a period of 45 to 60 days. All the areas were under center pivot irrigation, except for two
fields that were irrigated by conventional sprinkling. The mean values and the standard
deviations of the fertilizations were 222±30 kg ha-1
of N; 371±39 of P, and 417± 62 of K. For liming, it was used the saturation method bases, aiming to achieve 80 to 85 % of the expected saturation.
The index leaf was taken after the beginning of clove differentiation by sampling 15 leaves at four distinct points, resulting in 60 samples per field. The younger and completely expanded leaf of garlic was considered the index leaf at the beginning of bulbification (Trani
and Raij, 1997; Rosen et al., 2008). The bulbs were collected to determine the yield of each
planting field. Fifteen sequential plants were collected at the same four points marked per field for leaf index collection, forming a sample of 60 bulbs. The leaves were dried in an
air circulation laboratory oven at 70 °C for 72 h, followed by grinding in a Willey-type mill and sent for chemical analysis according to the method described by Santos et al. (2009).
For N determination, sulfuric digestion was carried out, followed by Kjeldahl distillation. The other nutrients were subjected to nitro-perchloric digestion and analyzed by spectrophotometry
(P and B), flame photometry (K), turbidimetry (S), and atomic absorption spectrophotometry (Ca, Mg, Cu, Fe, Mn, and Zn). To determine the yield of each field, the bulbs collected were
weighed, after natural drying for 30 days, and the value obtained was extrapolated to one hectare.
The fields were classified and grouped into high and low yield subpopulations for the application of both methods. The high yield fields were those with yield above 18,500 kg ha-1
and low yield was below this value. The limit yield (18,500 kg ha-1
) was the average yield
plus two-thirds of the standard deviation of the sampled fields, as proposed by Urano
et al. (2007) and Kurihara et al. (2013).
For the calculation of DRIS method, first the ratios were established between the content
of each nutrient and the contents of others. The mean and standard deviation of the ratios of high yield subpopulation composed the DRIS norms. Further, the dual relationships
of all fields were transformed into normal reduced variables [Z(A/N)], through the DRIS
values, which were rounded to integers by the adjustment factor “c” = 10. The arithmetical
average of the normal reduced variables, direct [Z(A/N)] and inverse [Z(N/A)] relations of each nutrient were defined as DRIS index (IA) of this element (Alvarez V and Leite, 1999):
Z(A/N) = [(A/N) - (a/n)] (c/s)
I Z A B Z A C Z A N Z B A Z C A A= + + + + + + + Z Z A ... ... 2(n-1)
where Z (A/N) = normal reduced variable for the dual relationship between the nutrient contents of the sample; A/N = dual relationship between the nutrient contents of the sample; a/n = dual relationship between the nutrient contents in the high yield subpopulation; c = adjustment factor; s = standard deviation of the dual relationship between the nutrient contents for the high yield subpopulation; and n = number of nutrients involved.
For the CND method, the nutrient contents of each field were fitted to the same unit
(dag kg-1
). Then, the content of dry matter components was calculated, except for the macro- and micronutrients (R). Then, the geometric average was calculated between the contents of dry matter (G) constituents for further correction regarding the content of each nutrient, resulting in a multinutrient variable (Vi):
G = [(x1 × x2 × … × xn) × R]1/(n+1)
where xi = contents of nutrients in the leaves; and n = number of nutrients in the
evaluation.
Average and standard deviation of the high yield subpopulation multinutrient variables composed the CND norms. From these norms, for each nutrient and each field, the multinutrient variable (IVi) index was calculated:
Ivi = (Vi-vi)/si
where IVi = multinutrient variable index; Vi = multinutrient variable of the sample;
vi = average of the multinutrient variables in the subpopulation of high yield; and
si = standard deviation of the multinutrient variables in the subpopulation of high yield.
The index normality was evaluated, for the two methods, by the Shapiro-Wilk test at 0.05 level. When the indexes did not cater for the normality criterion test, the data were transformed through a Napierian logarithm. For both methods, the sum of the DRIS index modules or multinutrient variable indices of all nutrients resulted in the Nutritional Balance Index (IEN). The ratio between the IEN and the number of nutrients involved (n) resulted in the medium Nutritional Balance Index (IENm).
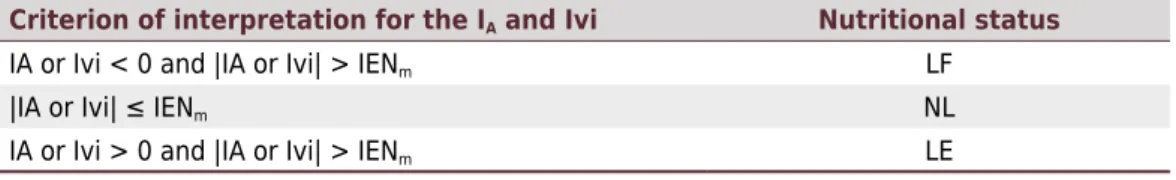
The results obtained for DRIS and CND methods were evaluated using the nutritional status criterion. To that end, the DRIS indices (IA) or multinutrient variable indices (Ivi)
of each nutrient were related to their medium nutritional balance indices (IENm), being
classified as deficient, balanced or excessive (Table 1). For each nutrient the nutritional
status diagnosis obtained by the two methods was compared.
Based on the principle of null values of DRIS indices (IA) or multinutrient variable indices
(Ivi) consistent with nutritional equilibrium conditions, the optimum contents of nutrients
were estimated through fitting linear models of correlation between the contents and
DRIS or CND indices for the high yield subpopulation. After the indices were obtained,
the sufficiency ranges were defined through the standard deviation range of -6.66 s to +6.66 s for the DRIS index and -0.66 s to +0.66 s for the multinutrient variable index (Ivi). The intervals of DRIS and CND ranges were compared with each other and with the ranges established in the literature.
Finally, the capacity of the DRIS and CND methods was evaluated through nutritional
status and sufficient range criteria to distinguish by yield the diagnostics of deficiency and toxicity regarding nutritional balance. For the sufficient range, nomenclature equivalent to that specified for the nutritional status criterion was determined. Thus, the NL fields were taken as the fields where the contents were within the established ranges and
LF or LE as those where the contents were lower or higher than the respective ranges.
After the diagnostic produced by the two methods and the criteria were obtained, garlic
fields with the same ratings were grouped to form the NL, LF and LE groups. Within each
method and criterion, the average yield of the NL group was compared with that of LF and FL groups individually through ‘t’ test at 5 %. Finally, the number of distinctions in yield and individual distinction capacity for each nutrient of all methods and criteria were compared.
Table 1. Nutritional status and fertilization response potential based on DRIS index (IA), Multinutrient
Variable Index (Ivi) and Medium Nutritional Balance Index (IENm)
Criterion of interpretation for the IA and Ivi Nutritional status IA or Ivi < 0 and |IA or Ivi| > IENm LF
|IA or Ivi| ≤ IENm NL
RESULTS AND DISCUSSION
Twenty-five fields of the 99 sampled presented yield higher than 18,500 kg ha-1
, forming the
high yield subpopulation. The remaining 74 fields were grouped into the low yield subpopulation.
The dual relationships between nutrients were transformed by the Napierian logarithm in order to capture the normality premise of the DRIS method (Alvarez V and Leite, 1999). Before data transformation, only 59.1 % of the ratios between nutrients presented normality according to the Shapiro-Wilk test, and 92.7 % after transformation, except for N/P, N/S, P/N, P/B, Ca/Cu, S/N, B/P and Cu/Ca relationships. Thus, the DRIS norms developed (mean and standard deviation) were based on the transformed relationships (Table 2).
Table 2. Average and standard deviation (s) of the dual relationships (ln-transformed) between
nutrient contents of garlic index leaf for the high yield subpopulation(1)
Variable Average s p-value(2)
Variable Average s p-value(2)
N/P 2.0611 0.2211 0.03 S/B -1.5379 0.2485 0.36 N/K 0.3081 0.1409 0.95 S/Cu -0.7293 0.6060 0.59 N/Ca 1.8375 0.1732 0.79 S/Fe -2.7874 0.4139 0.56 N/Mg 3.0222 0.1295 0.49 S/Mn -1.2885 0.5288 0.58 N/S 1.6615 0.2239 0.03 S/Zn -1.8371 0.3773 0.40 N/B 0.1236 0.1539 0.37 B/N -0.1236 0.1539 0.37 N/Cu 0.9322 0.6131 0.24 B/P 1.9375 0.2453 0.04 N/Fe -1.1259 0.2853 0.67 B/K 0.1845 0.1337 0.13 N/Mn 0.3730 0.4979 0.25 B/Ca 1.7139 0.2115 0.97 N/Zn -0.1756 0.2799 0.64 B/Mg 2.8986 0.1651 0.09 P/N -2.0611 0.2211 0.03 B/S 1.5379 0.2485 0.36 P/K -1.7530 0.2655 0.39 B/Cu 0.8086 0.6331 0.14 P/Ca -0.2236 0.1661 0.70 B/Fe -1.2495 0.3314 0.60 P/Mg 0.9612 0.1768 0.77 B/Mn 0.2494 0.4749 0.30 P/S -0.3996 0.2940 0.42 B/Zn -0.2992 0.3150 0.61 P/B -1.9375 0.2453 0.04 Cu/N -0.9322 0.6131 0.24 P/Cu -1.1289 0.6041 0.17 Cu/P 1.1289 0.6041 0.17 P/Fe -3.1870 0.3087 0.40 Cu/K -0.6241 0.6426 0.13 P/Mn -1.6881 0.4958 0.97 Cu/Ca 0.9053 0.5774 0.03 P/Zn -2.2367 0.1849 0.17 Cu/Mg 2.0901 0.6094 0.14 K/N -0.3081 0.1409 0.95 Cu/S 0.7293 0.6060 0.59 K/P 1.7530 0.2655 0.39 Cu/B -0.8086 0.6331 0.14 K/Ca 1.5294 0.2349 0.33 Cu/Fe -2.0581 0.6607 0.69 K/Mg 2.7141 0.1826 0.18 Cu/Mn -0.5592 0.5978 0.49 K/S 1.3534 0.2382 0.78 Cu/Zn -1.1078 0.6807 0.31 K/B -0.1845 0.1337 0.13 Fe/N 1.1259 0.2853 0.67 K/Cu 0.6241 0.6426 0.13 Fe/P 3.1870 0.3087 0.40 K/Fe -1.4340 0.3185 0.27 Fe/K 1.4340 0.3185 0.27 K/Mn 0.0649 0.5110 0.18 Fe/Ca 2.9634 0.2769 0.14 K/Zn -0.4837 0.3434 0.51 Fe/Mg 4.1482 0.2722 0.39 Ca/N -1.8375 0.1732 0.79 Fe/S 2.7874 0.4139 0.56 Ca/P 0.2236 0.1661 0.70 Fe/B 1.2495 0.3314 0.60 Ca/K -1.5294 0.2349 0.33 Fe/Cu 2.0581 0.6607 0.69 Ca/Mg 1.1848 0.1284 0.50 Fe/Mn 1.4989 0.5512 0.54 Ca/S -0.1760 0.2941 0.82 Fe/Zn 0.9503 0.3715 0.25 Ca/B -1.7139 0.2115 0.97 Mn/N -0.3730 0.4979 0.25 Ca/Cu -0.9053 0.5774 0.03 Mn/P 1.6881 0.4958 0.97 Ca/Fe -2.9634 0.2769 0.14 Mn/K -0.0649 0.5110 0.18 Ca/Mn -1.4645 0.4892 0.55 Mn/Ca 1.4645 0.4892 0.55 Ca/Zn -2.0131 0.2055 0.18 Mn/Mg 2.6493 0.4471 0.35
The normality deviations was reduced through transformation by the Napierian logarithm as proposed by Serra et al. (2010a). After this procedure, the authors obtained, respectively, 86.4, 94.5 and 95.5 % of bivariate relationships with normal distribution. Even considering 92.7 % of the normal relationships of this study close of previous studies, the average
between direct and inverse relationships was used in order to minimize the effects of
those that deviated from the distribution (Alvarez V and Leite, 1999).
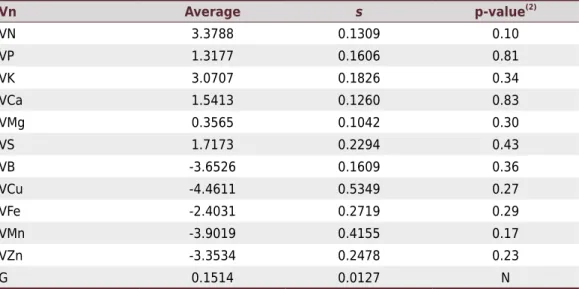
The multinutrient variables (Vn) of all nutrients showed normality according to the Shapiro-Wilk test. Thus, data transformation was not performed and the norms of the CND method (mean and standard deviation) were based on the original values (Table 3). At this point, the use of CND regarding the data found in this study could be advantageous because, unlike DRIS, none of its norms interfere with normality.
Copper was the nutrient with the highest percentage of fields diagnosed as LF, exceeding
by 50 % the DRIS method and 40 % the CND method (Table 4). Potassium was, for most
of the fields, ranked as LE, 55.4% of the total for DRIS and 58.1 % for CND.
The K excess, observed in more than half of the fields for both methods, is owed to the
high doses applied in the areas, with an average of 417 kg ha-1 of K, while the extraction was approximately 120 kg ha-1
(data not shown). Thus, the K supply was excessive and
influenced the balance of this nutrient in the soil-plant system. Whereas interactions
occur in the absorption of ions such as K+
, NH+
4, Ca2+ e Mg2+ (Marschner, 2012), imbalance
in the soil can occur because of the high doses of K employed.
The micronutrients with the highest percentage of fields diagnosed as LF were Cu> Mn> Fe. In contrast, B and Zn fitted within the micronutrients with the highest number of LE diagnostics. In part this result reflects the focus of research and fertilization with micronutrients on only B and Zn needs for garlic. In the official publications of Trani et al. (1997) for São Paulo
state, within micronutrients there are only criteria for B and Zn recommendations. Only B supply is considered in Souza et al. (1999) for Minas Gerais state.
There was large percentage of the fields diagnosed as LF for P. This result is unexpected, considering that, on average, the fields received 371 kg ha-1
of P and the average P extraction was 30 kg ha-1
. Thus, it is questionable whether P application in garlic crops is
being performed efficiently. In the cultivation areas, phosphate fertilizer was broadcast and
incorporated about 0.20 m deep. This application promotes the adsorption of phosphate ions in the soil because of the Fe/Al oxyhydroxides present, leading to non-labile P formation (Leite et al., 2006).
Mg/N -3.0222 0.1295 0.49 Mn/S 1.2885 0.5288 0.58 Mg/P -0.9612 0.1768 0.77 Mn/B -0.2494 0.4749 0.30 Mg/K -2.7141 0.1826 0.18 Mn/Cu 0.5592 0.5978 0.49 Mg/Ca -1.1848 0.1284 0.50 Mn/Fe -1.4989 0.5512 0.54 Mg/S -1.3608 0.2663 0.05 Mn/Zn -0.5486 0.5315 0.82 Mg/B -2.8986 0.1651 0.09 Zn/N 0.1756 0.2799 0.64 Mg/Cu -2.0901 0.6094 0.14 Zn/P 2.2367 0.1849 0.17 Mg/Fe -4.1482 0.2722 0.39 Zn/K 0.4837 0.3434 0.51 Mg/Mn -2.6493 0.4471 0.35 Zn/Ca 2.0131 0.2055 0.18 Mg/Zn -3.1979 0.2370 0.09 Zn/Mg 3.1979 0.2370 0.09 S/N -1.6615 0.2239 0.03 Zn/S 1.8371 0.3773 0.40 S/P 0.3996 0.2940 0.42 Zn/B 0.2992 0.3150 0.61 S/K -1.3534 0.2382 0.78 Zn/Cu 1.1078 0.6807 0.31 S/Ca 0.1760 0.2941 0.82 Zn/Fe -0.9503 0.3715 0.25 S/Mg 1.3608 0.2663 0.05 Zn/Mn 0.5486 0.5315 0.82 Continuation
(1)
Yield higher than 18,500 kg ha-1 in 25 fields. (2)
Table 3. Average and standard deviation (s) of the multinutrient variables (Vn) and geometric
average of the dry matter constituents (G) in garlic index leaf for the high yield subpopulation(1)
by CND method
Vn Average s p-value(2)
VN 3.3788 0.1309 0.10
VP 1.3177 0.1606 0.81
VK 3.0707 0.1826 0.34
VCa 1.5413 0.1260 0.83
VMg 0.3565 0.1042 0.30
VS 1.7173 0.2294 0.43
VB -3.6526 0.1609 0.36
VCu -4.4611 0.5349 0.27
VFe -2.4031 0.2719 0.29
VMn -3.9019 0.4155 0.17
VZn -3.3534 0.2478 0.23
G 0.1514 0.0127 N
(1)
Yield higher than 18,500 kg ha-1 in 25 fields. (2)
Probability of rejecting the hypothesis of normal distribution of data by Shapiro-Wilk test; CND: Compositional Nutrient Diagnosis.
Table 4. Field frequency in each class according to nutritional status in the low yield subpopulation(1), obtained by DRIS and CND methods
Nutrient Method
Nutritional status(2) Limiting by
lack Non-limiting
Limiting by excess
N DRIS 8.11 56.76 35.14
CND 6.76 43.24 50.00
P DRIS 37.84 47.30 14.86
CND 36.49 44.59 18.92
K DRIS 1.35 43.24 55.41
CND 0.00 41.89 58.11
Ca DRIS 6.76 81.08 12.16
CND 10.81 67.57 21.62
Mg DRIS 5.41 81.08 13.51
CND 4.05 56.76 39.19
S DRIS 18.92 66.22 14.86
CND 12.16 74.32 13.51
B DRIS 13.51 62.16 24.32
CND 8.11 55.41 36.49
Cu DRIS 51.35 36.49 12.16
CND 40.54 50.00 9.46
Fe DRIS 31.08 60.81 8.11
CND 21.62 70.27 8.11
Mn DRIS 47.30 39.19 13.51
CND 39.19 48.65 12.16
Zn DRIS 18.92 55.41 25.68
CND 12.16 64.86 22.97
(1)
Yield lower than 18,500 kg ha-1, in 74 fields. (2)
Localized P application provided higher accumulation of P in most of the development stages of wheat plants, compared with P broadcast and incorporated, certainly because of the lower contact of P with soil, which minimizes P non-labile formation (Barbieri et al., 2014). Similarly, for soybean crop, Arad rock phosphate and triple superphosphate
were applied together in different proportions and in localized form provided positive
linear correlation for yield; however, for the broadcast application, there was no increase in yield from 50 % of relative solubility (Oliveira Júnior et al., 2011).
From the results of both methods, it is evident that DRIS tended towards LF diagnostics (evident for Cu, Fe and Mn), while CND tended towards LE diagnostics (particularly for N, Ca, Mg and B). Such tendencies were not observed in the studies performed by Urano et al. (2006) and Serra et al. (2010b). The concordance between diagnostics observed for DRIS and CND methods varied among nutrients. The average concordance for all nutrients was 86.6 %, with a lower value for Mg (70.3 %), and a higher one for P (94.6 %). For macronutrients, the concordance were: N 81.1 %; K 90.5 %; Ca 86.5 %; and S 91.9 %; for micronutrients, B 82.4 %; Cu 86.5 %; Fe 87.8 %; Mn 90.5; and Zn 90.5 %. A similar result was observed by Serra et al. (2010a) for cotton crops, with an average of 87.4 %. For N, P, Ca, Mn, B and Cu diagnosis in rice crops, the use of only two fertilization response potential classes increased the concordance between the diagnostics to levels over 75 % on average. However, for Fe and Zn, even with the use of only two fertilization response potential classes, the concordance remained low (Tomio et al., 2015).
In bean plants, there was a good similarity in the diagnostics observed between CND and DRIS methods, with agreement of over 90 % for P, Ca, S, B, Cu, Fe and Zn. For the other nutrients, the agreement level was always over 79 % (Partelli et al., 2014).
The fit of linear models between DRIS indices or multinutrient variable indices and nutritional content was highly significant (p<0.01) for all nutrients (Table 5). The coefficients
of determination (R2
) of the linear models varied between 0.61 and 0.92 for DRIS, and 0.52 and 0.93 for CND. For both methods, lower R² corresponded to Mg and higher to Mn. It was noted that even for those nutrients where the R2
of the fitted models was low the linear fit was highly significant (p<0.01). Low R2
were also observed by Kurihara et al.
(2013). Similarly, all authors fitted highly significant models for their relationships, and were successful in determining the sufficiency ranges.
Comparing CND and DRIS methods to evaluate the nutritional status of banana from East Africa, Wairegi and Asten (2011) observed similar tendency among norms, with coefficients of determination varying from 0.96 to 0.99 for all nutritional indices. All sufficiency ranges created by the CND method provided narrower intervals than the DRIS method, despite being very close. For both, the ranges were different from those presented by Trani and Raij (1997), mainly as regards the adequate intervals (Table 5). The narrower ranges generated by the CND method can be explained by smaller concentration and dilution effects of nutrients in dry matter, caused by the multivariate functions of the calculation method (Wairegi and Asten, 2011; Wadt et al., 2013; Partelli et al., 2014).
The range similarity of the DRIS and CND methods and reduction in the amplitude of
adequate contents in relation to official norms were also observed by Camacho et al.
(2012), Kurihara et al. (2013), Santos et al. (2013a) and Partelli et al. (2014). Lower amplitude in the adequate ranges is highly desirable, because it increases distinction between balanced and unbalanced crops. For rice crops the adequate range delimited by the CND method, besides presenting lower amplitude, presented lower limit of the
sufficiency range outside the confidence interval of the mean for Ca, Mg, S, Fe, Mn, Zn and Mo, while the upper limit was inside the confidence interval of the respective leaf
Results such as those cited above served as inspiration, whereby obtaining sufficiency
ranges with small amplitude became the main objective of using DRIS and CND methods. However, it is questionable whether this is the best way to interpret nutritional content with these two methods.
The use of such methods to consider the sufficiency ranges removes the bivariate (DRIS) and multivariate (CND) character of nutrient content interpretation. The benefits such as nutrient
ranking as regards the order of nutritional limitation, the formation of a medium nutritional balance index (IBNm), the consideration of interactions between nutrients and minimization
of dilution or accumulation effects in dry matter (Baldock and Schulte, 1996) are also lost.
Table 5. Statistical model and sufficiency range obtained by DRIS and CND methods through the correlation between nutrient content
and DRIS and CND indices for the high yield subpopulation(1)
Nutrient Method Statistical model Interval R2
Sufficient range g kg-1
N
DRIS 44.53 + 0.75**IN -6.9 ≤ IN ≤ 17.1 0.61 39.5 - 49.6
CND 44.53 + 3.97**IN -1.8 ≤ IN ≤ 3.0 0.61 41.9 - 47.2
Literature(2)
- - - 35.0 - 50.0
P
DRIS 5.71 + 0.13**IP -13.5 ≤ IP ≤ 11.1 0.77 4.8 - 6.6
CND 5.71 + 0.81**IP -1.8 ≤ IP ≤ 2.0 0.78 5.2 - 6.3
Literature - - - 3.0 - 5.0
K
DRIS 33.02 + 0.76**IK -14.4 ≤ IK ≤ 9.8 0.84 27.9 - 38.1
CND 33.02 + 5.01**IK -2.3 ≤ IK ≤ 1.6 0.77 29.7 - 36.4
Literature - - - 35.0 - 50.0
Ca
DRIS 7.12 + 0.17**ICa -11.3 ≤ ICa ≤ 12.8 0.71 6.0 - 8.2
CND 7.12 + 0.87**ICa -1.8 ≤ ICa ≤ 2.1 0.65 6.5 - 7.7
Literature - - - 6.0 - 12.0
Mg
DRIS 2.17 + 0.05**IMg -9.6 ≤ IMg ≤ 9.8 0.62 1.8 - 2.5
CND 2.17 + 0.19**IMg -2.7 ≤ IMg ≤ 1.9 0.52 2.0 - 2.3
Literature - - - 2.0 - 4.0
S
DRIS 8.57 + 0.21**IS -12.4 ≤ IS ≤ 14.4 0.87 7.2 -9.9
CND 8.57 + 1.60**IS -1.5 ≤ IS ≤ 2.0 0.86 7.5 - 9.6
Literature - - -
-mg kg-1
B
DRIS 39.52 + 0.85**IB -11.1 ≤ IB ≤ 18.9 0.75 33.8 - 45.2
CND 39.52 + 5.23**IB -1.8 ≤ IB ≤ 2.9 0.73 36.0 - 43.0
Literature - - - 30.0 - 60.0
Cu
DRIS 20.71 + 1.41**ICu -13.9 ≤ ICu ≤ 21.3 0.91 11.3 - 30.1
CND 20.71 + 13.21**ICu -1.5 ≤ ICu ≤ 2.3 0.91 11.9 - 29.6
Literature - - - 5.0 - 10.0
Fe
DRIS 141.83 + 4.81**IFe -19.7 ≤ IFe ≤ 22.0 0.91 109.6 - 174.1
CND 141.83 + 39.51**IFe -2.3 ≤ IFe ≤ 2.7 0.91 115.4 - 168.3
Literature - - - 50.0 - 100.0
Mn
DRIS 33.86 + 1.80**IMn -16.5 ≤ IMn ≤ 17.7 0.92 21.8 - 45.9
CND 33.86 + 16.13**IMn -1.9 ≤ IMn ≤ 2.0 0.93 23.1 - 44.6
Literature - - - 30.0 - 100.0
Zn
DRIS 54.49 + 1.74**IZn -13.3 ≤ IZn ≤ 16.7 0.91 42.8 - 66.2
CND 54.49 + 13.91**IZn -1.7 ≤ IZn ≤ 2.1 0.89 45.2 - 63.8
Literature - - - 30.0 - 100.0
(1)
Yield higher than 18,500 kg ha-1 in 25 fields; (2)
Thus, this potential limitation motivated comparison of the diagnostics produced by DRIS and
CND methods through nutritional balance and sufficiency range criteria. To this end, it was assumed that imbalances diagnosed in relation to excess or deficiency of nutrients implied
changes in garlic yield. Therefore, the average yield of each class produced by DRIS and CND
methods was studied through the evaluation criteria of nutritional status and sufficiency range.
Consequently, the greater distinction capacity of CND and DRIS methods using the nutritional
status criterion, and not the sufficiency range, was evidenced. By nutritional status, the DRIS and CND distinguished in yield nine and ten classes, respectively, while the sufficiency ranges, this distinction has decreased to six and five classes, respectively (Table 6). This result may reflect the possible dilution and accumulation effects of nutrients that were not minimized by sufficiency ranges (Partelli et al., 2014). Possibly, the areas that produced higher or lower dry matter in the index leaf, were diagnosed mistakenly as deficient or excessive,
damaging distinctions. First, all four groups of methods and criteria presented reductions in
the average yield of the fields classified as LF for Cu (Table 6). This result, along with Cu as the element with a high number of deficient fields (Table 4), suggests the nutrient is the most limiting factor in terms of adequate nutrition of garlic in the fields diagnosed.
For N, the use of the nutritional status criterion, for both DRIS and CND methods, indicated reductions in yield caused by excess of the element (LE). None of the elaborated
sufficiency ranges distinguished classes regarding the yield for the element (Table 6).
Similar behavior was observed for Ca, where with the use of only the nutritional status criterion distinctions were observed among yield classes (Table 6).
However, the fields classified as LF had higher yield than those classified as NL. This result may be an indication of the negative effects of high lime doses employed for garlic
cultivation in the Alto Paranaíba region. The liming criterion adopted in most of the
evaluated fields aimed to increase base saturation to 80 %.
For Mg, only the CND method and the nutritional status criterion distinguished the
yield between the different classes (Table 6). This diagnostic indicated similar behavior
to that observed for Ca, whereby the LF class showed higher yield than the NL class. Again, the result may be an indication of the high lime doses employed in the region.
Both methods tended to show higher productivities in fields classified as LF for K (Table 6).
It is important to remember that both DRIS and CND diagnosed K as the element with
the most fields classified as LF (Table 4). It is evident, therefore, that K is the nutrient
applied more excessively in the garlic crop in the Alto Paranaíba region. High doses of this element can unbalance the crop nutrition and reduce yield. Finally, as occurred for Mg, the CND with the nutritional status criterion had higher distinction power, also
demonstrating reductions in the average yield of the fields classified as LE (Table 6). The P results were different from those previously found. The use of both methods using
the nutritional status criterion did not distinguish yield in any of the classes (Table 6).
However, the two sufficiency ranges demonstrated that contents below their lower limits
(4.8 for DRIS and 5.2 for CND) promoted reductions in crop yield. Thus, it can be assumed that P foliar content lower than 5.2 g kg-1
implies limitations for the yield of garlic crops. A
distinction was found among classes of nutritional limitation for Fe only through sufficiency
ranges use as criteria of nutritional evaluation by DRIS and CND (Table 6). Reductions in average yield of the LF classes were observed by both DRIS and CND methods.
All methods and criteria identified increases in yield of the LE class in relation to NL class
for S (Table 6). This result indicates the need to increase S supply to crops in the region. However, the DRIS method and the nutritional status criterion also distinguished the LF
class as more efficient than NL. In addition, it was observed that even when no statistical differences were identified by any methods and criteria, there was a general tendency of
contradiction in diagnostic methods, once for both crops with high or low accumulation of
S expressed high yield. Thus, either the group of methods and criteria were not efficient
at diagnosing plants as regards S, or the nutrient was not limiting for garlic yield.
The diagnostics obtained for Mn classes were similar to those observed for S, except for
the nutritional status criterion when there was a distinction in yield for the different classes
(Table 6). In such cases, both LF and LE groups showed productivities higher than the NL class. In the same way of S, the Mn diagnostic does not allow us to form conclusions
about the nutritional status regarding the element or the efficiency of the methods. The B diagnostic differed among all of the methods and criteria. First, the DRIS method
and nutritional status indicated a reduction in yield of the LE class. Moreover, the DRIS
application through the sufficiency ranges showed that contents lower than 33.8 mg kg-1
reduce garlic yield. It was observed that the LF class had higher yield than the NL class with the CND method when the nutritional status criterion was used. Finally, the CND
interpreted by sufficiency ranges did not distinguish any of the classes. Thus, specific
research is needed to study the results obtained by these methods and criteria, in order to indicate which one produces the most adequate diagnostic (Table 6).
Table 6. Number of fields (n) and average yield of garlic fields present in each class, according to the nutritional status (NS) and the sufficiency range criteria, and individual comparison of the average productivities of limiting classes by lack (LF) and limiting by
excess (LE) with non-limiting class (NL)
N P K Ca Mg S B Cu Fe Mn Zn
DRIS – NS
n LF 8 34 7 9 5 23 14 45 30 44 20
n NL 61 49 44 78 81 57 63 38 58 37 55
n LE 30 16 48 12 13 19 22 16 11 18 24
Prod LF (kg ha-1
) 16,525 16,127 20,007* 18,005* 16,033 17,297* 16,419 15,644* 16,541 17,008* 17,202 Prod NL (kg ha-1
) 17,108 16,856 16,634 16,585 16,695 15,914 17,015 17,398 16,542 15,880 16,408 Prod LE (kg ha-1
) 15,856* 17,328 16,240 16,320 16,850 18,240* 15,897* 17,898 17,808 17,532* 16,876 DRIS – Sufficiency ranges
n LF 14 39 9 12 6 25 18 47 33 45 25
n NL 50 46 50 76 77 60 62 41 57 41 56
n LE 35 14 40 11 16 14 19 11 9 13 18
Prod LF (kg ha-1
) 17,449 15,452* 19,485* 16,532 16,200 17,144 15,572* 15,522* 15,778* 16,889 16,413 Prod NL (kg ha-1
) 16,952 17,638 16,128 16,697 16,657 16,158 17,096 17,664 17,051 16,276 16,681 Prod LE (kg ha-1) 15,989 16,965 16,743 16,743 16,982 18,103* 16,383 17,979 17,657 17,248 17,059
CND – NS
n LF 8 34 5 16 7 16 11 36 21 36 13
n NL 48 43 45 59 58 65 57 50 67 47 64
n LE 43 22 49 24 34 18 31 13 11 16 22
Prod LF (kg ha-1
) 17,192 16,202 21,066* 18,335* 18,552* 17,309 18,212* 15,385* 16,521 17,286* 16,974 Prod NL (kg ha-1
) 17,249 16,649 16,919 16,164 16,755 16,061 16,781 17,201 16,553 15,854 16,532 Prod LE (kg ha-1
) 15,953* 17,488 16,017* 16,853 16,172 18,366* 15,957 18,276 17,773 17,754* 16,946 CND – Sufficiency Ranges
n LF 17 49 10 30 29 31 29 49 38 51 34
n NL 26 31 36 49 40 48 38 39 49 34 42
n LE 56 19 53 20 30 20 32 11 12 14 23
Prod LF (kg ha-1
) 17,177 15,754* 19,461* 16,338 16,752 16,842 16,615 15,503* 16,016* 16,768 16,429 Prod NL (kg ha-1
) 17,237 17,549 16,536 16,865 16,500 16,045 17,154 17,796 17,053 16,273 16,688 Prod LE (kg ha-1
Zinc was the one element in which all of the four methods/criteria distinguished yield as regards the nutritional status of classes (Table 6). Thus, the nutrient is not limiting of garlic yield in the Alto Paranaíba region.
Finally, the tests used to compare the methods and criteria of garlic foliar diagnosis
do not present definitive results about the adequacy of each method. This was not
necessarily because nutritional imbalances imply yield reductions. However, even with these methodological restrictions, some tendencies such as the greater distinction
capacity of the nutritional status criterion for CND methods were identified.
Thus, it is suggested that long-term research should be carried out specifically to compare the adequacy and effectiveness of these methods and criteria in order to provide more
accurate information as regards the best way to interpret leaf diagnoses.
CONCLUSIONS
Cu is the most limiting nutrient by lack, and K is the most limiting by excess in the
diagnosed fields.
The DRIS method has greater tendency for limiting diagnostic by lack, while the CND method has a greater tendency for limiting diagnostic by excess.
CND method generated more accurate diagnoses with narrower sufficient ranges than
those produced by the DRIS method.
The CND method and the nutritional status criterion presented greater capacity to distinguish classes diagnosed as regards yield.
ACKNOWLEDGMENTS
The authors thank CNPq (Conselho Nacional de Desenvolvimento Científico e
Tecnológico) and FAPEMIG (Fundação de Amparo à Pesquisa do Estado de Minas
Gerais) for their financial support. The authors also thank Capes (Coordenação de
Aperfeiçoamento de Pessoal de Nível Superior) for the Master’s scholarship awarded
to the first and sixth authors and Funarbe (Fundação Arthur Bernardes) for the
scholarship awarded to the second author.
REFERENCES
Alvarez V VH, Leite RA. Fundamentos estatísticos das fórmulas usadas para cálculo dos índices DRIS. Bol Inf Soc Bras Cienc Solo. 1999;24:20-5.
Backes C, Lima CP, Godoy LJG. Villas BRL, Imaizumi I. Coloração verde nas folhas da cultura do alho vernalizado em resposta à adubação nitrogenada. Bragantia. 2008;67:491-8. doi:10.1590/S0006-87052008000200025
Baldock JO, Schulte EE. Plant analysis with standardized scores combines DRIS and sufficiency range approaches for corn. Agron J. 1996;88:448-56. doi:10.2134/agronj1996.00021962008800030015x
Barbieri PA, Rozas HRS, Covacevich F, Echeverría HE. Phosphorus placement effects on phosphorous recovery efficiency and grain yield of wheat under no-tillage in the humid Pampas of Argentina. Int J Agron. 2014:1-12. doi:10.1155/2014/507105
Camacho MA, Silveira MV, Camargo RA, Natale W. Faixas normais de nutrientes pelos métodos ChM, DRIS e CND e nível crítico pelo método de distribuição normal reduzida para laranjeira-pera. Rev Bras Cienc Solo. 2012;46:193-200. doi:10.1590/S0100-06832012000100020
Fageria NK, Barbosa Filho MP, Moreira A, Guimarães CM. Foliar fertilization of crop plants. J Plant Nutr. 2009:32:1044-64. doi:10.1080/01904160902872826
Kurihara CH, Alvarez V VH, Neves JCL, Novais RF, Staut LA. Faixas de suficiência para teores foliares de nutrientes em algodão e em soja, definidas em função de índices DRIS. Rev Ceres. 2013;60:412-9. doi:10.1590/S0034-737X2013000300015
Leite PB, Alvarez V VH, Barros NF, Neves JCL, Guarçoni MA. Níveis críticos de fósforo, para milho, em casa de vegetação, de acordo com a sua localização no solo. Rev Bras Cienc Solo. 2006;30:497-508. doi:10.1590/S0100-06832006000300011
Malavolta E, Vitti GC, Oliveira SA. Avaliação do estado nutricional. In: Malavolta E, Vitti GC, Oliveira SA, editores. Avaliação do estado nutricional das plantas: princípios e aplicações. 2a
ed. Piracicaba: Potafos; 1997. p.115-230.
Marschner H. Mineral nutrition of higher plants. 3rd. ed. London: Academic Press; 2012.
Menesatti P, Antonucci F, Pallottino F, Roccuzzo G, Allegra M, Stagno F, Intrigliolo F. Estimation of plant nutritional status by Vis-NIR spectrophotometric analysis on orange leaves [Citrus sinensis (L) Osbeck cv Tarocco]. J Agric Eng Res. 2010;105:448-54.
doi:10.1016/j.biosystemseng.2010.01.003
Oliveira Júnior A, Prochnow LI, Klepker D. Soybean yield in response to application of phosphate rock associated with triple superphosphate. Sci Agric. 2011;68:376-85. doi:10.1590/S0103-90162011000300016
Parent LE, Dafir M. A theoretical concept of compositional nutrient diagnosis. J Am Soc Hort Sci. 1992;117:239-42.
Partelli FL, Dias JRM, Vieira HD, Wadt PGS, Paiva Júnior, E. Avaliação nutricional de feijoeiro irrigado pelos métodos CND, DRIS e faixas de suficiência. Rev Bras Cienc Solo. 2014;38:858-66. doi:10.1590/S0100-06832014000300017
Rosen C, Becker R, Fritz V, Hutchison B, Percich J, Tong C, Wright J. Growing garlic in Minnesota. Saint Paul: University of Minnesota; 2008.
Santos EF, Donha RMA, Araújo CMM, Lavres Junior J, Camacho MA. Faixas normais de nutrientes em cana-de-açúcar pelos métodos ChM, DRIS e CND e nível crítico pela distribuição normal reduzida. Rev Bras Cienc Solo. 2013a;37:1651-8. doi:10.1590/S0100-06832013000600021
Santos HG, Jacomine PKT, Anjos LHC, Oliveira VA, Lumbreras JF, Coelho MR, Almeida JA, Cunha TJF, Oliveira JB. Sistema brasileiro de classificação de solos. 3ª. ed. Brasília, DF: Embrapa; 2013b. Santos AD, Coscione AR, Vitti AC, Boaretto AE, Coelho AM, Raij Bvan, Silva CA, Abreu Júnior CH, Carmo CAFS, Silva CR, Abreu CA, Gianello C, Andrade CA, Perez DV, Casarini DCP, Silva FC, Prata F, Carvalho FC, Santos GCG, Cantarella H, Fernandes HMG, Andrade JC, Quaggio JA, Chitolina JC, Cunha LMS, Pavan MA, Rosias MFGG, Tedesco MJ, Miyazawa M, Abreu MF, Eira PA, Higa RH, Massrubá SMFS, Gomes TF, Muraoka T, Vieira W, Melo WJ, Barreto WO. Manual de análises químicas de solos, plantas e fertilizantes. 2ª. ed. Brasília, DF: Embrapa Informação Tecnológica; Rio de Janeiro: Embrapa Solos; 2009.
Serra AP, Marchetti ME, Vitorino ACT, Novelino JO, Camacho MA. Desenvolvimento de normas DRIS e CND e avaliação do estado nutricional da cultura do algodoeiro. Rev Bras Cienc Solo. 2010a;34:97-104. doi:10.1590/S0100-06832010000100010
Serra AP, Marchetti ME, Vitorino ACT, Novelino JO, Camacho MA. Determinação de faixas normais de nutrientes no algodoeiro pelos métodos ChM, CND e DRIS. Rev Bras Cienc Solo. 2010b:34:105-13. doi:10.1590/S0100-06832010000100011
Silva GGC, Neves JCL, Alvarez V VH, Leite FP. Nutritional diagnosis for eucalypt by DRIS, M-DRIS, and CND. Sci Agric. 2004;61:507-15. doi:10.1590/S0103-90162004000500008
Tomio DB, Utumi MM, Perez DV, Dias JRM, Wadt PGS. Antecipação da diagnose foliar em arroz de sequeiro. Pesq Agropec Bras. 2015;50:250-8. doi:10.1590/S0100-204X2015000300009
Trani PE, Raij Bvan. Hortaliças. In: Raij Bvan, Cantarella H, Quaggio JA, Furlani AMC, editores. Recomendação de adubação e calagem para o Estado de São Paulo. Campinas: Instituto Agronômico de Campinas; 1997. p.157-64 (Boletim técnico, 100).
Trani PE, Tavares PET, Siqueira WJ. Hortaliças - Alho. In: Raij Bvan, Cantarella H, Quaggio JA, Furlani AMC, editores. Recomendação de adubação e calagem para o Estado de São Paulo. Campinas: Instituto Agronômico de Campinas; 1997. (Boletim técnico, 100).
Urano EOM, Kurihara CH, Maeda S, Vitorino ACT, Gonçalves MC, Marchetti ME. Avaliação do estado nutricional da soja. Pesq Agropec Bras. 2006;4:1421-8. doi:10.1590/S0100-204X2006000900011
Urano EOM, Kurihara CH, Maeda S, Vitorino ACT, Goncalves MC, Marchetti ME. Determinação de teores ótimos de nutrientes em soja pelos métodos Chance Matemática, Sistema Integrado de Diagnose e Recomendação e Diagnose da Composição Nutricional. Rev Bras Cienc Solo. 2007;31:63-72. doi:10.1590/S0100-06832007000100007
Wadt PGS, Anghinoni I, Guindani ASTL, Lima AST, Puga AP, Silva GS, Prado RM. Padrões nutricionais para lavouras arrozeiras irrigadas por inundação pelos métodos da CND e Chance Matemática. Rev Bras Cienc Solo. 2013;37:145-56. doi:10.1590/S0100-06832013000100015