v.14, n.1, p.32–38, 2010
Campina Grande, PB, UAEA/UFCG – http://www.agriambi.com.br Protocolo 042.08 – 27/02/2008 • Aprovado em 25/06/2009
Adsorption and chemical extraction of phosphorus
as a function of soil incubation time
Fábio Broggi1, Alexandre C. de Oliveira2, Fernando J. Freire1, Maria B. G. dos S. Freire1 & Clístenes W. A. do Nascimento1
ABSTRACT
The objectives of this work were to evaluate the relationship between phosphate adsorption in different mineral soil constituents of the clay fraction to determine the P recovery rate by the Mehlich-1, Mehlich-3, Bray-1 and CaCl2 0.01 mol L-1 extractants as a function of incubation time of soil as well as to compare this rate with physical and chem-ical soil characteristics. In five soil samples five doses of P based on the maximum phosphate adsorption capacities (MPAC) of the soil, were applied, corresponding to 0, 0.2, 0.4, 0.8 and 1.0 level. The samples were incubated for 90, 60, 30, 15 and 0.5 days. The experiment consisted of a 5 x 4 x 5 factorial (five doses, four extractants and five different periods of incubation time) in five different soils, all distributed in blocks, with three replicates. The P content in soil was deter-mined by the Mehlich-1, Mehlich-3, Bray-1 and CaCl2 0.01 mol L-1 extractants. The soil characteristics that best correlat-ed with the recovery rate of applicorrelat-ed P were the remaining P (rem-P) and the MPAC. Soils high in gibbsite presentcorrelat-ed the highest P adsorption. Soils possessing high MPAC and the low rem-P presented higher reversibility for the non-labile P (residual P) for smaller time periods.
Key words: labile phosphorus, phosphor extractants, MPAC
Adsorção de fosfato com o tempo de incubação dos solos
por extratores químicos
RESUMO
Este trabalho teve os objetivos de avaliar a relação entre adsorção de fosfato em solos com diferentes constituintes minerais da fração argila, determinar a taxa de recuperação do P aplicado pelos extratores Mehlich-1, Mehlich-3, Bray-1 e CaCl2 0,01 mol L-1 em função do tempo de incubação das amostras e correlacionar essa taxa de recuperação com características físicas e químicas dos solos. Amostras de cinco solos receberam cinco doses de P determinadas em função de suas capacidades máximas de adsorção de fósforo (CMAP), correspondentes aos níveis: 0; 0,2; 0,4; 0,8; 1,0. As amostras foram incubadas durante 90, 60, 30, 15 e 0,5 dias. O experimento consistiu de um fatorial 5 x 4 x 5 (cinco doses, quatro extratores e cinco tempos de incubação) em cinco solos diferentes, distribuídos em blocos ao acaso, com três repetições. Determinou-se o teor de P nas amostras pelos extratores Mehlich-1, Mehlich-3, Bray-1 e CaCl2 0,01 mol L-1. As características dos solos que melhor se correlacionaram com a taxa de recuperação do P aplicado, foram o P remanescente (P-rem) e a CMAP. Solos com predominância de gibbsita na fração argila mostraram maiores adsorções de P. Os solos com maior CMAP e menor P-rem apresentaram uma reversibilidade maior do P não lábil (P residual) em um intervalo menor de tempo.
Palavras-chave: fósforo lábil, extratores de fósforo, CMAP
1Departamento de Agronomia/UFRPE, Rua Dom Manoel de Medeiros, Campus Universitário de Dois Irmãos, CEP 52171-900, Recife, PE. Fone: (81) 3320-6223, Fax (81) 3320-6220. E-mail: fabiobroggi@bol.com.br; f.freire@depa.ufrpe.br; betania@depa.ufrpe.br; clistenes@depa.ufrpe.br
INTRODUCTION
The colloidal minerals found in the clay fraction are re-sponsible for important physiochemical reactions in soil. The process of ion adsorption from the soil solution is an exam-ple of this phenomenon. In this context, phosphorous (P) has been widely studied since it is the nutrient with the highest economical impact on agricultural production owing to its low dry matter production per kg of applied nutrient ratio. This is due not only to P natural scarcity in tropical soils (Valladares et al., 2003), but also for its low availability in clay and temperate soils (Rocha et al., 2005).
The phosphorous capacity factor (PCF), also known as phosphate buffer capacity, is defined by the ratio of the amount of adsorbed P (Q) and P in solution (I), indicating the soil capacity to mantain a steady P concentration in so-lution. Both characteristics along with the clay mineralogy account for the speed at which it passes from the labile P to the non-labile P (Silva et al., 2003).
Rolim Neto et al. (2004) stated that the adsorption process takes place in accordance with the order of prevalence of the following minerals: clay 2:1 < clay 1:1 < crystalline oxides of Fe and Al < amorphous oxides of Fe and Al. The phosphate adsorption by these soils is influenced by minerals presenting superficial grouping Fe-OH and Al-OH, in which the phos-phate is absorbed by chemisorptions through covalent bound. Moreover, mineral structure and specific surface reinforce the adsorption effect (Mesquita Filho & Torrent, 1993).
Not only in the central regions of Brazil, covered by sa-vannah vegetation, but also along the coast, types of soils with high oxide content (hematite-Fe2O3, goethite- FeOOH – and gibbsite-Al (OH)3) and/or kaolin-based soils are formed. Clay 2:1 is found in soils under the less-strong im-pact of weathering, as that found in the semi-arid climate of the Northeastern Brazilian and that which usually lies with-in irrigated perimeters. In such environments, the precipita-tion contributes towards the low availability of P to plants. This occurs due to the formation Al and Fe phosphate com-pounds in acidic soils or Ca phosphate comcom-pounds either neutral or alkaline soils (Hsu, 1965).
The present work aims at evaluating the relation between phosphate adsorption in soils posing different mineral dis-tribution in the clay fraction, the recovery rate of P by the Mehlich-1, Mehlich-3, Bray-1 and CaCl2 0.01 mol L-1 extrac-tants as a function of incubation time, as well as to correlate this recovery rate with some physical and chemical charac-teristics of these soils.
MATERIAL AND METHOD
Soil samples were collected from the subsurface (Table 1) after which they were air dried, ground and sieved through a 2 mm sieve, following EMBRAPA (1997) procedures for the chemical and physical analysis. The mineralogical com-position of clay fraction was taken into account for select-ing the soils (Figure 1).
The remaining P (P-rem) was determined as proposed by
Alvares et al. (2000). In order to assess the maximum ca-pacity of phosphorus adsorption (MCPA), 2.5 cm3 soil sam-ples received 11 P doses (KH2PO4 p.a.) at intervals ranging from 0 to 110 mg L-1 for DYL
1 – Distrophic Yellow Lato-sol; 0 a 260 mg L-1, for DYL
2 – Distrophic Yellow Lato-sol, DRYL – Distrophic Red Yellow Latosol and ; NVdf – Distrpophic Red Nitosol; and finally from 0 to 80 mg L-1 for VEo – Vertisol Ebânico órtic (Alvares et al., 2000).
The P doses were applied to soil through a CaCl22H2O 0.01 mol L-1 solution stirred in a 125 mL erlenmeyer for a period of 24 h, and centrifuged for 5 min at 3000 rpm, after that were filtered and the P concentration was determined by colorimetry (Braga & Defelipo, 1974). Langmuir linear isotherms (C/q = 1/ab+1/bC) were used in order to determine the MCPA (b) in mg cm-3 and the constant (a) related to the adsorption energy (AE) in L mg-1.
Table 1. Identification, horizon, depth and the origin of the soil samples
n o it a c if it n e d
I Horizon Depth(cm) Source
D LY 1 Bw3 132-155+ Igarassú,PE D LY 2 Bw1 74-155 Tamandaré,PE
R
D YL Bw1 95-165 Jaciara,MT f
d V
N Bníitco 30-56 Cabo,PE o
E
V Cv 5-25 Cachoeirinha,PE
DYL1 – Distrophic Yellow Latosol; DYL2 -Distrophic Yellow Latosol; DRL – Distrophic Red Latosol;
NVdf – Distrophic Red Nitosol VEo – Ver tisol Ebânico órtic
Table 2. Selected physical and chemical characteristics of the soil samples
c i t s i r e t c a r a h
C Solo
D LY 1 D LY 2 D LY 2 NVdf VEo g k g a d ( d n a
S -1) 76.8 24.2 49.8 11.8 29.8 g k g a d ( tl i
S -1) 4.0 3.2 8.0 17.5 15.5 g k g a d ( y a l
C -1) 19.2 72.6 42.2 70.7 54.7 m
c g ( s
D -3)(1) 1.57 1.22 1.53 1.12 1.72 m
c g ( p
D -3)(2) 2.63 2.77 2.63 2.89 2.56 h
m c ( o
K -1)(3) 10.18 6.04 3.62 5.81 0.38 )
% ( C
F (4) 7.94 29.51 22.37 39.7 39.53 )
% ( P W
P (5) 4.67 21.95 15.97 29.6 27.48 H
H
p 2O(1:2,5) 4.5 4.7 4.8 4.4 6.8 l
C K H
p 3.9 4.5 5.9 4.1 5.2
m d g m ( 1 -h c il h e M
P -3) 0.35 0.0 0.0 2.36 495.6 m d g m ( 3 -h c il h e M
P -3) 2.63 2.1 1.7 3.5 26.0 m d g m ( 1 -y a r B
P -3) 0.73 0.15 0.12 0.4 15.4 l
C a C
P 2(mgdm-3) 0.0 0.0 0.0 0.0 0.4 l o m c ( a
N cdm-3) 0.03 0.07 0.03 0.03 1.39 l
o m c (
K cdm-3) 0.02 0.01 0.05 0.02 0.3 l o m c ( g M + a
C cdm-3) 0.3 0.2 0.15 1.2 72.7 l o m c ( l
A cdm-3) 1.0 0.15 0.0 0.45 0.0 l o m c ( l A +
H cdm-3) 3.71 3.3 1.89 5.85 1.48 )
% (
m 74.0 35.0 0.0 26.0 0.0
c i n a g r
O C(gkg-1) 0.8 0.43 0.44 0.76 5.8 L g m ( m e r
-P -1)(6) 22.53 0.49 0.097 0.37 37.32 m c g m ( P A M
C -3)(7) 0.54 2.13 2.76 2.44 0.31 L
g m ( A
E -1)-1(8) 0.92 0.71 4.75 1.11 0.35 g k g a d ( x o e
F -1)(9) 0.28 0.33 0.14 0.38 0.17 g k g a d ( d e
F -1)(10) 3.55 4.42 2.7 5.83 0.25 d e F / x o e
F 0.08 0.075 0.05 0.06 0.67
(1)Ds – soil density; (2)Dp – particle density; (3)Ko – hydraulic conductivity; (4)FC – field capacity; (5)PWP – permanent withering level (6)P-rem – remaining phosphorous; (7)CMAP – maximum capacity
of phosphate adsorption; (8)EA – energy adsorption; (9)Fe
The clay fraction of soil samples was separated in order to prepare the slides for the mineralogical analysis by means of X-ray diffraction (Jackson, 1967). The sample readings were done with a diffractometer fitted with a copper tube by using CuKa radiation at 20 mA and 40 kV.
A method proposed by Coffin (1963) and Schwertman & Taylor (1989) was employed for conducting an evaluation of the iron oxide crystalline degree found in the clay fraction. The amorphous Fe content (Feoxalato) and the crystalline Fe (Feditionito) were determined by means of atomic absorption spectrometry.
Except for the VEo (pH 7.0), the soils were incubated in a mixture of CaCO3 and MgCO3 at a molar relation of 4:1 for a period of 60 days. The amount of carbonates added was based on the potential acidity (H+A1) of each soil.
The experiment consisted of a soil sample of 2 kg collected in plastic bags to which P doses were applied in a KH2PO4, NH4H2PO4 e NaH2PO4 solution that corresponded to the 0, 0.2, 0.4, 0.8, 1.0 MCPA of each soil (Table 3).
All samples were incubated for periods of 90, 60, 30, 15 and 0.5 days. These incubation periods were initiated at dif-ferent times so that, on a single and last day, the various in-cubation times for soil were attained. Water content was kept at 80% of the field capacity all through the experiment.
At the end of the incubation, 100 g samples were removed from each plastic bag. The P recovered by the extractants Mehlich-1 (HCl 0.05 mol L-1 + H
2SO4 0.0125 mol L-1), Me-hlich-3 (NH4F 0.015 mol L-1 + CH3COOH 0.2 mol L-1 + NH4NO3 0.25 mol L-1 + HNO3 0.013 mol L-1 + EDTA
0.001 mol L-1), Bray-1 (HCl 0.025 mol L-1 + NH 4F 0.03 mol L-1) e CaCl
2 2H2O (0.01 mol L-1) were determined in each treatment at a soil extractant ratio of 1:10 (4 cm3 of air dried soil and 40 mL of the extracting solution). P evaluation in the extracted material was obtained by colormetry as recommended by Braga & Defelipo (1974).
The data obtained were submitted to analysis of variance
by the F test, and measurements were compared by Scott-Knott test (p < 0.05). Correlations were made between the recovery rate of P by the extractants with both physical and chemical characteristics, and the regression analysis between the recovered P and the recovery rate of P as applied in re-lation to the doses and incubation time of all soils and ex-tractants.
RESULTS
AND DISCUSSIONBroadly speaking, the Mehlich-1 and Bray-1 extractants exhibited greater values of P recovery from the different doses applied and incubation times (Table 4). Recovered P varied as a result of interactions between the extracting solutions at different pH levels, the dilution factor, the presence of ions and the different physical and chemical soil characteristics. It was observed, however, that in treatments where no P was applied, there were small nonsystematic variations of recovered P at different incubation times. With the second dose, a slight decrease of recovered P was observed during incubation time for all soil (Table 4).
On the VEo soil, the Mehlich-1 extractant overestimated the recovered P probably due to the solubilization of P linked to Ca (P-Ca) which suggests that both Mehlich-3 and Bray-1 extractants are more appropriate to soils found in areas of poor weathering such was the case of VEo. Silva et al. (2004) suggested that an intensification of research on methods of P extraction through Bray-1 and Mehlich-3 in soils of the semiarid Northeastern Brazil is needed.
In treatments involving longer periods of incubation (90 days), the soils presented P values recovered (out of MCPA applied) by extractants in the following order: VEo (51%), DYL1 (20%), NVdf (8%), DYL2 (6%) and DYRL (2%). The relation between P adsorption capacity and the mineralogi-cal composition of the soils is similar to the sequence pre-sented by Fox & Searle (1978) for tropical soils.
The DYRL high in gibbsite (Figure 1), presented the low-est values of recovered P, a result that disagrees with Bahia Natural
clay Mg+G
25 °C K 25 °C
K 550 °C LAd1
LAd2
LVAd
NVdf
VEo Smt
40
40 3030 2020 1010 22
°20 CU Kα
°20 CU Kα
Figure1. Diffractometry of the soil samples studied
li o
S MPAC
) 1
( Experimentalinterval PDoses
m c g
m -3 mgdm-3
D LY 1 0.5397 0-540 0;108;216;432;540 D LY 2 2.1344 0-2134 0;427;854;1707;2134 DYRL 2.7570 0-2757 0;551;1103;2206;2757
f d V
N 2.4372 0-2437 0;487;975;1950;2437 o
E
V 0.3084 0-308 0;62;123;247;308
l e v e
L Time
t n a t c a r t x E / l i o S
D LY 1 D LY2 DYRL NVdf VEo D LY 1 D LY2 DYRL NVdf VEo
y a
D mgdm-3
1 -h c il h e
M Mehilch-3
5 .
0 0.43 0.05 0.01 1.83 362.34 3.96 3.74 3.31 5.00 28.46 5
1 1.08 0.32 0.2 2.92 593.23 3.33 2.77 2.35 4.07 23.37 0 30 0.00 0.00 0.00 2.73 545.44 3.37 2.83 2.52 4.94 29.50
0
6 0.24 0.00 0.00 2.40 524.42 1.26 0.27 0.00 1.33 20.14 0
9 0.00 0.00 0.00 1.94 452.90 1.26 0.86 0.27 2.03 28.48 5
.
0 66.94 86.67 13.69 93.97 384.30 55.42 45.97 14.04 48.88 67.47 5
1 68.38 91.48 37.78 132.23 578.11 40.73 33.34 18.03 43.31 42.95 2
.
0 30 61.26 137.04 13.90 56.93 464.74 50.80 57.41 13.65 26.14 52.86 0
6 41.61 21.72 12.36 87.10 441.28 33.02 54.60 3.55 30.64 43.32 0
9 41.97 26.12 10.53 19.58 368.31 41.14 20.74 10.51 7.43 53.60 5
.
0 138.63 92.00 117.65 224.30 412.67 160.45 115.77 41.75 174.03 84.66 5
1 125.24 321.10 261.63 345.54 681.17 105.48 132.54 54.03 141.66 83.05 4
.
0 30 167.15 364.32 73.72 212.56 480.96 146.01 180.27 32.93 96.66 88.46 0
6 70.55 152.25 42.36 224.23 526.41 58.21 58.44 19.21 124.90 70.93 0
9 101.65 108.47 34.19 76.01 409.64 106.12 64.58 32.35 35.23 79.40 5
.
0 263.20 676.78 1682.66 411.56 681.09 338.01 438.33 121.28 403.64 432.63 5
1 336.07 688.66 877.53 1289.72 771.85 273.28 296.14 120.81 629.30 159.67 8
.
0 30 317.44 1328.62 1116.25 708.55 723.80 277.25 567.26 151.25 399.80 273.21 0
6 193.77 589.41 156.37 796.03 566.63 194.13 324.50 65.88 458.48 121.88 0
9 158.47 284.70 219.18 556.16 481.02 270.76 241.85 87.59 409.42 143.68 5
,
0 324.05 925.60 2478.96 896.50 717.40 383.56 621.50 100.48 714.78 446.30 5
1 520.47 1320.38 1500.68 1071.20 790.16 343.45 599.69 144.55 532.14 188.56 0
.
1 30 364.03 1412.20 579.87 936.56 598.24 331.50 648.95 109.02 551.83 180.87 0
6 323.99 676.80 412.73 851.82 591.87 305.49 343.90 76.14 529.78 116.74 0
9 244.18 497.10 548.34 748.73 488.40 396.95 393.61 130.18 528.46 163.53 1
-y a r
B CaCl20.01molL-1
5 ,
0 0.85 0.13 0.20 0.65 20.07 0.00 0.00 0.00 0.00 0.00 5
1 1.03 0.15 0.15 0.15 11.12 0.17 0.17 0.17 0.17 0.52 0 30 0.71 0.13 0.13 0.45 16.05 0.00 0.00 0.00 0.00 0.52
0
6 0.80 0.29 0.10 0.42 15.39 0.00 0.00 0.00 0.03 0.72 0
9 0.28 0.03 0.03 0.34 14.42 0.00 0.00 0.00 0.00 0.47 5
,
0 91.36 110.34 27.42 114.30 70.77 0.86 0.05 0.00 0.21 2.98 5
1 62.15 52.53 26.48 45.81 28.61 0.64 0.29 0.17 0.53 1.80 2
.
0 30 67.36 97.42 16.90 34.39 50.77 0.24 0.29 0.00 0.00 1.91 0
6 38.18 11.25 12.06 21.01 51.63 0.04 0.01 0.00 0.21 2.04 0
9 39.77 22.65 13.14 3.67 44.75 0.00 0.00 0.00 0.15 2.16 5
,
0 220.80 144.64 111.28 327.98 100.58 5.93 0.66 0.64 9.00 6.24 5
1 120.24 193.86 104.80 194.49 45.13 2.61 5.08 2.05 6.48 8.23 4
.
0 30 171.37 329.31 54.34 176.71 94.16 3.73 9.94 0.00 1.61 6.26 0
6 72.07 107.22 26.59 120.21 85.61 0.83 0.32 0.00 3.80 5.70 0
9 104.08 84.82 25.30 44.28 73.30 1.09 0.00 0.00 0.20 5.30 5
,
0 418.20 928.05 186.35 742.70 502.11 24.21 105.73 3.00 30.36 142.16 5
1 264.37 433.56 232.42 978.73 85.17 19.63 69.32 19.60 180.96 17.66 8
.
0 30 349.21 1077.84 332.40 683.00 305.92 16.73 135.95 20.54 65.65 74.06 0
6 279.18 545.66 70.37 860.80 150.40 9.89 29.76 0.49 87.50 18.47 0
9 254.75 326.34 71.77 551.01 130.02 10.02 7.01 0.00 34.47 16.31 5
,
0 556.48 1355.56 235.16 1331.32 508.67 33.67 214.78 10.01 177.49 144.86 5
1 402.87 1000.54 289.10 776.43 193.95 36.61 219.19 28.52 111.38 28.00 0
.
1 30 432.84 1158.37 195.0 915.80 168.66 25.21 153.14 6.56 69.58 23.33 0
6 395.54 589.38 121.65 913.23 146.76 23.12 44.61 1.37 105.00 23.83 0
9 375.68 501.71 133.61 802.10 162.50 20.64 19.30 1.27 69.31 25.28
Table 4. Phosphate content recovered by the Mehlich-1, Mehlich-3, Bray-1 and CaCl2 0.01 mol L-1 extractants at different levels of applied phosphate
Filho et al. (1983) who considered the goethite the main component of the clay fraction responsible for P adsorption in Central Brazil soils. It is possible that the greater adsorp-tion capacity of P at the longest time of incubaadsorp-tion for DYRL results from the presence of A1 amorphous oxides, commonly found in highly weathered oxisols .
In order to establish a relation between recovered P, the applied doses of P and the incubation time, regressions were adjusted between the P recovered by different extractants as a result of the applied doses and incubation time (Table 5). The finest adjustments (higher R2) were obtained with the Mehlich-3 extractant. However, for all extractants, a decrease of recovered P with incubation time was observed as report-ed by other researchers (Larsen, 1967; Barrow & Shaw, 1975; Gonçalves et al., 1989). In order to explain better this de-crease, a cross-section in the response surface of recovered P by Mehlich-3 extractant was made (Figure 2), which con-firmed the fact that for any type of soil, no matter how large the quantity applied at the longest incubation time, smaller P recoveries were accomplished.
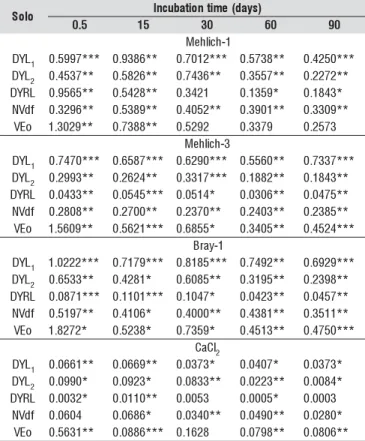
The P recovery rate (Table 6) was estimated from the ap-plied P. Regarding the incubation time and the extractants, rates varied from soil to soil, demonstrating how influential both the content and mineralogical features of the clay frac-tion can be on phosphate adsorpfrac-tion.
The soils that presented greater P adsorption capacity were the following: DYRL, DYL2 and NVdf, as demonstrated by the smallest recovery rates of applied P (Table 6), which points towards their highest capacity of P adsorption in soils with higher gibbsite, goethite and hematite content in their
clay fraction (Figure 1). The effect of aluminum oxides in the adsorption has been much less important in spite of the significant role of gibbsite in the P adsorption – though low-er than that of the goethite (McLaughlin et al., 1981). In view of its substantial presence in some clay oxisols, its con-tribution in terms of total adsorption can, however, over-pass that of iron oxides (Curi et al., 1988; Mesquita Filho & Torrent, 1993).
In DYL1 soil, in spite of the presence of goethite in the clay fraction (Figure 1) principal responsible for the adsorption phenomenon (Bahia Filho et al., 1983), the high P recovery rate of applied P did point towards the soil’s low adsorption capacity (Table 6). The low clay content (Table 2) accounts for a decrease in the adsorption capacity of DYL2 (Table 6) whose mineralogical composition is similar to that of DYL1 (Fig-ure 1), though it presented 3.8 times more clay than that.
The VEo soil presented high recovery levels of the ap-plied P (Table 6); however, it showed low adsorption capac-ity. In spite of its high clay content (Table 2), there is a min-eralogical predominance of clay minerals of 2:1 type, which is not so effective in the adsorption process but high con-tents of calcium present (Table 2) effectively contributed in precipitação which is also responsible for the non-availabil-ity of P due to the formation of low-solubilnon-availabil-ity compounds such as calcium phosphates.
Comparing the adsorption capacity of DYL1 and VEo, a similar behavior is observed between these two types of soil (Table 6) which call for the precipitation of P in alkaline soils such as the VEo – similar to the iron oxide adsorptive ca-pacity found in acid soils with less clay such as DYL1.
***, **, *, ⊗
, ns significant at 0.1, 1, 5, 10% and no-significant, respectively. ds – Dose; t – time
l i o
S Equation R2
1 -h c il h e M
D LY 1 y=24.5589+0.647657***ds-0.897826**t 0.891
L Y
D 2 y=-151.099+0.295431⊗ds+0.000148537*ds2+10.8708*t-0.110787*t2-0.00372942**dst 0.872 L
R Y
D y=18.8805+0.296793⊗ds+0.000158148*ds2-11.1213⊗t+0.154710*t2-0.00789250***dst 0.866 f
d V
N y=34.0499+0.206114⊗ds+0.0000776823⊗ds2-1.40496⊗t 0.860
o E
V y=405.997+1.03133***ds+4.15306*t-0.0454830*t2-0.0101814*dst 0.675 3
-h c il h e M L
Y
D 1 y=32.0863+0.447545***ds+0.000395392*ds2-2.21426**t+0.0207285**t2 0.970 L
Y
D 2 y=0.201767+0.253188***ds-1.31885**t 0.873
L R Y
D y=1.79607+0.0454612***ds-0.197683⊗t 0.856
f d V
N y=18.6883+0.0870387⊗ds+0.0000669847**ds2-0.787134*t 0.945
o E
V y=54.9646+0.720260***ds-1.03932*t 0.627
1 -y a r B L
Y
D 1 y=28.1499+0.592033***ds+0.000560829*ds2-1.7980*t+0.0169346*t2-0.00256305**dst 0.967 L
Y
D 2 y=36.1742+0.449862***ds-3.43197**t 0.806
L R Y
D y=26.8694+0.0779891***ds-0.987436**t 0.770
f d V
N y=-34.3084+0.423903***ds-1.94367*t 0.897
o E
V y=22.2511+1.22707***ds-2.77386⊗t+0.0352639*t2-0.0108551*dst 0.702 l
C a
C 20.01molL-1 L
Y
D 1 y=-0.961070+0.0519477***ds-0.0782721**t 0.854
L Y
D 2 y=-38.5171+0.105694***ds+0.424353⊗t-0.00114173***dst 0.822
L R Y
D y=1.26087+0.00405258**ds-0.0728363*t 0.398
f d V
N y=-6.79039+0.0480192***ds-0.287049⊗t 0.656
o E
V y=-1.02239+0.342754***ds-0.919369⊗t+0.0118740*t2-0.00377912**dst 0.621 Table 5. Phosphate content recovered from the soils (mg dm-3) by the Mehlich-1, Mehlich-3, Bray-1 e CaCl
20.01 mol L-1 extractants as a result of
Though small, P reversibility of non-labile the labile does tend to increase in each incubation period thus P is retained with less energy whenever the adsorption surface becomes saturated (Rolim Neto et al., 2004). In soils with smaller values of rem-P and higher values of MCPA (DYRL, DYL2 and NVdf), a tendency of increase in recovery rate of appled P was observed following 60 days of incubation (Table 6), which suggests that elevated doses of applied P and the fast transition from P labile to P non-labile contributed to the development of a possible residual effect of P as observed after an incubation period of 90 days. In soils with high P-rem values and smaller MCPA (DYL1 and VEo), the trans-formation of labile P to non-labile P takes longer time to develop a probable residual effect.
Contrary to the observation made by Gonçalves et al. (1989), this study demonstrated that the mathematical rela-tion between recovery rates of applied P based on the soils’ MCPA and the different incubation times did not character-ize a decrease of exponential nature.
Correlation between recovery rate of the applied P with the characteristics of the soils which reflect the status of P (Table 7) were also studied. As the clay content does not re-flect adequately the buffering capacity of the phosphate in the soil, as demonstrated by Silva et al. (2004), present study also showed that the recovery rate of applied P does not cor-relate with the clay content, indicating the importance of the mineral constituents of this fraction.
The recovery rate of applied P shows a positive and im-0
0
0
0
0 50
100
20
100
50 100
200
40
200
100 150
300
60
300
150 200
400
80
400
200 250
500
100
500
250 300
600
120
600
300
P (mg dm )-3
Precuperado
(mg
dm
)
-3
140
700 350
400 0,5
15 30
60 90
0
0
0
0
0
108
427
551
487
62
216
854
1103
975
123
432
1707
2206
1950
247
540
2134
2757
2437
308 DYL1
DYL2
DYRL
Figure 2. Phosphate content recovered in different soils as a function of
the applied dose and incubation time for the Mehlich-3 extractant
Table 6. Phosphate recovery rate in soils (mg dm-3/mg dm-3) for
Mehlich-1, Mehlich-3, Bray-1 and CaCl20.01 mol L-1 extractants at
different incubation time
o l o
S Incubaiton itme(days) 5
.
0 15 30 60 90
1 -h c il h e M L
Y
D 1 0.5997*** 0.9386** 0.7012*** 0.5738** 0.4250*** L
Y
D 2 0.4537** 0.5826** 0.7436** 0.3557** 0.2272** L
R Y
D 0.9565** 0.5428** 0.3421 0.1359* 0.1843* f
d V
N 0.3296** 0.5389** 0.4052** 0.3901** 0.3309** o
E
V 1.3029** 0.7388** 0.5292 0.3379 0.2573
3 -h c il h e M L
Y
D 1 0.7470*** 0.6587*** 0.6290*** 0.5560** 0.7337*** L
Y
D 2 0.2993** 0.2624** 0.3317*** 0.1882** 0.1843** L
R Y
D 0.0433** 0.0545*** 0.0514* 0.0306** 0.0475** f
d V
N 0.2808** 0.2700** 0.2370** 0.2403** 0.2385** o
E
V 1.5609** 0.5621*** 0.6855* 0.3405** 0.4524*** 1
-y a r B L
Y
D 1 1.0222*** 0.7179*** 0.8185*** 0.7492** 0.6929*** L
Y
D 2 0.6533** 0.4281* 0.6085** 0.3195** 0.2398** L
R Y
D 0.0871*** 0.1101*** 0.1047* 0.0423** 0.0457** f
d V
N 0.5197** 0.4106* 0.4000** 0.4381** 0.3511** o
E
V 1.8272* 0.5238* 0.7359* 0.4513** 0.4750*** l
C a
C 2
L Y
D 1 0.0661** 0.0669** 0.0373* 0.0407* 0.0373* L
Y
D 2 0.0990* 0.0923* 0.0833** 0.0223** 0.0084* L
R Y
D 0.0032* 0.0110** 0.0053 0.0005* 0.0003
f d V
N 0.0604 0.0686* 0.0340** 0.0490** 0.0280* o
E
V 0.5631** 0.0886*** 0.1628 0.0798** 0.0806**
portant correlation with rem-P, and a negative no less sig-nificant correlation with MCPA, which once again suggests that rem-P is the most appropriate analysis at routine level to assess the P interaction with clay fraction minerals of soils where these elements are adsorbed.
CONCLUSIONS
1. The characteristics that best reflected the recovery rate of the applied P were the remaining P and the maximum capacity of phosphorus adsorption
2. Soils with highest gibbsite concentration in the clay fraction presented highest P adsorption
3. Soils with high maximum capacity of phosphorus ad-sorption and low remaining P presented greater reversibility of non-labile P (P residual) in a small time of incubation.
LITERATURE CITED
Alvarez, V. V. H.; Novais, R. F.; Dias, L. E.; Oliveira, J. A. De-terminação e uso do fósforo remanescente. Boletim Informa-tivo da Sociedade Brasileira de Ciência do Solo, v.25, p.27-32, 2000.
Bahia Filho, A. F. C.; Braga, J. M.; Resende, M.; Ribeiro, A. C. Relação entre adsorção de fósforo e componentes mineralógi-cos da fração argila de Latossolos do planalto central. Revista Brasileira de Ciência do Solo, v.7, p.221-226, 1983.
Barrow, N. J.; Shaw, T. C. The slow reactions between soil and anions: II. Effect of time and temperature on the decrease in phosphate concentation in the soil solution. Soil Science, v.119, p.167-177, 1975.
Braga, J. M.; Defelipo, B. V. Determinação espectrofotométrica de fósforo em extratos de solo e material vegetal. Revista Ceres, v.21, p.73-85, 1974.
Coffin, D. E. A method of determination of free iron in soil and clays. Canadian Journal of Soil Science, v.43, p.7-17, 1963. Curi, N.; Camargo, O. A.; Guedes, A.; Silveira, J. V. Sorção de
fósforo em materiais de Latossolos do Brasil Sudeste. In: Reunião de classificação, correlação de solos e interpretação da aptidão agrícola, 3, 1988, Rio de Janeiro. Anais... Rio de Janeiro: SBCS, 1988. p.267-282.
EMBRAPA – Empresa Brasileira de Pesquisa Agropecuária. Man-ual de métodos de análise de solo. Rio de Janeiro: EMBRA-PA, 1997. 212p.
Fox, R. L.; Searle, P. G. E. Phosphate adsorption by soils of the tropics. In: Drosdoff, M. (ed.). Diversity of soils in the trop-ics. Madison: American Society of Agronomy, 1978. p.97-119.
Gonçalves, J. L. M.; Novais, R. F.; Barros, N. F.; Neves, J. C. L.; Ribeiro, A. C. Cinética de transformação de fósforo-lábil em não-lábil, em solos de cerrado. Revista Brasileira de Ciência do Solo, v.13, p.13-24, 1989.
Hsu, P. H. Fixation of phosphate by aluminum and iron in acidic soils. Soil Science, v.99, p.398-402, 1965Jackson, M. L. Soil chemical analysis-advanced course. Madison: University of Wiscosin 1967. 246p.
Kaminski, J.; Santos, D. R.; Gatiboni, L. C.; Martins, J. R.; San-tos, E. J. S.; Tissot, C. Estimativa da acidez potencial em so-los e sua implicação no cálculo da necessidade de calcário. Revista Brasileira de Ciência do Solo, v.26, p.1107-1113, 2002. Larsen, S. Soil phosphorus. Advances in Agronomy, v.19,
p.151-210, 1967.
Mclaughlin, R. R.; Ryden, J. C.; Syers, J. R. Sorption of inorganic phosphate by iron and aluminum containing components. Jour-nal Soil Science, v.32, p.365-377,1981.
Mesquita Filho, M. V.; Torrent, J. Phosphate sorption as related to mineralogy of a hydrosequence of soils from the Cerrado re-gion (Brazil). Geoderma, v.58, p.107-123, 1993.
Rocha, A. T.; Duda, G. P.; Nascimento, C. W. A.; Ribeiro, M. R. Fracionamento do fósforo e avaliação de extratores do P-disponível em solos da ilha de Fernando de Noronha. Revis-ta Brasileira de Engenharia Agrícola e AmbienRevis-tal, v.9, p.178-184, 2005.
Rolim Neto, F. C.; Schaefer, C. E. G. R.; Costa, L. M.; Cor-rêa, M. M.; Fernandes Filho, E. I.; Ibraimo, M. M. Adsorção de fósforo, superfície específica e atributos mineralógicos em solos desenvolvidos de rochas vulcânicas do Alto Paranaíba-MG. Revista Brasileira de Ciência do Solo, v.28, p.953-964, 2004.
Schwertmann, U.; Taylor, R. M. Iron oxides. In: Bigham, J. M.; Dixon, J. B.; Milford, M. H.; Roth, S. B.; Weed, S. B. (ed.). Minerals in soil environments. Madison: Soil Sience Society of America, 1989. p.379-438.
Silva, E. M. B.; Freire, F. J.; Santos, M. V. F dos; Silva, T. J. A. da; Freire, M. B. G. dos S. Níveis críticos de fósforo para Braquiaria brizantha e suas relações com características físicas e químicas em solos de Pernambuco. Revista Brasileira de Ciência do Solo, v.25, p.323-328, 2004.
Silva, M. A.; Nóbrega, J. C. A.; Curi, N.; Siqueira, J. O.; Marques, J. J. G. S. M.; Motta, P. E. F. Frações de fósforo em Latossolos. Pesquisa Agropecuária Brasileira, v.38, p.1197-1207, 2003.
Valladares, G. S.; Pereira, M. G.; Anjos, L. H. C. dos. Adsorção de fósforo em solos de argila de atividade baixa. Bragantia, v.62, p.111-118, 2003.
Table 7. Simple linear correlation coefficients between the phosphate recovery rate obtained by the Mehlich-1, Mehlich-3, Bray-1 and CaCl2 0.01 mol L-1 extractants and the soils’ physical and chemical
characteristics
s c i t s i r e t c a r a h
C Recoveryrates
y a l
C -0.34ns
m e r
P (1) 0.92*
MCPA(2) -0.98**
A
E (3) -0.75⊗
**, *, ⊗, ns: significant at 1, 5 e 10% and non significant, respectively