Accepted manuscript doi:
10.1680/jmacr.18.00209
Accepted manuscript
As a service to our authors and readers, we are putting peer-reviewed accepted manuscripts (AM) online, in the Ahead of Print section of each journal web page, shortly after acceptance.
Disclaimer
The AM is yet to be copyedited and formatted in journal house style but can still be read and referenced by quoting its unique reference number, the digital object identifier (DOI). Once the AM has been typeset, an ‘uncorrected proof’ PDF will replace the ‘accepted manuscript’ PDF. These formatted articles may still be corrected by the authors. During the Production process, errors may be discovered which could affect the content, and all legal disclaimers that apply to the journal relate to these versions also.
Version of record
The final edited article will be published in PDF and HTML and will contain all author corrections and is considered the version of record. Authors wishing to reference an article published Ahead of Print should quote its DOI. When an issue becomes available, queuing Ahead of Print articles will move to that issue’s Table of Contents. When the article is published in a journal issue, the full reference should be cited in addition to the DOI.
Accepted manuscript doi:
10.1680/jmacr.18.00209
Submitted: 09 May 2018
Published online in ‘accepted manuscript’ format: 13 December 2018
Manuscript title: Behaviour of RC Flat Slabs with Stirrups under Reversed Horizontal
Cyclic Loading
Authors: André F. O. Almeida1, Bruno Alcobia2, Miguel Ornelas2, Rui Marreiros3, and António Pinho Ramos1
Affiliations: 1CERIS, ICIST, Department of Civil Engineering, Faculdade de Ciências e Tecnologia, Universidade NOVA de Lisboa, Caparica, Portugal; 2Department of Civil Engineering, Faculdade de Ciências e Tecnologia, Universidade NOVA de Lisboa, Caparica, Portugal and 3ICIST, Department of Civil Engineering, Faculdade de Ciências e Tecnologia, Universidade NOVA de Lisboa, Caparica, Portugal
Corresponding author: André F. O. Almeida, CERIS, ICIST, Department of Civil
Engineering, Faculdade de Ciências e Tecnologia, Universidade NOVA de Lisboa, Caparica, Portugal.
Accepted manuscript doi:
10.1680/jmacr.18.00209
Abstract
This paper describes the experimental campaign to study the behaviour of reinforced concrete flat slab structures, with steel stirrups as punching shear reinforcement, under combined vertical and horizontal cyclic loading. The vertical load was first applied and kept constant during the test, while regarding the cyclic horizontal loading, imposed cyclic drifts were increased until failure. Four slab specimens with shear
reinforcement were tested and the results compared to a control slab specimen without shear reinforcement. The studied variables were different shear reinforcement ratios and the number of stirrup layers. The slabs were 4.15x1.85 m² and 0.15 m thick, connected to two steel half columns. The test setup used was developed by the research team and aimed to simulate the boundary conditions of a flat slab, representing the slab between middle spans in one direction and between zero bending moment points in the other direction. Results show that the use of steel stirrups as shear reinforcement is very effective, increasing shear, drift and energy dissipation capacities. The obtained results were also compared to the provisions given by European and American codes.
Accepted manuscript doi:
10.1680/jmacr.18.00209
1 Introduction
Flat slab structures are used widely all over the world, although experimental tests show that those structures, when lacking shear reinforcement, usually do not behave satisfactorily under cyclic horizontal loads such as the ones imposed by an earthquake, where this can result in potential major economical and human losses. Early experimental tests (Hanson and Hanson, 1968) (Hawkins, Mitchell and Sheu, 1974) (Symonds, Mitchell and Hawkins, 1976)
(Robertson and Durrani, 1991) (Robertson and Durrani, 1992) and more recent ones (Almeida et al., 2016), corroborate this. The behaviour of flat slabs under cyclic horizontal actions is worse when high vertical loads are acting simultaneously. One way to improve flat slab behaviour under cyclic horizontal loads is by using shear reinforcement. Robertson (Robertson et al., 1998) presented the results from tests on three different types of steel shear reinforcement, concluding that the achieved drift capacity was doubled compared to the specimens without shear reinforcement. Similar results were achieved by Megally (Megally and Ghali, 2000), using steel shear studs as reinforcement in two different patterns. Later, Song (Song et al., 2012) tested 3 specimens with different shear reinforcement techniques and compared their results with the ones obtained in a control specimen. Steel stirrups, shear studs and shear bands were the reinforcement methods tested by the researcher who
concluded that all methods increased the seismic performance of the slab.
In this paper, an evaluation of the response of flat slabs with closed steel stirrups as shear reinforcement is shown, once it is known that flat slabs with no shear reinforcement can lead to an undesirable response for horizontal actions. This experimental work was developed using a test setup that models the boundary conditions of the flat slab at half spans, allowing the redistribution of bending moments and the migration of the inflection point as well as controlling the vertical movement by impose equal displacements of the supported borders to simulate the behaviour of the real slab. This test setup had already been used by the research team and proved to be efficient for what it was designed, as can be seen in (Almeida et al., 2016), (Ramos et al., 2017) and (Gouveia et al., 2017). For the detailing of the shear
reinforcement, variations were made in the amount of steel reinforcement in each layer and in the number of used layers. Two different ratios of shear reinforcement were used. It is
assumed that the shear reinforcement is not required to resist the vertical loads, being added with the sole purpose of increase drift capacity and ductility. A higher ratio was also tested to prevent punching failure inside the reinforced zone. These ratios were tested in a three layer
Accepted manuscript doi:
10.1680/jmacr.18.00209
configuration as detailed in Eurocode 2 (EC2) (CEN, 2010) and in a five layer configuration to prevent failure outside the reinforced area. A reference slab without shear reinforcement is also presented and compared with the slabs with shear reinforcement.
2 Experimental program
This study aimed to test flat slabs with shear reinforcement under combined vertical and horizontal cyclic loads. Four flat slab specimens were tested using closed steel stirrups as shear reinforcement, varying the shear reinforcement ratio and the number of stirrup layers. The results of a reference specimen without shear reinforcement will also be presented.
2.1 Slab Specimens
The tested specimens were designed based on the ones used by the authors in previous works (Almeida et al., 2016), allowing a better comparison of results. A 4.15 x 1.85 x 0.15 m³ slab was designed to represent an office building interior slab-column connection, truncated at mid-span in the North-South (N-S) axis and at about quarter span in the East-West (E-W) axis. The column was built using a steel HEM120 profile, above and below up to the mid-height, where the bending moment is expected to be zero for horizontal loads. The connection between the two half columns and the slab was made using 0.25 x 0.25 x 0.05 m3 steel plates welded to the steel profiles and pre-stressed to each other and gripping the slab in the middle. The total length between bottom and top supports was 2.0 m. The upper column profile was pinned to the mechanical actuator and the lower one was pinned to the laboratory strong floor. The reinforcement details are depicted in Figure 1.
The average nominal effective depth of the bottom reinforcement was 118 mm, granted by the spacers used during cast being the highest in the N-S axis. The effective depth of the top reinforcement’s was measured and the values are depicted in Table 1. Closed steel stirrups were used to maximize the effectiveness of the shear reinforcement and two different shear reinforcement ratios were used. The smaller shear ratio was achieved by using four legged 4.5 mm steel reinforcement bar stirrups and the higher shear ratio was attained by combining two legged 6.0 mm (outer legs) and two legged 8.0 mm (inner legs) steel reinforcement bar stirrups, resulting in a 2.5 times higher shear reinforcement ratio.
Accepted manuscript doi:
10.1680/jmacr.18.00209
Both three and five layer geometries were used. The adopted geometries are detailed in Figure 2 and Table 1 shows the solution for each slab. A cross geometry distribution was used to better accommodate the rectangular shaped closed stirrups.
2.2 Test Setup
The test setup had been previously used by the research team and presented in detail in (Almeida et al., 2016). This test setup uses mechanisms to ensure equal vertical
displacements, equal rotations, equal bending moments and symmetrical shear forces at the N-S slab’s borders. This is accomplished by the use of double pinned struts to provide equal rotations (see Figure 3a) and four seesaw like elements to ensure symmetrical shear forces (see Figure 3b). A closed circuit is also used to apply the vertical load to ensure that all the vertical load is directed to the column and is kept constant throughout the test including when the specimen moves due to the cyclic horizontal loading (see Figure 3c). The complete test setup is shown in Figure 4.
2.3 Materials
The slab specimens were produced in a precast facility. Nine 300 mm long by 150 mm diameter cylinders and six 150 mm side cubes were cast along with each slab for concrete characterization purposes. Concrete mean compressive strength (fc) and mean splitting tensile
strength (fct,sp) were determined by tests on the cylinders while the cubes were used to
measure the cube compressive strength (fc,cube) as summarised in Table 2. The steel
characteristics were obtained by the standard tensile tests to measure the yield strength (fy)
and the yield strain (y), and the results are summarised in Table 3.
2.4 Instrumentation
For data acquisition, fourteen displacement transducers were placed in the N-S axis and four in the E-W axis as shown in Figure 5. Four hydraulic jacks and dedicated load cells were used, one for each spreader beam to apply the vertical load (see Figure 3c). Each beam spread the load by two load points. The jacks were driven by a hydraulic pump with load maintainer capability. The mechanical actuator used to apply the horizontal displacements had a
Accepted manuscript doi:
10.1680/jmacr.18.00209
load at the top of the column. Strain gauges were used in four top reinforcement bars, R1, R3, R5 and R6 (Figure 1), both for North and South sides in the vicinity of the column. In
specimens C-50 STR3 and C-50 STR4, two bottom reinforcement bars were also instrumented, IR1 and IR3 in the vicinity of the column and near the specimen border (corresponding to the mid-span of the slab) on the South side. Details for instrumentation positioning may be seen in Figure 1 and Figure 5.
Strain gauges were also used in the stirrups as depicted in Figure 2. In the test setup, forces in the compressed struts of the bending moment compatibilization system were measured using load cells. This information made the calculation of the bending moment values possible. In order to improve the control over the rotation and bending moment imposition system, two digital inclinometers were added to the North and South borders of the specimens. As a result, the rotations were continuously monitored, allowing their precise control throughout the test. This improvement was only implemented in the specimens, C-50 STR3 and C-50 STR4.
2.5 Test protocol
All specimens were subjected to the same test protocol. The first phase consisted of the vertical load application until the shear ratio target load for each specimen was reached. The shear ratio was considered to be the ratio between the applied vertical load and the punching capacity of the slab without shear reinforcement.
To calculate the applied shear ratio (Vexp/Vnorm), the shear capacity of the slab was computed
by extrapolating the experimentally obtained value for a similar specimen (MLS) (Almeida et
al., 2016) previously tested under monotonic centred punching in the same test setup. The
following expression was used in the extrapolation, using as a power, the value suggested by Mamede (Silva Mamede, Pinho Ramos and Faria, 2013). Although the effective depth also influences the shear capacity as all the specimens had very similar values. For simplicity, this parameter was not considered.
( )
(1) where:
Vnorm is the expected extrapolated punching load capacity for the slab to be tested; VMLS,exp is the experimental punching capacity of the MLS specimen;
fc is the concrete mean compressive strength of each slab; fc.MLS is concrete mean compressive strength of the MLS slab.
Accepted manuscript doi:
10.1680/jmacr.18.00209
The vertical load was applied at a 30 kN/min ratio and kept constant throughout the test. In the second phase, a reversed cyclic horizontal displacement was imposed at the top of the column. The displacement speed was 9 mm/min for drift steps up to 3.0% and 18 mm/min for higher drift steps. The displacement imposition protocol, as depicted in Figure 6, shows that sets of three complete cycles were made for each drift step up to 3.5%. In the subsequent drift steps, of 4.0% and 4.5%, the cycles were reduced for two and one cycle respectively. From this point until the end of the test only one cycle was applied.
2.6 Failure criterion
The adopted failure criterion consisted of a drop to 80% of the maximum horizontal load for a new peak, as depicted in Figure 7. If a specimen completes the imposed displacement protocol without verifying the failure condition, a non-failure is assumed. For post failure behaviour purposes, the tests were stopped when a horizontal load of under 30% of the maximum load was achieved.
3 Test results
All specimens presented a punching failure except the C-50 STR4, where a plastic hinge was formed, as detailed later in this paper.
All specimens presented top flexural cracking in the column region for the target vertical load and small cracks in the lower side at the North and South borders due to positive bending moment. Since all specimens were subjected to similar vertical loads, the cracking pattern was also similar.
In the second phase, cyclic horizontal loading was imposed via horizontal displacements at the top of the column, following the previously described protocol (Figure 8). The first imposed displacement was in the South (S) direction, increasing the negative bending moment in the North (N) side of the column and decreasing it in the South side. This effect was reversed when a North direction displacement was imposed.
Accepted manuscript doi:
10.1680/jmacr.18.00209
3.1 Failure modesFrom the specimen saw cuts depicted in Figure 8, different failure modes were observed. Both C-50 STR1 and C-50 STR2 (Figures 8a and 8b) failed by punching, outside the zone where the shear reinforcement was located. In Figure 8a a diagonal shear crack crossing the stirrups can also be observed. These results suggest that an interior failure was imminent, however the failure surface is clearly outside the stirrup zone. The higher cross section of the stirrups in the C-50 STR2 specimen was more efficient at controlling shear cracking,
preventing the opening of the interior shear crack. Specimen C-50 STR3 (Figure 8c) failed by punching inside the shear reinforced area as the smaller shear reinforcement ratio was unable to prevent the punching failure where some stirrups ruptured. The final test specimen, C-50 STR4 (Figure 8d), presented failure by concrete crushing in the slab-column connection. In this case, the amount of shear reinforcement combined with the higher number of layers, were able to prevent the typical punching failure.
3.2 Hysteretic behaviour
The hysteretic chart of the reference specimen without shear reinforcement, C-50, is depicted in Figure 9a. Comparing it with the charts from the shear reinforced specimens (Figure 9b to 9c), an increase in drift capacity and maximum horizontal force is observed. Comparing the C-50 STR1 and C-50 STR2 hysteretic charts in Figures 9b and 9c no significant differences were observed besides the fact that the C-50 STR2 specimen was able to fulfil a complete cycle at 3.0% drift whereas C-50 STR1 was not. This happened because both specimens failed by punching outside the shear reinforcement area, so the increase in the
reinforcement’s cross section was not completely mobilized. However, the failure mode change imposed by the shear reinforcement made it possible for these specimens to reach a drift 150% higher than the C-50 specimen. In Figure 9d an increase in the maximum
horizontal load for C-50 STR3, when compared to the previous specimens, is depicted. In this case, the shear reinforcement effect was noticeable and more cycles were achieved.
Nevertheless, the narrowness of the hysteretic charts suggests a low energy dissipation capacity by all specimens that failed due to punching. The final tested specimen, C-50 STR4, had a behaviour like that of the C-50 STR3 specimen until the 3.0% drift step was reached. From that moment on, punching failure was avoided due to the higher shear reinforcement ratio, and a progressive loss of stiffness was depicted (Figure 9e) instead of the brittle failure
Accepted manuscript doi:
10.1680/jmacr.18.00209
observed in the other tested specimens. This behaviour also led to a higher energy dissipation. These results are summarised in Table 4.
The chart from Figure 9e depicts the envelope curves from all the hysteretic charts and shows the similarity between the behaviour of all the specimens for low horizontal drift ratios. However, the use of shear reinforcement made it possible to attain higher horizontal drift ratios and horizontal forces at failure. The same tendency was observed when the number of stirrup layers was increased from 3 to 5.
3.3 Longitudinal outlines
The deformation of the slabs along the N-S axis for the vertical load and for different horizontal drifts are shown in Figure 10. Only displacements for the completion of the application of the vertical load and the first S peak for each drift step are shown. The first stage (0.0%) refers to the completion of the application of the vertical load, before the horizontal displacements were applied. The following stages refer to the first time the specimen reached the respective horizontal drift (S side) due to the application of horizontal displacements at the top of the column. From Figures 10a) and 10b) and, Figures 10c) and 10d), a similar behaviour can be observed for the vertical load imposition phase. Higher horizontal drifts result in higher vertical deformations under a constant vertical load, due to the decrease in stiffness caused by the cyclic action.
Information about the inflection points was obtained from the vertical displacement transducers in the N-S axis and showed in Figure 11. The inflexion point position at each moment was computed through the approximate equation of the deformed shape of the specimen along the N-S axis for each side of the column. For the vertical load only, inflection lines were near 0.25 of the span for C-50 STR1 and C-50 STR2, and near 0.20 for C-50 STR3 and C-50 STR4, which are close to the expected theoretical value of 0.22. These results show that the test setup is effective in representing the middle span simplification. When horizontal displacement takes place, the inflection line moves along the span. This
information corroborates the observed and described cracking pattern in the inferior side of the specimen, which for higher drifts, cracks appear closer to the column region.
As the drift increases, the amplitude of the movement of the inflexion point increases because the moment due to vertical load loses magnitude when compared to the eccentrically induced moment. For higher horizontal drift ratios, a change in the bending moment signal can be
Accepted manuscript doi:
10.1680/jmacr.18.00209
observed in the vicinity of the column. This means that the moment due to the horizontal action is bigger than the bending moment due to the vertical loading. This leads to opposite signal bending moments in opposite sides of the column.
3.4 Longitudinal reinforcement strains
At the end of the first phase (imposition of the vertical load) no reinforcement bars yielded as can be seen by comparing the points corresponding to 0.0% drift in Figure 12 with the yield strains shown in Table 3. It can also be seen that the closer to the column, the most stressed the reinforcement bars were. C-50 STR1 and C-50 STR2 present higher strains than C-50 STR3 and C-50 STR4.
The reinforcement bars closest to the column contribute the most for moment transfer from the column to the slab as they show a higher strain variation between opposite drift peaks. Reinforcement bars further from the column showed a smaller strain variation throughout the test. For imposed horizontal displacements, when strained, the reinforcement bars closer to the column’s vicinity yielded for the first 0.5% drift step.
The reinforcement bars closest to the column contribute the most for the transfer of moment from the column to the slab, as they show a higher strain variation between opposite drift peaks. Rebars further from the column showed a smaller strain variation throughout the test. For imposed horizontal displacements, when strained, the reinforcement bars closest to the vicinity of the column yielded for the first 0.5% drift step. During the horizontal drift steps of 1.5% for C-50 STR1 and C-50 STR2 and 1.0% for C-50 STR3 and C-50 STR4, the upper reinforcement bars went into a compression state. This occurred because the magnitude of the negative bending moment from the vertical loads was smaller than that from the positive moment caused by the horizontal action. These results suggest a local bending moment inversion at the vicinity of the column, corroborated by the stresses measured in the lower reinforcement bars, depicted in Figure 13. The lowest reinforcement bars in the vicinity of the column yielded at the 2.5% drift step as shown in Figure 13. These results show that at least for specimens C-50 STR3 and C-50 STR4 both upper and lower reinforcements yield in the region of the column. At the southern border, stresses slightly increased in the bending moment throughout the test, although, without the reinforcement bar yielding. The strain gauges from BIR1 in Specimen C-50 STR3 failed at the beginning of the test.
Accepted manuscript doi:
10.1680/jmacr.18.00209
As the test progressed, bending cracks in the bottom side of the specimen became more pronounced and new cracks formed in the sections closer to the column. For drift steps of about 2.0%, superior and inferior cracks were formed in the same section, at the quarter-span region for negative and positive bending moments respectively.
3.5 Shear reinforcement strains
Figures 14 to 17 show the strains evolution in some of the shear stirrups throughout the test. Figure 14 shows that the middle reinforcement layer (strain gauges S2 and S5) from
specimen C-50 STR1 reached higher strains and all instrumented stirrups in this layer had yielded by the 2.5% drift step. This observation agrees with the formation of a diagonal shear crack crossing the stirrups that can be observed in Figure 8a. For Specimen C-50 STR2, and due to the higher cross section area of the stirrups, the strains, presented in Figure 15, were smaller than for specimen C-50 STR1 and no stirrup yielding was spotted. The middle layer, again, showed higher strains, suggesting that a crack was formed in the middle of the stirrups but it was not able to open, pushing the critical crack beyond the last layer of reinforcement. The C-50 STR3 specimen failed by punching inside the stirrups zone (Figure 8c), since the shear reinforcement’s cross section area was low, and it was not enough to prevent the punching failure near the column. The strains from Figure 16 hint that two shear cracks occurred, as suggested by the high strains in the first and third shear reinforcement layers counting from the column. The high strains in the middle layer suggest that have not the two last shear reinforcement layers been present, the failure mode could be similar to the previous two specimens. The strain gauges from the stirrups closer to the column detached from the stirrup for drift steps over 2.5%. However, the post cutting inspection revealed that several stirrups had ruptured.
The last specimen to be tested, C-50 STR4, withstood the punching failure, due to its higher shear reinforcement cross section area (Figure 8d). The shear reinforcement strains from Figure 17 and post failure inspection of the specimen suggest not a punching failure but a failure with a formation of a flexural plastic hinge restricted to the column’s vicinity. In Figure 17 it can be seen that the strain gauge S10 reached the yield strain in the last measured cycle, which corresponds to the diagonal crack that can be observed on the left side of the column in Figure 8d. Almost all the strain gauges in the stirrups stopped reading in the final cycles, due to heavy damage within the slab. It can also be concluded that the existing shear
Accepted manuscript doi:
10.1680/jmacr.18.00209
cracks did not evolve to a complete punching failure, as occurred in the case of specimen C-50 STR3. The shear reinforcement was enough to withstand the vertical load and the imposed displacements, however, due to the large number of cycles, the concrete around the column degraded, resulting in a plastic hinge mechanism. This led to a reduction in stiffness once the specimen could no longer endure the horizontal loading. At this time, the vertical load was supported by the longitudinal reinforcement by dowel action. This conclusion is supported by Figure 8d, where a physical separation is depicted between the concrete in the column and the rest of the specimen’s concrete.
3.6 Equivalent viscous damping
The equivalent viscous damping coefficient was calculated to evaluate the performance level of each specimen, according to Hose and Seible (Hose and Seible, 2000). This parameter relates the dissipated cycle energy to the energy required to linearly reach the peak of each cycle. Different behaviours correspond to different equivalent viscous damping values. Expression 2 was used to calculate the equivalent viscous damping coefficient (eq). Figure
18 shows schematically each parameter
(
) (2)
where
Ed1 is the energy dissipated for positive displacement cycles Ed2 is the energy dissipated for negative displacement cycles ES1 is the elastic strain energy for positive displacement cycles ES2 is the elastic strain energy for negative displacement cycles
The viscous damping coefficient chart in Figure 19 along with the narrowness of the hysteretic cycles from Figure 9 demonstrates that all specimens, depict a similar energy dissipation capacity per cycle, regardless of the amount of shear reinforcement. However, because shear reinforcement enhances drift capacity, the total amount of dissipated energy increases. All specimens dissipate the highest amount of energy in the first cycle for each drift step due to the increased induced damage level, which drops for the following two cycles. The non-brittle failure of the C-50 STR4 specimen allowed it to dissipate more energy in the last drift steps (3.5% and 4.0%) before it reached the adopted failure criterion.
Accepted manuscript doi:
10.1680/jmacr.18.00209
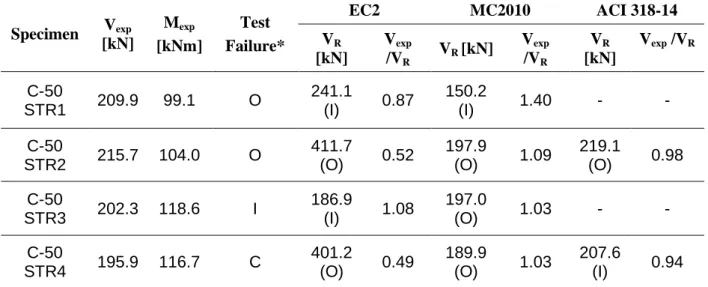
4 Comparison of experimental tests results with design codes
The experimental results were compared to the provisioned failure loads from EC2 (CEN, 2010), ACI-318 (ACI Committee 318, 2014) and MC2010 (Fib, 2011) (Level of
Approximation III). Those provisions were computed using average values of the materials and neglecting the safety coefficients. As this connection must resist the pair of shear force and unbalanced moment, it is possible to achieve failure for more than one combination of forces and moments. Therefore, the option was to define the unbalanced moment as equal to the maximum experimental value obtained and use the codes to estimate the maximum shear force. Table 5 summarizes the computed code provisions, showing the predicted shear capacity for each specimen. These codes consider three failure modes: punching inside the shear reinforced perimeter; punching outside the shear reinforced area and crushing of the concrete compressed strut. All these failure modes were taken into account and the
conditioning provisions were depicted in Table 5. EC2 predicted the correct failure modes for C-50 STR2 and C-50 STR3 specimens and, regarding the shear capacity, the estimations were not good for the specimens with higher shear reinforcement ratio per layer (C-50 STR2 and C-50 STR4). MC2010 predicted the correct failure mode for C-50 STR3 specimen only, but presented good estimations for the shear capacity, except for the estimation for specimen C-50 STR1. For the ACI 318-14 provisions, there are two missing values because the used shear reinforcement’s cross section is small and, the 50% limitation to the concrete
contribution applied by the code in the presence of shear reinforcement, led to a punching capacity with reinforcement smaller than when the reinforcement was not taken into account. The predictions are conditioned by several factors. All codes need the input of a moment value to compute the predicted shear capacity. As stated before, the maximum moment value was used, although, after reaching the maximum value, the moment reduces before failure is reached. It is also important to note that these experimental tests were conducted with the imposition of a cyclic displacement and it is known that this type of action is more severe than a monotonic displacement (Almeida et al., 2016), which is not distinguished by the codes. Also, in the case of an earthquake the most important response parameter is the drift capacity which is not yet possible to predict from the codes.
Accepted manuscript doi:
10.1680/jmacr.18.00209
5 Summary and conclusions
This experimental work aimed to assess the influence of steel stirrups as shear reinforcement in the response of flat slabs subject to seismic activity. The main variables changed were the shear reinforcement ratio and the number of shear reinforcement layers. The following conclusions were drawn.
Regarding the test setup, the imposed boundary conditions were able to match the vertical displacement of the border, resulting in symmetric shear forces when the horizontal displacements were imposed. The control over the rotation of the borders, allowed the mobility of the inflection line.
All reinforced specimens presented a better overall behaviour when compared to the control specimen, C-50. Stirrups provided higher drift capacity (from 150% up to 300% increase), higher maximum horizontal loads, higher ductility and by
consequence higher energy dissipation capacity (Table 4).
For both specimens with only three shear reinforcement layers (C-50 STR1 and C-50 STR2), the punching failure surface was outside the shear reinforcement perimeter. Although the C-50 STR1 specimen punched outside the shear reinforcement perimeter, a failure inside the shear reinforced perimeter was eminent. This is corroborated by the fact that the behaviours of C-50 STR1, C-50 STR2 and C-50 STR3 were very similar. This suggests that the smaller shear reinforcement ratio used in this work is, for a three layer configuration, near the minimum to have a failure outside the shear reinforcement.
None of the specimens with five layers of stirrups had a failure outside the
reinforcement perimeter, meaning that the five layer configuration was sufficient to prevent punching outside the reinforcement perimeter.
C-50 STR4’s failure was due to the formation of a plastic hinge in the column’s vicinity. In this case, the shear reinforcement prevented punching failure. This
specimen, having five layers and a higher shear reinforcement ratio, performed better, reaching higher drifts and dissipating more energy.
The strains in the shear reinforcement, as well as the rupture of some stirrups in the C50-STR3 specimen, show that closed stirrups were efficient.
Accepted manuscript doi:
10.1680/jmacr.18.00209
6 Acknowledgements
This work received the support from the Fundação para a Ciência e a Tecnologia - Ministério da Ciência, Tecnologia e Ensino Superior through scholarship number
SFRH/BD/119772/2016.
Notation:
CFRP carbon fibre reinforced polymers d average effective depth
dmax maximum horizontal drift
Ed1 energy dissipated for positive displacement cycles
Ed2 energy dissipated for negative displacement cycles
Es steel modulus of elasticity
ES1 elastic strain energy for positive displacement cycles
ES2 elastic strain energy for negative displacement cycles
fc mean value of cylinder compressive concrete strength
fc,cube mean value of cube compressive concrete strength
fc,MLS mean value of cylinder compressive concrete strength of the MLS slab
fct,sp mean value of concrete splitting tensile strength
fy yield stress of steel reinforcement
Lmax maximum horizontal load
RC reinforced concrete Vexp applied vertical load
VMLS,exp experimental punching capacity of the MLS specimen
Vnorm extrapolated expected punching load capacity
VR code provisioned punching resistance εy yield strain of steel reinforcement longitudinal reinforcement ratio
Accepted manuscript doi:
10.1680/jmacr.18.00209
7 References
ACI Committee 318 (2014) Building Code Requirements for Structural Concrete (ACI
318M-14), Aci 318M-14. doi: 10.1016/0262-5075(85)90032-6.
Almeida, A. et al. (2016) ‘Punching behaviour of RC flat slabs under reversed horizontal cyclic loading’, Engineering Structures, 117. doi: 10.1016/j.engstruct.2016.03.007. CEN (2010) Eurocode 2: Design of concrete structures - EN 1992-1-1, Np En 1992-1-1. Fib (2011) Model Code 2010. doi: 10.1002/9783433604090.
Gouveia, N. D., Faria, D. M. V and Ramos, A. P. (2017) ‘Assessment of SFRC flat slab punching behaviour – part II: reversed horizontal cyclic loading’, Magazine of
Concrete Research, 0(0), pp. 1–17. doi: 10.1680/jmacr.17.00344.
Hanson, N. W. and Hanson, J. M. (1968) ‘Shear and Moment Transfer Between Concrete Slabs and Columns’, Journal of the Portland Cement Association, 10(1), pp. 2–16. Hawkins, N. M., Mitchell, D. and Sheu, M. S. (1974) Seismic Resistance of Concrete Slab to
Column and Wall Connections. Washington.
Hose, Y. D. and Seible, F. (2000) Performance Evaluation Database for Concrete Bridge
Components Concrete Bridge Components and Systems under Simulated Seismic Loads, EERI Earthquake Spectra. San Diego.
Marreiros, R. (2014) Precast Concrete Wall-Foundation Connection - Development of a
seismic dissipative connection. Universidade Nova de Lisboa.
Megally, S. and Ghali, A. (2000) ‘Seismic behavior of edge column-slab connections with stud shear reinforcement’, ACI Structural Journal, 97(1), pp. 53–60.
Ramos, A. et al. (2017) ‘Punching of flat slabs under reversed horizontal cyclic loading’, ACI
Special Publication, 315, pp. 253–272.
Rizk, E. and Marzouk, H. (2013) ‘Minimum shear reinforcement for thick plates and two-way slabs’, Engineering Structures. Elsevier Ltd, 46, pp. 1–13. doi:
10.1016/j.engstruct.2012.07.006.
Robertson, I. N. et al. (1998) ‘Seismic performance of flat-slab shear reinforcement’, in
12WCEE2000, pp. 1–11.
Robertson, I. N. and Durrani, A. (1991) ‘Gravity Load Effect on Seismic Behavior of Exterior Slab-Column Connections’, ACI Structural Journal, 88, pp. 255–267.
Accepted manuscript doi:
10.1680/jmacr.18.00209
Slab-Column Connections’, ACI Structural Journal, 89, pp. 37–45.
Ruiz, M. F. and Muttoni, A. (2009) ‘Applications of critical shear crack theory to punching of reinforced concrete slabs with transverse reinforcement’, ACI Structural Journal, 106(4), pp. 485–494. doi: 10.14359/56614.
Silva Mamede, N. F., Pinho Ramos, A. and Faria, D. M. V (2013) ‘Experimental and parametric 3D nonlinear finite element analysis on punching of flat slabs with orthogonal reinforcement’, Engineering Structures, 48, pp. 442–457. doi: 10.1016/j.engstruct.2012.09.035.
Song, J. K. et al. (2012) ‘Effective punching shear and moment capacity of flat plate-column connection with shear reinforcements for lateral loading’, International Journal of
Concrete Structures and Materials, 6(1), pp. 19–29. doi: 10.1007/s40069-012-0002-3.
Symonds, D. W., Mitchell, D. and Hawkins, N. M. (1976) Slab-Column Connections
Subjected to High Intensity Shear and Transferring Reversed Moments. Washington.
TABLE CAPTIONS
Table 1 –Characteristics of each slab specimen and test Table 2 – Concrete characteristics for each slab
Table 3 – Steel bar characterization
Table 4 – Failure details of the specimens with horizontal loading Table 5 – Code provision details
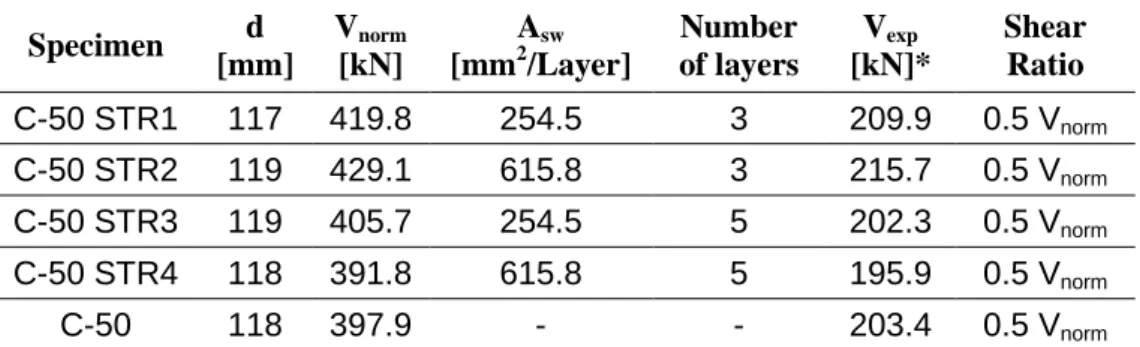
Table 1 –Characteristics of each slab specimen and test
Specimen d [mm] Vnorm [kN] Asw [mm2/Layer] Number of layers Vexp [kN]* Shear Ratio C-50 STR1 117 419.8 254.5 3 209.9 0.5 Vnorm C-50 STR2 119 429.1 615.8 3 215.7 0.5 Vnorm C-50 STR3 119 405.7 254.5 5 202.3 0.5 Vnorm C-50 STR4 118 391.8 615.8 5 195.9 0.5 Vnorm C-50 118 397.9 - - 203.4 0.5 Vnorm
Accepted manuscript doi:
10.1680/jmacr.18.00209
Table 2 – Concrete characteristics for each slab
Specimen fc [MPa] fc,cube [MPa] fct,sp [MPa]
C-50 STR1 53.1 55.2 3.7
C-50 STR2 52.5 56.2 3.6
C-50 STR3 49.2 47.1 4.2
C-50 STR4 44.4 43.7 3.6
C-50 52.4 48.6 2.9
Table 3 – Steel bar characterization
Bar diameter [mm] fy [MPa] y [%]
10 523.9 0.26
12 544.9 0.27
4.5 543.3 0.27
6 538.0 0.27
8 533.5 0.27
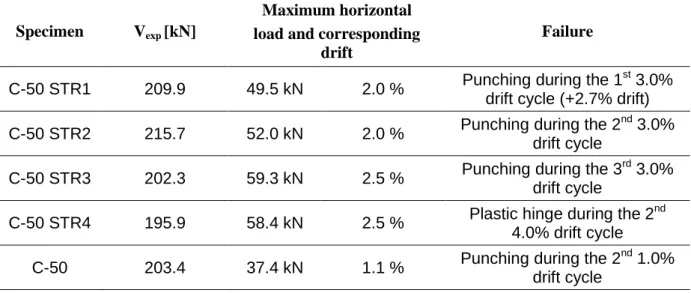
Table 4 – Failure details of the specimens with horizontal loading
Specimen Vexp [kN]
Maximum horizontal load and corresponding
drift
Failure
C-50 STR1 209.9 49.5 kN 2.0 % Punching during the 1
st
3.0% drift cycle (+2.7% drift)
C-50 STR2 215.7 52.0 kN 2.0 % Punching during the 2
nd 3.0%
drift cycle
C-50 STR3 202.3 59.3 kN 2.5 % Punching during the 3
rd 3.0%
drift cycle
C-50 STR4 195.9 58.4 kN 2.5 % Plastic hinge during the 2
nd
4.0% drift cycle
C-50 203.4 37.4 kN 1.1 % Punching during the 2
nd 1.0%
Accepted manuscript doi:
10.1680/jmacr.18.00209
Table 5 – Code provision details
Specimen Vexp [kN] Mexp [kNm] Test Failure* EC2 MC2010 ACI 318-14 VR [kN] Vexp /VR VR [kN] Vexp /VR VR [kN] Vexp /VR C-50 STR1 209.9 99.1 O 241.1 (I) 0.87 150.2 (I) 1.40 - - C-50 STR2 215.7 104.0 O 411.7 (O) 0.52 197.9 (O) 1.09 219.1 (O) 0.98 C-50 STR3 202.3 118.6 I 186.9 (I) 1.08 197.0 (O) 1.03 - - C-50 STR4 195.9 116.7 C 401.2 (O) 0.49 189.9 (O) 1.03 207.6 (I) 0.94
Accepted manuscript doi:
10.1680/jmacr.18.00209
FIGURE CAPTIONS
Figure 1 – Reinforcement details and strain gauge positioning (dimensions in millimetres). Figure 2 – Shear reinforcement detail for three and five layer solutions.
Figure 3 – Test setup; a) double pinned strut; b) seesaw elements; c) vertical load application setup.
Figure 4 – Complete test setup.
Figure 5 – Vertical displacement transducer and load points positioning. Figure 6 – Cyclic displacement protocol.
Figure 7 – Failure criterion.
Figure 8 – Saw cuts from the western cress section of all specimens: a) C-50 STR1; b) C-50 STR2; c) C-50 STR3; d) C-50 STR4.
Figure 9 – Hysteretic responses. a) Specimen 50; b) Specimen 50 STR1; c) Specimen C-50 STR2; d) Specimen C-C-50 STR3; e) Specimen C-C-50 STR4; f) Envelope curves for all specimens.
Figure 10 – Longitudinal outlines. a) C-50 STR1; b) C-50 STR2; c) C-50 STR3; d) C-50 STR4.
Figure 11 – Inflection point in the N-S centreline. a) C-50 STR1; b) C-50 STR2; c) C-50 STR3; d) C-50 STR4.
Figure 12 – Strains in top longitudinal rebars for different drift steps. a) C-50 STR1; b) C-50 STR2; c) C-50 STR3; d) C-50 STR4.
Figure 13 – Bottom longitudinal rebar strains for different drift steps. a) C-50 STR3; b) C-50 STR4.
Figure 14 – Shear reinforcement stirrups strains for different drift steps for specimen C-50 STR1.
Figure 15 – Shear reinforcement stirrups strains for different drift steps for specimen C-50 STR2.
Figure 16 – Shear reinforcement stirrups strains for different drift steps for specimen C-50 STR3.
Figure 17 – Shear reinforcement stirrups strains for different drift steps for specimen C-50 STR4.
Figure 18 – Equivalent viscous damping for asymmetric hysteresis loops (Marreiros, 2014) Figure 19 – Equivalent viscous damping.