R E S E A R C H
Open Access
Psychometric characteristics of the
Functional Assessment of Cancer
Therapy-General when applied to Brazilian cancer
patients: a cross-cultural adaptation and
validation
Juliana Alvares Duarte Bonini Campos
1*, Maria Cláudia Bernardes Spexoto
1, Sergio Vicente Serrano
2and João Maroco
3Abstract
Background: The psychometric properties of an instrument should be evaluated routinely when using different samples. This study evaluated the psychometric properties of the Functional Assessment of Cancer Therapy-General (FACT-G) when applied to a sample of Brazilian cancer patients.
Methods: The face, content, and construct (factorial, convergent, and discriminant) validities of the FACT-G were estimated. Confirmatory factor analysis (CFA) was conducted the ratio chi-square by degrees of freedom (χ2/df), the comparative fit index (CFI), the Tucker-Lewis index (TLI), and the root mean square error of approximation (RMSEA) as indices. The invariance of the best model was assessed with multi-group analysis using the difference of chi-squares method (Δχ2). Convergent validity was assessed using Average Variance Extracted (AVE) and discriminant validity was determined via correlational analysis. Internal consistency was assessed using the Cronbach’s alpha (α) coefficient, and the Composite Reliability (CR) was estimated.
Results: A total of 975 cancer patients participated in the study, with a mean age of 53.3 (SD = 13.0) years. Of these participants, 61.5 % were women. In CFA, five correlations between errors were included to fit the FACT-G to the sample (χ2/df = 8.611, CFI = .913, TLI = .902, RMSEA = .088). The model did not indicate invariant independent samples (Δχ2:μ: p < .001, i: p < .958, Cov: p < .001, Res: p < .001). While there was adequate convergent validity for the physical well-being (AVE = .54) and social and family Well-being factors (AVE = .55), there was low convergent validity for the other factors. Reliability was adequate (CR = .76–.89 and α = .71–.82). Functional well-being, emotional well-being, and physical well-being were the factors that demonstrated a strong contribution to patients’ health-related quality of life (β = −.99, .88, and .64, respectively).
Conclusion: The FACT-G was found to be a valid and reliable assessment of health-related quality of life in a Brazilian sample of patients with cancer.
Keywords: Cancer, Validity, Reliability, Brazil, Health-related quality of life
* Correspondence:[email protected]
1Departamento de Alimentos e Nutrição. Faculdade de Ciências
Farmacêuticas de Araraquara, UNESP-Univ Estadual Paulista, Rod. Araraquara-Jaú, km 01, Araraquara, São Paulo, Brazil
Full list of author information is available at the end of the article
© 2016 Campos et al. Open Access This article is distributed under the terms of the Creative Commons Attribution 4.0 International License (http://creativecommons.org/licenses/by/4.0/), which permits unrestricted use, distribution, and reproduction in any medium, provided you give appropriate credit to the original author(s) and the source, provide a link to the Creative Commons license, and indicate if changes were made. The Creative Commons Public Domain Dedication waiver (http://creativecommons.org/publicdomain/zero/1.0/) applies to the data made available in this article, unless otherwise stated.
Background
Health-related quality of life (HRQOL) is a concept that has assumed an important role in clinical practice [1–7] and research aimed at cancer patients [3, 8, 9]. The disorganization of the HRQOL of patients with cancer can have a significant negative impact on treatment re-sponse, symptoms associated with the disease/treatment, disease prognosis, and the development of unpleasant concomitant clinical conditions. The improvement of procedures and diagnostic techniques as well as the var-iety of available treatment modalities have led to in-creased life expectancy in cancer patients, leading to greater concern about their long-term well-being [10]. Thus, when choosing between available therapies, the oncologist’s decision-making is driven not only by the ef-fectiveness of the treatment, but also by its impact on HRQOL [11].
However, since HRQOL is a latent variable, (i.e., not dir-ectly measurable), many instruments have been developed to evaluate it in the general population (e.g., World Health Organization Quality Of Life Assessment [WHOQOL-100] [12–16], Medical Outcomes Study SF - 36-Short Form Health Survey [17, 18], and the Sickness Impact Profile [19]).
Given the increase in generic measures for assessing HRQOL, there is a need for instruments that are specific to individuals’ clinical conditions and that consider asso-ciated disabilities, limitations, and symptoms specific to each condition. Among the instruments proposed in the literature to assess HRQOL in cancer patients, the two most frequently used instruments used worldwide are the Cella et al.’s Functional Assessment of Cancer Therapy-General (FACT-G) [10] and the European Organization for Research and Treatment of Cancer-Quality of Life Questionnaire Core 30 (EORTC QLQ-C30) [20].
Initially published in 1993 in the United States, the FACT-G, first has been translated into more than 30 languages [21]. To determine its suitability for use in dif-ferent countries and samples, a number of validation studies have been conducted [10, 22, 23].
Despite the existence and widespread application of a Portuguese version of the FACT-G, only one study [24] has evaluated the psychometric properties of this instru-ment. However, this study was limited to evaluation of the FACT-G psychometric properties in a sample of in-dividuals with cervical cancer.
Moreover, it is important to note that despite the fact that existing literature [10, 25] indicates that the FACT-G is appropriate for use in oncology, easy to use, con-cise, and responsive to clinical changes, its psychometric properties should be routinely evaluated when applied to different samples. Specifically, this should occur because of knowledge that these properties are unrelated to the
instrument itself, but rather to the sample, and is thereby directly influenced by the sample’s character-istics [26].
Thus, we performed this study to evaluate the psycho-metric properties of the FACT-G when applied to a large sample of Brazilian cancer patients.
Methods
Study design and sampling
The present study employed a cross-sectional design. A total of 1099 cancer patients from the outpatient clinic and in the hospitalization sector of the Barretos Cancer Hospital were invited to participate in this study during 2013.
The estimated minimum sample size was based on Hair et al.’s [27] recommendation of 5–10 subjects (k) for each model parameter. Since the tested model has 58 parameters (FACT-G: 27 items, 27 errors, and 4 factors), we estimated that 290–580 subjects would be required. As the study also evaluated the invariance of the instru-ment for independent samples, it was necessary to use a second sample of the same size. Thus, the minimum sample size needed to conduct the required analysis was between 580 and 1160 participants. However, since an-other objective was to explore the psychometric proper-ties of the FACT-G for the population of cancer patients in Brazil, the sample had to be large enough to conveni-ently capture the population’s variability. Consequconveni-ently, we chose to analyze data from a representative sample of 1020 participants.
The exclusion criteria for participants were as follows: had undergone a surgical procedure, had been diagnosed with cognitive impairment, were undergoing palliative care, had been diagnosed with a severe psychiatric dis-order, and under 18 years of age. We included all adult patients who agreed to participate, regardless of cancer diagnosis, treatment type and clinical stage, as well as having no previously reported exclusion characteristics.
Study variables and measures
To characterize the sample, we collected socio-demographic and clinical information (Table 1). It is important to clarify that the socio-economic class and household head education level were classified ac-cording to the Associação Brasileira de Empresas de Pesquisa (ABEP) [28], and that clinical information about the disease was obtained by consulting the pa-tient’s chart.
The height (cm) and weight (kg) reported by patients were recorded for the calculation of body mass index (kg/m2) (BMI) and the subsequent classification of their nutritional status. For BMI classification, we used the adult cutoff points (>20 years) proposed by the World Health Organization [29].
The average age of the 1020 participants was 53.3 (SD = 13.0) years, and all had an established cancer diagnosis.
It is important to highlight that not all patients an-swered all questions on the socio-demographic inven-tory, and that some patients’ charts did not contain some clinical information. Additionally, it should be clarified that the lowest response rate was for informa-tion about clinical stage (88.0 %), which was related to the clinical difficulty of establishing such precise stage-related information rather than a lack of information in the medical record. However, since response rates for socio-demographic variables (98.5–100.0 %) and clinics
(98.6–100 %) were high (with the exception of clinical stage), this does not represent a study limitation.
HRQOL was estimated using the FACT-G [10]. The FACT-G was first published in 1993 in the United States and was developed based on structured interviews with oncology experts and cancer patients. The use of instru-ment was proposed following five years of developinstru-ment and psychometric assessments [10]. Factor analysis of the instrument, originally developed to consist of 28 items, revealed the following five factors [10].
In 1999, Webster et al. [21] conducted a study in mixed sample of cancer patients (n = 99), and proposed the removal of one factor (“Relationship with the
Table 1 Socio-demographic and clinical characterization of participantsa
Socio-demographic characteristics n % Clinical characteristic n %
Gender Specialty
Male 375 38.5 Head and neck 73 7.5
Female 600 61.5 Higher digestive tract 94 9.6
Religion Lower digestive tract 200 20.5
No 40 4.2 Gynecology 107 11.0
Yes 922 95.8 Hematology 4 .4
Religious Practice Breast Cancer 297 30.5
No 139 14.5 Brain tumor 14 1.4
Yes 822 85.5 Orthopedic 24 2.5
Marital status Skin 41 4.2
Single 139 14.3 Thorax 48 4.9
Married 631 64.8 Urology 73 7.5
Widowed 99 10.2 Clinical stage
Separated/Divorced 104 10.7 I 72 8.4
Working II 215 25.1
No 716 73.6 III 333 38.8
Yes 257 26.4 IV 237 27.7
Economic class Treatment type
A 24 2.4 Chemotherapy 616 63.4
B 334 34.3 Radiotherapy 163 16.8
C 462 47.4 Chemotherapy and radiotherapy 148 15.2
D and E 155 15.9 Hormone therapy 26 2.7
Data collection place Immunotherapy 18 1.9
Outpatient 29 3.0 Metastasis
Hospitalization units 940 97.0 No 599 61.8
Yes 370 38.2
Body Mass Index (kg/m2)
<18.5 (Low weight) 57 5.9
18.5├25.0 (Eutrophic) 407 42.3
25.0├30.0 (Pre obesity) 310 32.2
≥30.0 (Obesity) 188 19.5
a
doctor”) and its associated items. This decision was made after evaluation of cultural adaptations of the in-strument, patient feedback, and statistical analysis using item response theory (IRT). However, one additional item was added (“I am concerned that my condition will get worse”). Based on these findings and proposals, the current FACT-G is now in its fourth version.
Thus, in this study, we used the fourth version of the instrument proposed by Webster et al. [21], which is comprised of 27 items divided into four factors (physical being, social and family being, emotional well-being, functional well-being) in a reflexive model. All items are rated using a 5-point Likert scale response mat (0 = Not at all, 4 = Very much). Two factors are for-mulated in the positive direction and two in the negative direction. One item in the emotional well-being dimen-sion presents a reversed response scale relative to the other items for the same factor. In this study, we used the Portuguese version of the FACT-G, which was pro-vided and authorized by the Functional Assessment of Chronic Illness Therapy (FACIT) Group.
The non-response rate to FACT-G items (missing data) ranged from 0.1 to 0.6 % with the exception of item 14, which had an extremely high non-response rate (45 %). Considering this item refers to“satisfaction with sex life” and the literature has reported that participants infrequently respond to this item [30] and that FACIT permits its exclusion, we decided to remove this item from the analysis. Additionally, since the sample had an expanded size, it was decided to exclude individuals who did not respond to one or more of the other instrument items (listwise). Thus, the final sample consisted of 975 participants (mean age: 53.3 years, SD = 13.0) (Table 1).
In this study, we also used the EORTC QLQ-C30 to es-timate the concurrent validity of the FACT-G. Therefore, it should be clarified that used the original factorial pro-posal for the EORTC QLQ-C30 consists of nine first order factors (Physical, Role, Emotional, Cognitive and Social functioning, Fatigue, Nausea and vomiting, Pain, Overall Quality of Life - global score) and 5 single terms grouped together into a factor referred to as “Spurious.” The fit of this version to sample was adequate (χ2
/df = 3071; Comparative Fit Index [CFI] = .968; Tucker-Lewis index [TLI] = .961; root mean square error of approximation [RMSEA] = .046).
Transcultural adaptation of the FACT-G Face validity
To analyze face validity, we used the guidelines proposed by Guillemin et al. [31] and Beaton et al. [32].
The instrument translation was independently per-formed by three bilingual translators who were native Portuguese speakers and had knowledge and experience in an English-speaking country. This study’s researchers
evaluated translations in order to obtain a consensus for a single Portuguese version. This version was back-translated by a bilingual individual who was a native English speaker. The final Portuguese version was then evaluated by a team of three teachers and three Portu-guese oncology experts to ensure that the semantic, idiomatic, cultural, and conceptual aspects of the instru-ment were comparable to those of the original version.
Our final version was compared to the original version of the instrument and to the original Portuguese version proposed by the FACIT Group. It was not necessary to alter the Portuguese version presented by FACIT.
To calculate the misunderstanding index (MI) of each item, the FACT-G was administered to the same 32 can-cer patients in interview form. No items presented a MI > 10 %; thus, it did not require reformulation.
Content validity
The content validity of the FACT-G was estimated using the Content Validity Ratio (CVR) proposed by Lawshe [33]. In this stage, 12 judges/experts in the field of on-cology/nutrition rated each item according to its essenti-ality. To evaluate the CVR, we used Wilson et al.’s [34] proposal ofα = 5 % (CVR12; 0.05≥ 0.57).
Evaluation of psychometric characteristics
To evaluate the psychometric sensitivity of the items, summary and shape measures were estimated. Items with absolute values of skewness (Sk) and kurtosis (Ku) greater than 3 and 7, respectively [26], were considered to present a severe violation of normality. Multivariate outliers were identified using Mahalanobis distance [35, 36].
The construct validity of the instrument was estimated by measuring factorial, convergent, and discriminant val-idity. We conducted confirmatory factor analysis (CFA) using the matrix of polychoric correlations and the Weighed Least Squares Mean and Variance Adjusted (WLSMV) using MPLUS 6.12 software (Muthén & Muthén, Los Angeles, CA). To evaluate the goodness of fit, we used as the ratio chi-square by degrees of free-dom (χ2
/df ), CFI, TLI, and RMSEA as indices [35]. The model’s fit was considered adequate when χ2
/df≤ 2.0, CFI and TLI≥ .9, and RMSEA ≤ .08 [27, 35].
Items that had factor weights (λ) < .40 were removed, as well as those that were redundant by the modification indices estimated by the Lagrange multipliers (LM) method (LM > 11, p < .001). The modification indices were also used to verify the correlation between the item errors [35].
The invariance of the best model was assessed with multi-group analysis using the difference of chi-squares method (Δχ2
). Here, the sample was randomly divided into two parts (6:4), where 60 % comprised the “Test Sample” and 40 % the “Sample Validation.” Multi-group
analysis used to conduct the invariance test, using the chi-square difference (Δχ2
) between the model with free factorial weights and the model with equal weights. If the hypothesis of the factorial weight’s invariance was acceptable (metric invariance), then analyses of the inter-cepts’ invariance (scalar invariance) and residual’s vari-ances/covariances invariance (structural invariance) were conducted [26, 37].
Correlation analysis between the factors of the FACT-G and EORTC QLQ-C30 were used to estimate the concurrent/divergent validity. The concurrent validity is de-termined by a front moderate to strong correlation between theoretically similar factors and divergent validity by a front of weak correlations among theoretically distinct factors.
Convergent validity was assessed using the Average Vari-ance Extracted (AVE) [35, 38] and values of AVE≥ .50 were considered adequate [27]. Discriminant validity was estimated by calculating the correlations between the factors and was considered adequate when AVEi and AVEj≥ ρij2[26, 35, 38].
We assessed internal consistency using Cronbach’s standardized alpha coefficient (α) and Composite Reliability (CR). Internal consistency was considered adequate when α ≥ .70 [39] and CR ≥ .70 [27].
After defining the best model, we explored the pres-ence of a significant correlation between the factors. Subsequently, based on the theoretical justification for evaluation of a higher order factor, we developed a sec-ond order hierarchical model (SOHM).
The analyses were performed using SPSS version 22.0 (IMB, Chicago, IL) and MPLUS 6.12 (Muthén & Muthén, Los Angeles, CA) programs.
Ethical considerations
The present study was approved by the Research in Humans Ethics Committee of the Cancer Hospital of Barretos (protocol 561/2011). Only patients who agreed and signed the informed consent form participated in the study.
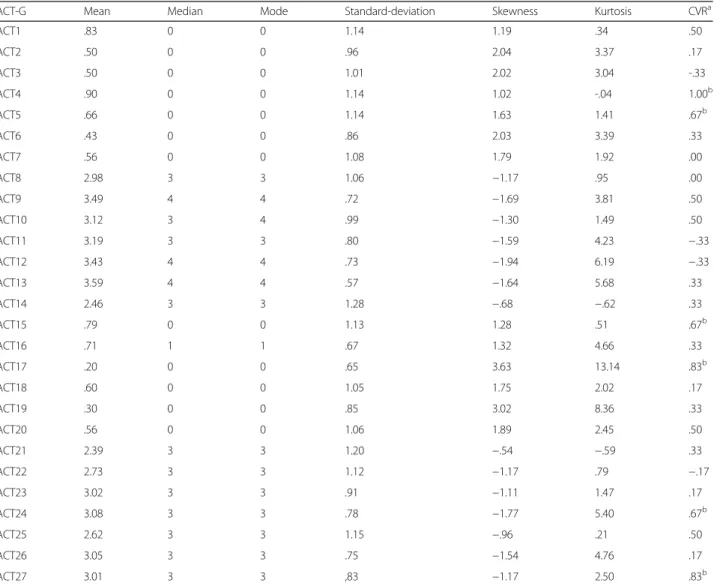
Table 2 Summary and shape measures and the content validity ratio of the items
FACT-G Mean Median Mode Standard-deviation Skewness Kurtosis CVRa
FACT1 .83 0 0 1.14 1.19 .34 .50 FACT2 .50 0 0 .96 2.04 3.37 .17 FACT3 .50 0 0 1.01 2.02 3.04 -.33 FACT4 .90 0 0 1.14 1.02 -.04 1.00b FACT5 .66 0 0 1.14 1.63 1.41 .67b FACT6 .43 0 0 .86 2.03 3.39 .33 FACT7 .56 0 0 1.08 1.79 1.92 .00 FACT8 2.98 3 3 1.06 −1.17 .95 .00 FACT9 3.49 4 4 .72 −1.69 3.81 .50 FACT10 3.12 3 4 .99 −1.30 1.49 .50 FACT11 3.19 3 3 .80 −1.59 4.23 −.33 FACT12 3.43 4 4 .73 −1.94 6.19 −.33 FACT13 3.59 4 4 .57 −1.64 5.68 .33 FACT14 2.46 3 3 1.28 −.68 −.62 .33 FACT15 .79 0 0 1.13 1.28 .51 .67b FACT16 .71 1 1 .67 1.32 4.66 .33 FACT17 .20 0 0 .65 3.63 13.14 .83b FACT18 .60 0 0 1.05 1.75 2.02 .17 FACT19 .30 0 0 .85 3.02 8.36 .33 FACT20 .56 0 0 1.06 1.89 2.45 .50 FACT21 2.39 3 3 1.20 −.54 −.59 .33 FACT22 2.73 3 3 1.12 −1.17 .79 −.17 FACT23 3.02 3 3 .91 −1.11 1.47 .17 FACT24 3.08 3 3 .78 −1.77 5.40 .67b FACT25 2.62 3 3 1.15 −.96 .21 .50 FACT26 3.05 3 3 .75 −1.54 4.76 .17 FACT27 3.01 3 3 ,83 −1.17 2.50 .83b a CVR12; 0.05= 0.57; b
Results
The adherence rate was 92.8 %. The reasons for non-adherence to the study were lack of time (n = 5), having participated in another study on the same day (n = 1), shyness (n = 2), not feeling well (n = 3), refusal to complete the socio-demographic questionnaire (n = 1), no justification (n = 7), and reluctance to participate be-cause data were to be collected via interview (n = 60).
Among participants, there was a higher prevalence of women as well as individuals with religious practice and
those who were married, working, had breast and lower digestive tract cancer, were undergoing chemotherapy, and without metastasis (Table 1).
The summary measures of participants’ answers on the FACT-G and the CVR are presented in Table 2.
The only item that presented psychometric sensitivity issues was item 17 (“losing hope in the fight”). We no-ticed that the judges/experts indicated that only 6 items were considered essential to assessment of the impact of disease/treatment on the HRQOL of cancer patients.
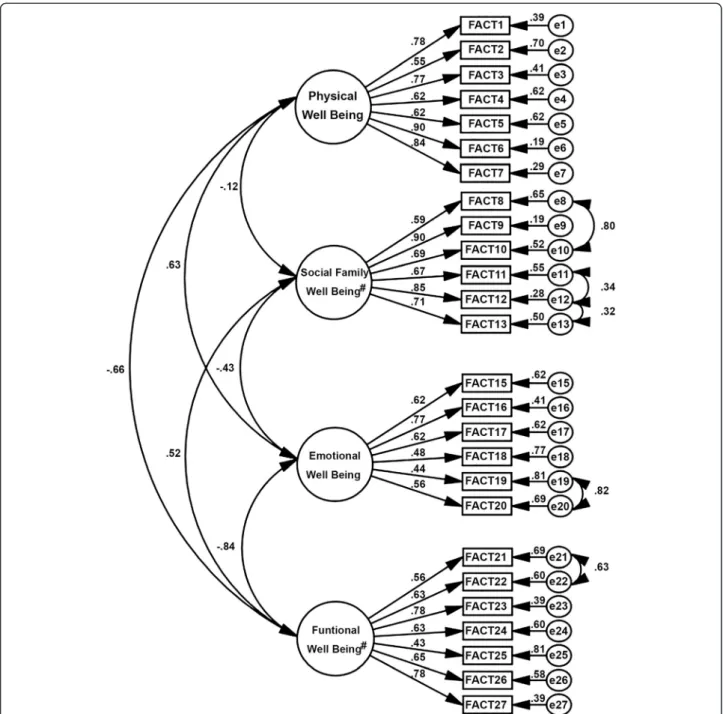
Fig. 1 Factor structure of the refined model of the Functional Assessment of Cancer Therapy.λ = .43 to .90; χ2/df = 8.611, Comparative fit index (CFI)
The factor structure of the FACT-G showed unsatisfac-tory fit to the sample (λ = .43 to .92; χ2
/df = 13.313, CFI = .857, TLI = .841, RMSEA = .112). Following the modifi-cation indices, five correlations were inserted between the errors (e8–e10, e11–e12, e12–e13, e19–e20, e21–e22).
The factor structure of the refined model fit the sample (Appendix) (λ = .43 to .90; χ2
/df = 8.611, CFI = .913, TLI = .902, RMSEA = .088) and is presented in Fig. 1. The fit of the refined model was adequate for the test sample (λ = .42 to .89; χ2
/df = 5.034, CFI = .914, TLI = .903, RMSEA = .083) and for the validation sample (λ = .40 to .89; χ2/df = 4.436, CFI = .916, TLI = .905, RMSEA = .094). The model was not invariant for independent samples (Δχ2
:μ: p < .001, i: p < .958, Cov: p < .001, Res: p < .001).
We observed low convergent validity for emotional well-being (AVE = .35), and functional well-well-being (AVE = .42). The AVE presented adequate values for physical well-being (AVE = .54) and social and family well-being factors (AVE = .55). The reliability was adequate (CR = .76–.89 and α = .71–.82).
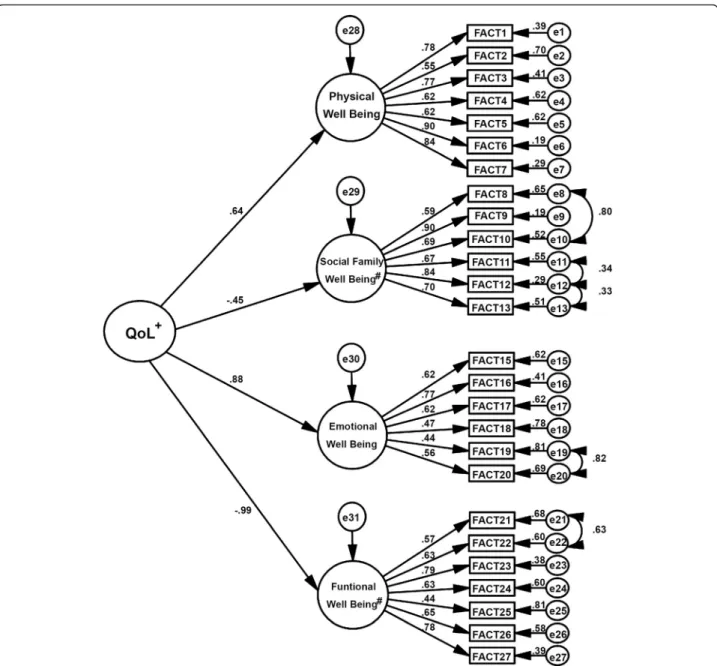
Based on the significant correlations between the pri-mary factors (Fig. 1) and the theoretical justification of drafting a final construct built from the four primary fac-tors, a SOHM was constructed.
The fit of the SOHM to the sample (λ = .44 to .90; χ2
/ df = 8.708, CFI = .911, TLI = .901, RMSEA = .089) is pre-sented in Fig. 2.
It is noteworthy that the following factors made a great contribution to the operationalization of the HRQOL
Fig. 2 Factor structure of the second order hierarchical model of the Functional Assessment of Cancer Therapy.λ = .44 to .90; χ2/df = 8.708, Comparative fit
construct: Functional Well-being (β = −.985), Emotional Well-being (β = .881), and Physical Well-being (β = .641).
The correlation matrix between the FACT-G and EORTC QLQ-C30 factors is presented in Table 3. Adequate validity concurrent/divergent of FACT-G was found. Specifically, there were high correlations between theoretically similar factors, and low correlations between different factors.
Discussion
This study tested and determined the validity and reliabil-ity of the FACT-G when applied to a sample of Brazilian cancer patients.
The FACT-G is a widely used instrument in clinical practice for the evaluation of cancer patients. This study presented an evaluation of the instrument’s factor struc-ture when applied to a large Brazilian sample, providing professionals with information about the steps neces-sary to evaluate its psychometric properties and the quality of the information that can be obtained from it.
To ensure that the structure of the FACT-G was ad-equate for the sample, one item was removed (item 14). In particular, item 14 pertains to the patient’s satisfaction with his/her sex life, and is therefore characterized as a very specific item that reflects the interviewee’ intimacy. As a result, the non-response rate was 45 %, which pre-vented its inclusion in the evaluation of the total sample. This finding was also observed by Dapueto et al. [40]. The FACIT Group suggests that if the participant does not feel comfortable responding to this item, he/she should not respond to this item and the interviewer should move to the next item. Regarding the inclusion
of the correlations between the errors (LM > 11), this can be justified by the theoretical proximity of the items. It is also clear that, although item 17 presented prob-lems with regard to psychometric sensitivity, the same fac-torial structure presented adequate weight. Furthermore, the importance of its theoretical content justifies its reten-tion for the purpose of maintaining the structure of the FACT-G. This item assesses the“hope of the individual in the fight against disease” and, as was already reported by Shinn et al. [41], is an important aspect of HRQOL.
Additionally, it is necessary to address the issue of the CVR (Table 2), as the experts only considered six FACT-G items to be essential. This raises the questions of the judges’ actual experience evaluating HRQOL, since the FACT-G was developed by a group of experts and is widely accepted at national and international levels. Thus, despite the judges’ responses in terms of items related to the construct, perhaps their knowledge is specific to par-ticular types of cancer, leading to the determination that some instrument items were nonessential.
This study also presents a hierarchical model of the FACT-G that shows the contribution of each factor in building the central concept evaluated by the instrument. Specifically, results indicated that physical, emotional and functional well-being had a greater contribution to the con-struct formulation (Fig. 2). This may have been related to the high toxicity of treatments (chemotherapy and radio-therapy) and the severity of the disease, which impact pa-tients’ physical quality of life, and consequently affect physical, functional, and emotional factors. Therefore, this should be taken into account in the approach used and/or
Table 3 Correlation’s matrix of factors of the FACT-G and EORTC QLQ-C30 (version fitted to the sample)
FACT-G EORTC QLQ-C30
Factorsa PWB SFWB EWB FWB QL PF RF EF CF SF FA NV PA SPUR
FACT-G PWB 1 SFWB -.17 1 EWB .61 -.38 1 FWB -.65 .57 -.75 1 EORTC QLQ-C30 QL -.61 .34 -.53 .73 1 PF .87 -.14 .45 -.64 -.46 1 RF .79 -.07 .44 -.70 -.49 .92 1 EF .60 -.26 .90 -.51 -.47 .47 .46 1 CF .49 -.21 .46 -.34 -.27 .47 .49 .42 1 SF .46 -.24 .45 -.62 -.55 .47 .54 .50 .34 1 FA .92 -.08 .55 -.58 -.51 .82 .81 .51 .59 .43 1 NV .98 .01 .28 -.27 -.23 .43 .48 .32 .30 .21 .61 1 PA 1.00 -.12 0.42 -.47 -.44 .58 .61 .48 .42 .38 .68 .32 1 SPUR .93 -.16 .58 -.71 -.47 .81 .78 .62 .65 .36 .98 .84 .68 1 a
FACT-G: PWB physical well-being, SFWB social family well-being, EWB emotional well-being, FWB functional well-being; EORTC QLQ-C30: QL overall quality of life (global score), PF physical functioning, RF role functioning, EF emotional functioning, CF cognitive functioning, SF social functioning, FA fatigue, NV nausea and vomiting, PA pain, SPU spurious (single terms)
professional management of such patients. These factors also had higher correlation coefficients in front of the EORTC QLQ-C30 including the quality of life (global) fac-tor that aims for the same supremacy in term the impact of disease and treatment on patients’ HRQOL (Table 3).
Another aspect we found was the lack of invariance in the model when fitted to different samples. This provides a warning that, although changes in sample characteristics may not interfere with the model fit, they may interfere with the operationalization of the construct. Conse-quently, professionals who use this tool must know the psychometric properties of the instrument in reference to the specific sample to be evaluated.
A limitation of this study may be the adoption of a non-probabilistic sampling design, which inevitably exerted in-fluence on sample characteristics. However, this strategy has been commonly utilized in validation studies. The use of sufficient sample size ensures credibility in the decision-making resulting from the statistical tests. Thus, it is suggested that structural model we have presented be tested in other samples, with different clinical and socio-demographic characteristics to confirm its stability and increase its representativeness. The lack of test-retest reli-ability could also be cited as a limitation. However, it should be considered that among patients with cancer, HRQOL may change in a short period depending on the treatment type and diagnosis. Consequently, this could skew the reproducibility of analyses. Thus, to evaluate this possibility, we suggest conducting a follow-up study. It is only by doing so that accurate evidence related to the temporal stability of the FACT-G can be obtained.
Another suggestion for future studies is to use ITR as an analytical strategy to complement traditional analyses (such as those presented in this study). The use of IRT could provide information regarding item construction, local independence, and the individual profile related to impact on HRQOL.
Conclusion
The FACT-G was found to be a valid and reliable assess-ment of HRQOL in a Brazilian sample of cancer pa-tients. It is important to note that, similar to the present study, the structure of the FACT-G should be evaluated when the sample or cultural context have distinct char-acteristics. This will ensure that the instrument will col-lect valid and reliable data suitable for each sample type.
Abbreviations
AVE:average variance extracted; BMI: body mass index; CFA: confimatory factor analysis; CFI: comparative fit index; CR: composite reliability; CVR: content validity ratio; EORTC QLQ-C30: European Organization for Research and Treatment of Cancer-Quality of Life Questionnaire Core 30; FACIT: functional assessment of chronic illness therapy; FACT-G: functional assessment of cancer therapy-general; HRQOL: health-related quality of life; IRT: item response theory; Ku: kurtosis; RMSEA: root mean square error of approximation; LM: lagrange multipliers; MI: misunderstanding index; Sk: skewness; SOHM: second order hierarchical
model; TLI: tucker-lewis index; WLSMV: weighed least squares mean and variance adjusted; WHOQOL-100: World Health Organization Quality Of Life Assessment. Competing interests
The authors have no competing interests to declare. Authors’ contributions
MCBS wrote the first manuscript draft, prepared the literature review, collected the data and preliminary statistical analysis. SVS made a critical analysis of the final version of the manuscript. JM made a critical analysis of the final version of the manuscript and he guided the methods of statistical analysis. JADBC idealized the project, supervised data collection, helped in the preparation manuscript drafting, approved the final version manuscript and statistical analysis. All authors read and approved the final manuscript. Acknowledgements
The authors would like to thank the Barretos Cancer Hospital for authorizing our data collection.
Funding
The authors would like to thank the Fundação de Amparo à Pesquisa do Estado de São Paulo (FAPESP) for funding the study (Grant #2011/22620-5) and the Coordenação de Aperfeiçoamento de Pessoal de Nível Superior (CAPES) for granting a scholarship for conducting the study.
Author details
1Departamento de Alimentos e Nutrição. Faculdade de Ciências
Farmacêuticas de Araraquara, UNESP-Univ Estadual Paulista, Rod. Araraquara-Jaú, km 01, Araraquara, São Paulo, Brazil.2Barretos Cancer
Hospital - Fundação Pio XII, Barretos, São Paulo, Brazil.3William James Center for Research, ISPA-Instituto Universitário, Rua Jardim do Tabaco, n°34, 1149-041 Lisbon, Portugal.
Received: 25 November 2014 Accepted: 21 December 2015
References
1. Wan Leung S, Lee TF, Chien CY, Chao PJ, Tsai WL, Fang FM. Health-related quality of life in 640 head and neck cancer survivors after radiotherapy using EORTC QLQ-C30 and QLQ-H&N35 questionnaires. BMC Cancer. 2011;11:128. 2. Taieb D, Baumstarck-Barrau K, Sebag F, Fortanier C, De Micco C, Loundou A,
et al. Heath-related quality of life in thyroid cancer patients following radioiodine ablation. Health Qual Life Outcomes. 2011;9:33. 3. Uwer L, Rotonda C, Guillemin F, Miny J, Kaminsky MC, Mercier M, et al.
Responsiveness of EORTC QLQ-C30, QLQ-CR38 and FACT-C quality of life questionnaires in patients with colorectal cancer. Health Qual Life Outcomes. 2011;9:70.
4. DiSipio T, Hayes SC, Newman B, Aitken J, Janda M. Does quality of life among breast cancer survivors one year after diagnosis differ depending on urban and non-urban residence? a comparative study. Health Qual Life Outcomes. 2010;8:3.
5. Yost KJ, Hahn EA, Zaslavsky AM, Ayanian JZ, West DW. Predictors of health-related quality of life in patients with colorectal cancer. Health Qual Life Outcomes. 2008;6:66.
6. King MT, Stockler MR, Cella DF, Osoba D, Eton DT, Thompson J, et al. Meta-analysis provides evidence-based effect sizes for a cancer-specific quality-of-life questionnaire, the FACT-G. J Clin Epidemiol. 2010;63:270–81. 7. Bush SH, Parsons HA, Palmer JL, Li Z, Chacko R, Bruera E. Single- vs.
multiple-item instruments in the assessment of quality of life in patients with advanced cancer. J Pain Symptom Manage. 2010;39:564–71. 8. Montazeri A. Health-related quality of life in breast cancer patients: a
bibliographic review of the literature from 1974 to 2007. J Exp Clin Cancer Res. 2008;27:32.
9. Bernhard J, Cella DF, Coates AS, Fallowfield L, Ganz PA, Moinpour CM, et al. Missing quality of life data in cancer clinical trials: serious problems and challenges. Stat Med. 1998;17:517–32.
10. Cella DF, Tulsky DS, Gray G, Sarafian B, Linn E, Bonomi A, et al. The functional assessment of cancer therapy scale: development and validation of the general measure. J Clin Oncol. 1993;11:570–9.
11. Casali P, Licitra L, Costantini M, Santoro A, Viterbori P, Bajetta E, et al. Quality of life assessment and clinical decision-making. Ann Oncol. 1997;8:1207–11.
12. The WHOQOL Group. The World Health Organization Quality of Life Assessment (WHOQOL): development and general psychometric properties. Soc Sci Med. 1998;46:1569–85.
13. The WHOQOL Group. WHOQOL: measuring quality of life. Geneva: World Health Organization; 1997.
14. Fleck MP, Louzada S, Xavier M, Chachamovich E, Vieira G, Santos L, et al. Application of the Portuguese version of the instrument for the assessment of quality of life of the World Health Organization (WHOQOL-100). Aplicacao da versao em portugues do instrumento de avaliacao de qualidade de vida da organizacao mundial da saude (WHOQOL-100). Rev Saude Publica. 1999;33:198–205 (in Portuguese).
15. Fleck MP, Louzada S, Xavier M, Chachamovich E, Vieira G, Santos L, et al. Application of the Portuguese version of the abbreviated instrument of quality life WHOQOL-bref. Aplicação da versão em português do instrumento abreviado de qualidade de vida“WHOQOL-bref”. Rev Saude Publica. 2000;34:178–83. in Portuguese.
16. Fleck MP. The World Health Organization instrument to evaluate quality of life (WHOQOL-100): characteristics and perspectives]. O instrumento de avaliação de qualidade de vida da Organização Mundial da Saúde (WHOQOL-100): características e perspectivas Ciência. Saúde Coletiva. 2000;5:33–8. in Portuguese. 17. Ware JE, Sherbourne CD. The MOS 36-item short-form health survey (SF-36).
I. Conceptual framework and item selection. Med Care. 1992;30:473–83. 18. McHorney CA, Ware JE, Raczek AE. The MOS 36-Item Short-Form Health
Survey (SF-36): II. Psychometric and clinical tests of validity in measuring physical and mental health constructs. Med Care. 1993;31:247–63. 19. Hubanks L, Kuyken W. Quality of life assessment: an annotated bibliography.
Geneva: World Health Organization; 1994.
20. Aaronson NK, Ahmedzai S, Bergman B, Bullinger M, Cull A, Duez NJ, et al. The European Organization for Research and Treatment of Cancer QLQ-C30: a quality-of-life instrument for use in international clinical trials in oncology. J Natl Cancer Inst. 1993;85:365–76.
21. Webster K, Odom L, Peterman A, Lent L, Cella D. The functional assessment of chronic illness therapy (FACIT) measurement system: validation of version 4 of the core questionnaire. Qual Life Res. 1993;8:555–665.
22. Winstead-Fry P, Schultz A. Psychometric analysis of the Functional Assessment of Cancer Therapy-General (FACT-G) scale in a rural sample. Cancer. 1997;79:2446–52.
23. Overcash J, Extermann M, Parr J, Perry J, Balducci L. Validity and reliability of the FACT-G scale for use in the older person with cancer. Am J Clin Oncol. 2002;24:591–6.
24. Fregnani CM, Fregnani JH, Dias de Oliveira Latorre Mdo R, de Almeida AM. Evaluation of the psychometric properties of the Functional Assessment of Cancer Therapy-Cervix questionnaire in Brazil. PLoS One. 2013;8, e77947. 25. Webster K, Cella D, Yost K. The Functional Assessment of Chronic Illness
Therapy (FACIT) measurement system: properties, applications, and interpretation. Health Qual Life Outcomes. 2003;1:79.
26. Maroco J. Análise de equações estruturais: fundamentos teóricos, softwares e aplicações. 2nd ed. Lisboa: Report Number; 2014 (in Portuguese). 27. Hair JF, Babin BW, Anderson RE, Tatham RL. Multivariate data analysis. New
Jersey: Prentice Hall; 1991.
28. Associação Brasileira de Empresas de Pesquisa. Economic classification criteria Brazil, Critério de classificação econômica Brasil. 2011. http://www. abep.org.
29. World Health Organization. Obesity: preventing and managing the global epidemic. Geneva: World Health Organization; 2000.
30. Dapueto JJ, Servente L, Francolino C, Hahn EA. Determinants of quality of life in patients with cancer. Cancer. 2005;103:1072–81.
31. Guillemin F, Bombardier C, Beaton D. Cross-cultural adaptation of health-related quality of life measures: literature review and proposed guidelines. J Clin Epidemiol. 1993;46:1417–32.
32. Beaton DE, Bombardier C, Guillemin F, Ferraz MB. Guidelines for the process of cross-cultural adaptation of self-report measures. Spine. 2000;25:3186–91. 33. Lawshe CH. A quantitative approach to content validity. Pers Psychol.
1975;28:563–75.
34. Wilson FR, Pan W, Schumsky DA. Recalculation of the critical values for Lawshe’s content validity ratio. Meas Eval Counse Dev. 2012;45:197–210. 35. Maroco J. Análise de equações estruturais: fundamentos teóricos, softwares
e aplicações. Lisboa: Report Number; 2010.
36. Kline RB. Principles and practice of structural equation modeling. New York: The Guilford Press; 1998.
37. Kaplan D. Structural equation modeling: foundations and extensions. Thousand Oaks: Sage Publications; 2000.
38. Fornell C. Evaluating structural equation models with unobservable variables and measurement error. J Marketing Res. 1981;18:39–50.
39. Maroco J. Qual a fiabilidade do alfa de Cronbach? Questões antigas e soluções modernas? Laboratório de Psicologia. 2006;4:65–90 (in Portuguese). 40. Dapueto JJ, Francolino C, Servente L, Chang CH, Gotta I, Levin R, et al.
Evaluation of the Functional Assessment of Cancer Therapy-General (FACT-G) Spanish Version 4 in South America: classic psychometric and item response theory analyses. Health Qual Life Outcomes. 2003;1:32. 41. Shinn EH, Taylor CL, Kilgore K, Valentine A, Bodurka DC, Kavanagh J, et al.
Associations with worry about dying and hopelessness in ambulatory ovarian cancer patients. Palliat Support Care. 2009;7:299–306.
• We accept pre-submission inquiries
• Our selector tool helps you to find the most relevant journal • We provide round the clock customer support
• Convenient online submission • Thorough peer review
• Inclusion in PubMed and all major indexing services • Maximum visibility for your research
Submit your manuscript at www.biomedcentral.com/submit