Orientador de Dissertação:
PROFESSOR DOUTOR LUÍS ANDRADE
Coordenador de Seminário de Dissertação:
PROFESSOR DOUTOR LUÍS ANDRADE
PERFORMANCE IN THE FACE OF INTERNALEVENTS
.
RELATIONSHIP BETWEEN PSYCHOLOGICAL
FLEXIBILITY AND INDIVIDUAL WORK PERFORMANCE
.
Dissertação de Mestrado realizada sob a orientação do Professor Doutor Luís Andrade, apresentada no ISPA– Instituto Universitário – Ciências Psicológicas, Sociais e da Vida, para obtenção de grau de Mestre na especialidade de Psicologia Social e das Organizações.
AKNOWLEDGEMENTS
When meditating on the past 5 years, marked as getting a degree in Organizational Psychology, simple – is not the word that comes to mind. After all, it involved two countries, two universities, three languages, uncounted number of flights, lots of paperwork and one marriage to come to this significant point in time. In the very first place my thanks go out to my God, Who made it all possible and through Whom all things work out for my good.
I am thankful to Universytet Opolski where it all had started, for the life changing experience of Erasmus+, where I have first fallen in love with Portugal. Small things in life have led to great results.
To ISPA - Instituto Universitário – Ciências Psicológicas, Sociais e da Vida I am thankful for the opportunities given to me; first of all in Erasmus program and then in accepting me as the student of ISPA. My experience is forever marked with positive feelings and understanding of the profound knowledge gained here. To all the teaching staff who influenced my life and shared their knowledge and experience in the area of Organizational Psychology, thank you.
My gratitude is extended to my professor and advisor Dr. Luís Andrade, whose guidance and support have been of great importance in conducting this research and the process of writing this thesis. I appreciate your knowledge, advice and encourage during this time. I am also thankful for your attitude of welcome and acceptance, for not differentiating me among other students, and for your faith in me, regardless of cultural and language differences.
I would like to thank my colleague, with whom we waded through this stage – Monica – thank you for your encouragement, help, support and friendship.
ABSTRACT
The goal of the study was to investigate the relationship between Psychological Flexibility and Individual Work Performance that has not been studied previously and, thus, to try and add to the growing body of knowledge in the area of Organizational Psychology. The level of Psychological Flexibility of individuals was measured using the Work-related Acceptance and Action questionnaire (WAAQ) developed by Bond, Lloyd and Guenole (2013) and Individual Work Performance Scale (IWPQ) developed by Koopmans et al., (2014) was used to assess the levels of Contextual and Task performance, and Counterproductive Work behavior of participants. It has been our goal to verify whether executing management position at work has a moderating effect on the abovementioned relationship.
One hundred and three (N=103) individuals agreed to voluntarily participate in this study, from which 46,6% (n=48) were male and 53,4% (n=55) were female. The sample showed to be international, with participants from 16 different countries. In terms of age, the sample ranged from 20 to 67 years old, where majority of participants fell between 20 to 30 years old, making 45.6% of the total. The 28,2% (n=29) of respondents declared to execute a management function at their workplace.
The first hypothesis has been confirmed, showing that Psychological Flexibility is strongly and positively correlated with such dimensions of Individual Work Performance as Contextual and Task Performance, and negatively correlated with Counterproductive work behavior. The second hypothesis has not been confirmed and executing management position at work had no moderating effect on the abovementioned relationship.
Keywords: Psychological Flexibility, Individual Work Performance, management position.
TABLE OF CONTENTS
AKNOWLEDGEMENTS ... III ABSTRACT ... IV INDEX OF TABLES ... VIII INDEX OF FIGURES ... IX
INTRODUCTION ... 10
LITERATURE REVIEW ... 12
Psychological Flexibility ... 12
Definition and Context ... 12
ACT model of behavioral change ... 12
Mindfulness ... 14
Committed action and Behavior Change process ... 15
Psychological Flexibility and Similar Concepts ... 16
Emotional Intelligence. ... 16
Emotion Regulation ... 17
Big Five Model ... 18
Psychological Flexibility at Workplace ... 19
Psychological Flexibility and Performance ... 20
Individual Work Performance ... 22
Individual Work Performance dimensions ... 24
Task performance. ... 24
Contextual performance. ... 24
Individual Work Performance ... 33
Management (Leadership) Position ... 34
PROCEDURE ... 35
RESULTS ... 36
Psychological Flexibility – Work-related Acceptance and Action Questionnaire (7 items) ... 36
Validity ... 36
Reliability ... 37
Sensitivity ... 38
Individual Work Performance Scale – IWPQ (18 items) ... 40
Validity ... 40
Reliability ... 43
Sensitivity ... 45
Impact of demographic variables on Psychological Flexibility ... 47
Impact of demographic variables on Individual Work Performance ... 48
Contextual Performance ... 48
Task Performance ... 49
Counterproductive Work Behavior ... 49
Test of hypotheses ... 51
Hypothesis 1 ... 51
Hypothesis 2 ... 52
DISCUSSION ... 54
Limitations and suggestions for future research ... 57
Practical Implications of the Study ... 58
REFERENCES ... 59
ANNEX A – QUESTIONNAIRE ... 66
ANNEX B – DESCRIPTIVE STATISTICS OF THE SAMPLE ... 69
ANNEX C – METRIC QUALITIES OF WAAQ SCALE ... 71
ANNEX D – METRIC QUALITIES OF IWPQ SCALE ... 74
ANNEX E – IMPACT OF DEMOGRAPHIC VARIABLES ON PSYCHOLOGICAL FLEXIBILITY ... 82
ANNEX F - IMPACT OF DEMOGRAPHIC VARIABLES ON DIMENSIONS OF INDIVIDUAL WORK PERFORMANCE ... 85 ANNEX G – TEST OF HYPOTHESIS ... 94
INDEX OF TABLES
TABLE 1 – BRIEF DESCRIPTION OF BIG FIVE DIMENSIONS BASED ON COSTA AND MCCRAE (1987) .... 18
TABLE 2 – DESCRIPTIVE STATISTICS OF THE SAMPLE ... 31
TABLE 3 – WORK ACCEPTANCE AND ACTION QUESTIONNAIRE ... 33
TABLE 4 – INDIVIDUAL WORK PERFORMANCE SCALE ... 33
TABLE 5– TOTAL VARIANCE EXPLAINED OF THE WAAQ SCALE ... 37
TABLE 6 - CRONBACH’S ALPHA OF THE WAAQ SCALE ... 37
TABLE 7 - RELIABILITY OF THE WAAQ SCALE IF ITEM DELETED ... 38
TABLE 8 – SENSITIVITY OF THE ITEMS OF WAAQ SCALE ... 39
TABLE 9 – GENERAL SENSITIVITY OF THE PSYCHOLOGICAL FLEXIBILITY SCALE ... 39
TABLE 10 – TOTAL VARIANCE EXPLAINED FOR THE IWPQ SCALE ... 41
TABLE 11- ROTATED COMPONENT MATRIX IWPQ SCALE ... 42
TABLE 12 – CRONBACH’S ALPHA OF THE IWPQ SCALE AND ITS DIMENSIONS ... 43
TABLE 13 – RELIABILITY OF IWPQ DIMENSIONS IF ITEM WAS DELETED ... 44
TABLE 14 – SENSITIVITY OF ITEMS OF IWPQ SCALE ... 45
TABLE 15 – SENSITIVITY OF IWPQ DIMENSIONS ... 46
TABLE 16 – EFFECT OF DEMOGRAPHIC VARIABLES ON PSYCHOLOGICAL FLEXIBILITY ... 47
TABLE 17 - EFFECT OF AGE AND EDUCATION VARIABLES ON INDIVIDUAL WORK PERFORMANCE (DIMENSIONS) ... 50
TABLE 18 – RESULTS OF T-STUDENT TEST FOR EFFECT OF SEX AND MANAGEMENT POSITION ON INDIVIDUAL WORK PERFORMANCE (DIMENSIONS) ... 50
TABLE 19 – LINEAR REGRESSION BETWEEN PSYCHOLOGICAL FLEXIBILITY AND INDIVIDUAL WORK PERFORMANCE DIMENSIONS ... 51
TABLE 20 - RESULTS OF MULTIPLE LINEAR REGRESSION FOR MODERATION EFFECT OF MANAGEMENT POSITION AND INTERACTION BETWEEN PSYCHOLOGICAL FLEXIBILITY AND DIMENSIONS OF IWPQ ... 53
INDEX OF FIGURES
FIGURE 1 - SIX CORE PROCESSES OF ACCEPTANCE AND COMMITMENT THERAPY (HAYES ET AL, 2006). ... 14 FIGURE 2 – A THEORY OF INDIVIDUAL DIFFERENCES IN TASK AND CONTEXTUAL PERFORMANCE
(MOTOWIDLO, BORMAN & SCHMIT,1997). ... 23 FIGURE 3 – INVESTIGATION MODEL ... 28 FIGURE 4 – NUMBER OF PARTICIPANTS PER COUNTRY ... 30
INTRODUCTION
Organizations are composed of individuals and only reach their objectives if each employee is investing in the overall performance of the company. Performance of each individual is influenced by various factors. Internal events, such as positive or negative moods and emotions may impact one’s effectiveness and ability to make sound judgments (George, 2000). Various psychological models research and propose instruments that an individual can utilize to be able to manage a set of circumstances in which he is found and have control over own behavior, thoughts and emotions (Block and Block, 2014; Newman and Lorenz, 2003; Salovey and Mayer, 1990; Scheier and Carver, 1988, etc.). Inability to do so may result not only in reduced levels of performance, but also in a decrease of one’s psychological health.
Psychological ill-being of an employee that is often manifested through depression, fatigue and anxiety promotes cognitive deficit and impairs one’s motivation and ability to perform (Ford, Cerasoli, Higgins, and Decesare, 2011). Unfavorable experiences that go along with these manifestations may cause rumination, stress, negative thoughts, significant decrease of effectiveness, attempts to regulate one’s emotions and, consequently, deprive cognitive abilities of an individual (Beal, Weiss, Barros, and MacDermid, 2005; Gross & Muñoz, 1995; Noelen-Hoeksema, Wisco, & Lyubomirsky, 2008). For instance, Bond and Bunce’s research results have pointed out that individuals who are suppressing or avoiding difficult private events are more likely to have lower levels of mental health and productivity (Bond and Bounce, 2003). In their meta-analysis Ford et al., (2011) have substantiated that psychological well-being correlates with job performance, and more strongly with task performance than contextual performance.
Emotions are greatly involved in cognitive processes of an individual and his behavior. Moods are generally defined as feeling states of extensive duration but lower intensity; whereas feelings, are fast passing, high-potency states that were activated by a specific trigger (George, 2000; Salovey & Mayer, 1990). Both affect us daily. Several studies have demonstrated positive and negative influence of feelings, moods and emotions on effectiveness of leaders. Owing to negative emotions leaders may process information more thoroughly (Sinclair & Mark, 1992) and better mobilize their attentive resources (Frijda, 1988), where positive emotions may increase creativity, self-confidence and promote socialization in the workplace (George, 2000). At the same time negative internal events create opposite effects on leadership performance.
Bond, Flaxman and Bunce (2008) argue that psychological acceptance (also known as flexibility), that represents one’s willingness to encounter private events, such as feelings, emotions, thoughts or memories, without the need to avoid or suppress them, is an individual characteristic that can predict stress and promote work-related health. Furthermore, Psychological Flexibility enables people to address such internal events with the help of mindfulness, observing them in a non-judgmental manner, which in turn promotes mental health (Bond, Lloyd, and Guenole, 2013) and performance (Bond and Bunce, 2003).
The relative newness of Psychological Flexibility at work and its effect on employee and leader performance became the driving force in creation of this study. The goal of this research is to verify whether Psychological Flexibility correlates with Individual Work Performance and, if so, whether there is a moderating effect of executing a management position on this relationship.
LITERATURE REVIEW
Psychological Flexibility Definition and Context
Psychological Flexibility as a concept emanated in the area of clinical psychology as one of the components of psychological health, and exists inside the Acceptance and Commitment Therapy (ACT) proposed by Hayes, Strosahl and Wilson (1999).
Being psychologically flexible portends the ability of an individual to focus on being present in the given moment, and based on the opportunities and resources available, act towards achieving one's goals and values despite the difficult or unwanted private events (Bond, Flaxman, & Bunce, 2008). This high-level construct greatly depends on the context in which the individual is found. Based on the interactions between the psychological content, the present moment, and the value-based contingencies, the psychologically healthy response allows an individual to persist in or alter his behavior in order to achieve his goals (Bond, Hayes, and Barnes-Holmes, 2006). Psychological inflexibility, on the other hand, would manifest in strong dominance of psychological reactions over set goals and values (Bond et al., 2011).
Acceptance and Commitment Therapy (ACT) is a relatively new approach to contextual cognitive behavior therapy, that was designed with the goal to positively influence mental health and effectiveness of behavior of individuals through enhancement of their Psychological Flexibility (Bond, Lloyd, Flaxman, & Archer, 2016). ACT is set to improve one’s ability to predict and control internal psychological events in order to achieve defined goals and values (Hayes et al., 2006).
ACT model of behavioral change
According to Hayes et al., (2006) Acceptance and Commitment Therapy consists of the six main processes that create Psychological Flexibility:
1) Acceptance. Acceptance is presented as a substitute to experiential avoidance. Instead of running away from unpleasant internal events, an individual is presented with a chance to accept and be actively aware of those experiences, thus discontinuing their harmful suppression
and its destructive effects. Acceptance means using one’s limited resources on completing the goal-oriented task by being present in the given moment, instead of spending these resources on avoidance or control of internal events.
2) Cognitive Defusion. Authors state that “ACT attempts to change the way one interacts with or relates to thoughts by creating contexts in which their unhelpful functions are diminished”. Defusion leads to the decrease of ligature with the unpleasant internal experience, which in turn, lowers the desire to avoid it.
3) Contact with the present moment. Instead of avoiding the unwanted experiences, an individual is invited to be present in their context, be more flexible and act accordingly to the situation and their goals and values. By using the right language, events, experiences and feelings are described rather than judged. Being present means changing one’s focus to the events happening at this very time and getting in touch with the stimuli surrounding these events (Fletcher & Hayes, 2005).
4) Self as a Context is a process that allows an individual to find meaning of self outside the literal context of words (Hayes & Batten, 2000), a stable fact that will not change no matter the experiences and psychological events that this individual is experiencing. As a result, the person is able to accept and cognitively defuse the situation and understand that “self” is different from private events. This is achieved through the use of metaphors, mindfulness and experiential exercises.
5) Values. The abovementioned processes are serving the objective of bringing the individual on the path of effectuating their personal goals and values. An individual is invited to select values and areas of most importance according to his life’s directions, and using the Committed Action process work towards attaining them.
Figure 1 - Six Core Processes of Acceptance and Commitment Therapy (Hayes et al., 2006).
Mindfulness
Being one of the components of Psychological Flexibility, Mindfulness is an important concept to understand. Mindfulness has been defined as “a state of being attentive and aware of what is taking place in the present” (Brown & Ryan, 2003). Awareness of the present situation or environment is a behavior that conforms to standards of normal functioning, nonetheless,
scientists agree that individuals differ in their disposition and willingness to be attentive and aware, and that this ability can vary depending on a number of factors (Brown & Ryan, 2003).
Mindfulness by Bishop et al., (2003) is defined as “a process of regulating attention to bring quality of non-elaborative awareness to current experience and a quality of relating to one’s experience within an orientation of curiosity, experiential openness and acceptance”. When this process is a part of Psychological Flexibility an individual is able to observe his thoughts, feelings, emotions and sensations without elaborating, judging or controlling them. Success on the stage of Mindfulness and Acceptance processes allows proceeding to Commitment and Behavior Change processes.
The definition proposed by Fletcher and Hayes (2005) in the domain of ACT describes Mindfulness as interconnected relationship between the processes of acceptance, defusion, contact with the present moment, and self as a context (as shown by the lines on Figure 1).
Committed action and Behavior Change process
The second group of practices in order to achieve Psychological Flexibility is related to committed actions and behavior change based on one’s values and goals. Acceptance and Commitment theory tends to redirect person’s behavior in order to achieve their goals and values, which are actively lived out moment by moment (Hayes, Pistorello, and Levin, 2012). An individual takes on the responsibility and commits to the change of behaviors in order to attain his goals and values.
Acceptance and Action Questionnaire
After the creation of general AAQ scale several specific measurements have also been developed (for example, an Acceptance and Action Diabetes Questionnaire (AADQ) by Gregg, 2004, etc.).
Recently the questionnaire has been translated into other languages and adapted to various cultures (e.g.: Spanish version by Marial, 2004; Dutch version by Boelen and Reijntjes, 2008; Persian version by Abasi, Fti, Molodi, and Zarabi, 2013; Brazilian version by Barbosa and Murta, 2015; Chinese version by Zhang, Chung, Si, and Liu, 2014; Columbian version by Ruiz, Suárez-Falcón, Cárdenas-Sierra, Durán, Guerrero, and Riaño-Hernández, 2016).
Psychological Flexibility and Similar Concepts Emotional Intelligence.
Emotional Intelligence is a division of Social Intelligence (Thorndike, 1920), that has been defined as the ability to monitor one’s own and others’ feelings and emotions, to discriminate among them and to use this information to guide one’s thinking and actions (Salovey & Mayer, 1990). Salovey and Mayer (1990) define three divisions of emotional intelligence: appraisal and expression of emotions, regulation of emotions, and use of emotions to solve problems.
Appraisal and expression of emotions in self and others (verbal or non-verbal) aid normal and healthy functioning within society, and require such skills as the ability to detect, process, understand and express emotions and feelings. Perceiving non-verbal expressions of emotions that come from inside others helps better interaction, social adaptation and ability to relate to other individuals (Salovey and Mayer, 1990).
Regulation of emotions and moods in self and others causes adaptive and strengthened states of the person’s mood. Emotions can be used to solve problems, as, when controlled, they facilitate flexible planning, creative thinking and motivation (Salovey and Mayer, 1990).
Goleman (1999) has further investigated the topic of Emotional Intelligence and has put it in the surface of theory of performance for employees and leaders. In his theory and research, the author stated that competencies that are based on emotional intelligence combine cognitive and emotional skills and matter for every level of employees, more so for those who have a higher position in the company (Goleman, 2001).
Psychological Flexibility involves not only a person's emotions, but also other internal events, such as memories, thoughts, images, etc. While Emotional Intelligence deals with emotions of self and others around you, Psychological Flexibility has to do only with one’s internal experiences.
Emotion Regulation
Gross and Munoz (1995) substantiate in their work that emotion regulation is a crucial part of mental well-being of an individual. They define emotion regulation as “the manipulation in self or others of either emotion antecedents or one or more of the components of an emotional response - behavioral, subjective, or physical”. Thus they distinguish two ways in which emotion regulation manifests: antecedent-focused and response-focused.
Antecedent-focused emotion regulation regards the modification of external or internal environments prior to emotion take place. Examples of such regulation are avoiding physical environments that may trigger negative emotions or, on the contrary, stimulating positive emotions by putting oneself or others into an environment that generates positive emotions, directing one’s attention to a certain aspect of an environment in order to change the emotional value of a stimulus, etc.
Response-focused emotion regulation happens after an emotion process has been triggered. In practice it is achieved by such processes as suppression and inhibition of emotions (Gross, 1998).
Gross and Munoz (1995) have hypothesized that emotion regulation is necessary in order to be productive in one’s workplace. They argue that productivity and efficiency at work is succored by actively regulating one’s thoughts that may take away the employee’s attention, thus
Big Five Model
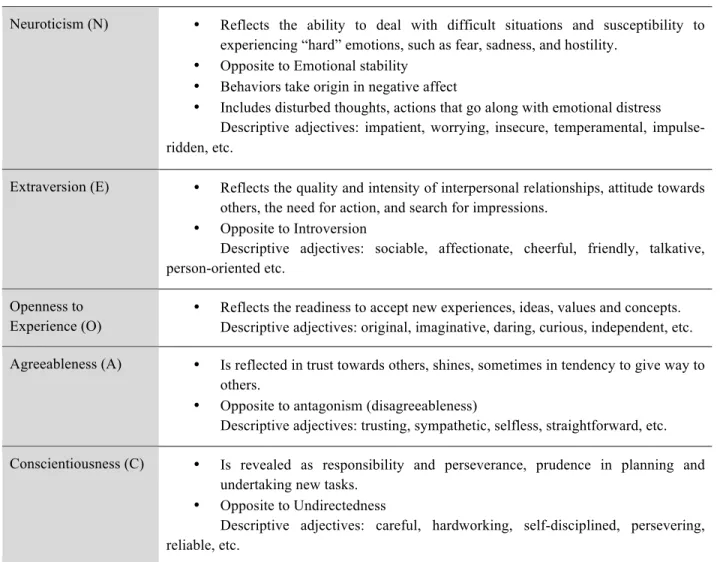
The Big Five model of personality is a model validated by Costa and McCrae (1987) that consists of five personality dimensions: Extraversion, Agreeableness, Conscientiousness, Neuroticism, and Openness to experience (Table 1).
Studies conducted by Bond et al., (2013) show that some Big Five factors of personality correlate with work-related Psychological Flexibility, such as: significant and positive correlation with Conscientiousness (r=.29), and significant and positive correlation with Openness to experience (r=.29), and significant negative correlation with Neuroticism (r=-.32). Gloster et al., (2011) also found significant and negative correlation between PF and Neuroticism (r=-.63); significant and positive correlation between Extraversion, Conscientiousness and Openness to new experiences (r=.49, r=.35, and r=.18).
Table 1 – Brief Description of Big Five Dimensions Based on Costa and McCrae (1987)
Neuroticism (N) • Reflects the ability to deal with difficult situations and susceptibility to experiencing “hard” emotions, such as fear, sadness, and hostility.
• Opposite to Emotional stability • Behaviors take origin in negative affect
• Includes disturbed thoughts, actions that go along with emotional distress Descriptive adjectives: impatient, worrying, insecure, temperamental, impulse-ridden, etc.
Extraversion (E) • Reflects the quality and intensity of interpersonal relationships, attitude towards others, the need for action, and search for impressions.
• Opposite to Introversion
Descriptive adjectives: sociable, affectionate, cheerful, friendly, talkative, person-oriented etc.
Openness to
Experience (O) •
Reflects the readiness to accept new experiences, ideas, values and concepts. Descriptive adjectives: original, imaginative, daring, curious, independent, etc. Agreeableness (A) • Is reflected in trust towards others, shines, sometimes in tendency to give way to
others.
• Opposite to antagonism (disagreeableness)
Descriptive adjectives: trusting, sympathetic, selfless, straightforward, etc. Conscientiousness (C) • Is revealed as responsibility and perseverance, prudence in planning and
undertaking new tasks. • Opposite to Undirectedness
Descriptive adjectives: careful, hardworking, self-disciplined, persevering, reliable, etc.
Latzman and Masuda (2013) conducted a research where they investigated the relationship between the three variables: Psychological Flexibility, Big Five and Mindfulness. Their findings show that Mindfulness and Psychological Inflexibility (the inverse of Psychological Flexibility) are negatively correlated with each other (r=-.48); Psychological Inflexibility was strongly and positively associated with Neuroticism (r=.64) and negatively correlated with Conscientiousness (r=-.51).
In contrast to aspects of personality presented by Big Five, Psychological Flexibility is an individual characteristic that can be trained and modified in order to actively encourage various work-related benefits (Bond, Hayes, & Barnes-Holmes, 2013; Bond, Lloyd, & Guenole, 2013).
Psychological Flexibility at Workplace
Authors state that Acceptance and Commitment Therapy is applicable to any context of human life, including the workplace (Bond et al., 2015). The objective of ACT is to foster Psychological Flexibility of individuals; meaning to lower the impact of negative internal events by empowering people to define and attain the goals that they value (Bond & Bunce, 2003).
Psychological Flexibility at work signify that employees are able to base their work-related behavior for the most part on their values and goals, rather than on the internal events (such as feelings, thoughts, memories, etc.), reinforcements and/or punishments (Bond et al., 2011). Such Flexibility permits an individual to face unpleasant experiences with mindfulness. In this way, the first four stages of ACT are applied and an individual doesn’t have to spend his cognitive and attention resources on experiential avoidance, suppression of negative thoughts, and controlling of unwanted experiences, but in turn direct them toward noticing and taking
Psychological Flexibility and Performance
Since Psychological Flexibility can be applied to various contexts of human life, including work-related sphere, Bond and Hayes (2002) have theorized that the processes involved in ACT are able to increase individual's performance and job satisfaction, given that performing well is valued by this individual. If the person values being productive at work, then being Psychologically Flexible would mean that, no matter the internal events, this person will be cognizant of the resources available at hand and will direct them toward achieving that what is valued. The internal experiences this individual may have will be approached in a mindful way, recognized and accepted, while goal-oriented mindset will permit the worker to understand how to be more productive at the task at hand with the resources at hand.
One of the aspects of performance is the ability to innovate, valued highly in the current environment of rapid change and industrial development. In one of the studies, Bond and Bunce (2000) have observed that application of therapies that promoted Psychological Flexibility had improved the inclination towards innovation of the participants. The results have also shown that this inclination has been achieved due to the increased levels of Psychological Acceptance of the group and not by altering the context (Bond & Bunce, 2000).
In 2003 Bond and Bunce investigated the role of acceptance and job control in mental health, job satisfaction, and work performance. Their longitudinal study has shown that acceptance has a mediating effect on mental health and innovation, and that that those individuals who do not tend to avoid their internal events or control them, have more attention resources and can perform better, if they have good performance at work as their goal (Bond & Bunce, 2003). Later, when Bond, Flaxman, and Bunce (2008) have replicated this quasi-experiment and investigated the influence of Psychological Flexibility on work redesign, they have demonstrated that individuals with higher levels of Psychological Flexibility were more aware of their ability for job control. This research had shown that call center workers with higher levels of Psychological Flexibility perceived greater job control and as a result may have lower levels of psychological distress and less absence occasions then those with lower levels of Psychological Flexibility (Bond, Flaxman, & Bunce, 2008).
In another longitudinal study Bond and Flaxman (2006) have researched the degree to which Psychological Flexibility and job control predict the ability of a call center workers to
learn new skill at work, their performance and mental health. Their study showed that the more Psychologically Flexible individuals were, the better mental health and performance they had. In contrast to the study of Bond and Bunce (2003) who measured performance by the number of errors in computer input, in this study Bond and Flaxman (2006) used the target-based performance measures.
In one of the most recent studies conducted by Kuo et al. (2018), Psychological Flexibility has been proposed to be an individual characteristic that precedes proactive behavior at work. Authors substantiated that Psychological Flexibility is positively related to proactive work behavior (p<.05), meaning that individuals with higher levels of Psychological Flexibility tend to act proactively at their workplaces (Kuo et al., 2018).
The research conducted by Ruiz and Odriozola-Gonzalez (2017) has focused on the predictive and moderating effect of Psychological Flexibility and the development of Job Burnout Syndrome. This cross-sectional study among Spanish employees (N=209) has delivered many results, among other, showing that work-related Psychological Flexibility significantly predicts work efficacy, and acts as a moderator in the relationship between such dimensions of Job Burnout as emotional exhaustion and cynicism, meaning that exhaustion in people with lower levels of Psychological Flexibility would more easily lead to the development of cynicism (Ruiz and Odriozola-Gonzalez, 2017).
Work-related stress can be generated by the job-inherent factors, and inability to properly respond to negative internal events may lead to increased levels of stress of the individual. In their study, Bond and Bunce (2000) investigated the ability of ACT interventions to reduce the levels of work-related stress through the process of acceptance. They have shown that changes in the willingness to accept present events, added to goal-orientedness, and enhanced participants’ abilities to effectively manage work-related stress.
Individual Work Performance
Individual Work Performance is an important construct of organizational psychology. Former research has focused on lowering the number of absence days or losses in productivity due to sick leaves (Koopmans et al., 2014), as well as identifying the variables that influence productivity and ways of toggling them to reach greater results. It should be said that, even though these terms have often been used as synonyms in the past, performance isn’t equal to productivity (Koopmans et al., 2011). The definition of productivity varies depending on the context, but it mostly has to do with the relation of output to input, and is almost synonymous to results (Koopmans, 2011; Tangen, 2005). Performance, on the other hand, is a broader concept that includes factors that are not related to costs, such as quality, speed, delivery and flexibility (Tangen, 2005). Performance has been defined by Campbell (1990) as “observable things people do that are relevant for the goals of the organization”. When referring to performance, we cannot simply evaluate the result of someone's work, as multiple factors that may be outside of the employee’s scope of work can influence the outcome of the work or the worker himself (Motowidlo, Borman, & Schmit, 1997).
Several conceptual frameworks of Individual Work Performance have been developed in the past three decades, and all of them agree that performance has to do with work-related behavior of the individual (Borman & Motowidlo, 1993; Campbell, 1990; Murphy, 1990, etc.).
Borman and Motowidlo (1993) have argued that job performance is a behavior that is episodic, multidimensional and subject to evaluation. Authors defined its two components as Task performance and Contextual performance. In their works they have described Task performance as behaviors and actions of the employees that have direct influence on the technical essence of the job, where technical tasks are performed or technical requirements are maintained. Contextual performance, on the contrary, was used as the term to describe actions and behaviors of employees that help sustain organization’s social and psychological environment in which the technical core functions.
A theory that demonstrates the differences between Contextual and Task performance has been offered by Motowidlo, Borman, and Schmit in 1997, where the authors show that one is based on personality variables, and the other one on the variables of one’ cognitive abilities; and both require a corresponding set of knowledge, habits and skills (Figure 2). In this theory Task
performance is realized through application of skills, knowledge and habits that directly affect the technical core and derive from persons cognitive abilities. Contextual performance is demonstrated through application of skills, habits and knowledge that has to do with social and organizational domains, and is hinged on individual’s personality.
Employee behavior that has a negative effect on the organization's effectiveness also had been included into the job performance definitions. Counterproductive behavior has been defined by Robinson and Bennett (1995) as voluntary actions that violate organizational norms and, in turn, jeopardizes other employees and the organization itself. Examples of such behavior are absenteeism, turnover, damage of goods, substance abuse, etc. (Viswesvaran & Ones, 2000).
Later, researchers have suggested that performance consisted of three extensive dimensions: Task performance, Contextual performance, and Counterproductive work behavior (Rotundo and Sackett, 2002; Viswesvaran & Ones, 2000).
Individual Work Performance dimensions
Task performance.
Campbell defined Task Performance as “proficiency with which an individual performs a central job task” (1990). Even though job task can differ depending on the type of job that one is performing, Task performance is usually described through quality and quantity of work, skills and knowledge (Campbell, 1990: Rotundo and Sackett, 2002). This type of performance refers to behaviors and actions of a worker that are directed to contribute to organizational goals, it is the main or core task for the job. Task performance may include such examples as machine operation, sales, product distribution, code writing, stock replenishment etc.
Contextual performance.
Individual work performance is more than simply accomplishing the work goals. Organization is a living organism consisting of individuals, interacting on a social, organizational and psychological levels. Thus contextual performance is an important component of individual performance that consists of behaviors reinforcing each of these levels. These are behaviors and actions directed to contribute to organizational effectiveness through supporting the environment in which that job task is done. Such activities may include taking initiative to do the task that is not normally a part of the job, collaboration with coworkers to get things done, persisting in the task with enthusiasm, acting in accordance with organizational rules, etc. (Borman & Motowidlo, 1997; Campbell, 1990).
In their systematic review Koopmans et al., (2011) suggest that Contextual performance has appeared in the literature under various names, such as interpersonal relations, organizational citizenship behavior, extra-role performance, and non-job-specific task proficiency.
Counterproductive work behavior
Counterproductive Work Behavior, on the other hand, is a “voluntary behaviors that harm the wellbeing of the organization” (Rotundo & Sackett, 2002). These are intentional negative actions of employees that do not contribute to the organizational goals, but on the contrary, serve as obstacles in achieving them. Examples of Counterproductive Work Behaviors are absenteeism, work-avoidance behaviors, theft, drug abuse, etc. (Koopmans et al., 2011).
In order to measure the dimensions of Individual Work Performance, Koopmans et al., have developed the Individual Work Performance Questionnaire (2013).
The scale has been used in various studies and translated to different languages, like Bahasa Indonesia (Widyastuti, & Hidayat, 2018), Swedish (Dådermana, Ingelgårda, & Koopmans, 2018).
Leadership
Scholars have been working on describing the differences between management and leadership for a long period of time (Kotterman, 2006; Maccoby, 2000; Zaleznik, 1992;). In the distinctions between leader and manager, generally the main contrast is that managers execute a more bureaucratic function of managing people or resources, where leaders are the ones who are driving change through building relationship within the organization. For the goal of this study, the terms “leadership” and “management” were used interchangeably, as a general term that would include both concepts under one umbrella. In such a broad definition leadership (management) can be found in almost all organizations, independently of the country or culture (Sauer & Kohls, 2011).
Flexibility and Leadership
In the past thirty years, with the increasing speed of development of technology, information flows, and overall tempo of global changes, businesses have seen the need to adapt to the world around them on all levels. The term Flexibility has been applied to leadership, along with such synonyms as adaptability, agility and versatility. For the most part leader flexibility has been looked at from the perspective of behavioral change in the face of shifting situations, like changes in the career step, competing values and tradeoffs, threats and opportunities, and management of subordinates (Kaiser & Overfield, 2010; Yukl & Mashud, 2010). Zaccaro proposed a three-element framework of components that help develop adaptability in leaders, which included Cognitive flexibility, Emotional flexibility and Dispositional flexibility (as cited in Calarco & Gurvis, 2006). These components allow increasing leader’s adaptability by continuous practicing of behaviors that are related to them. Cognitive flexibility involves behaviors that include analyzing, understanding and responding strategically to the environment; Emotional flexibility includes the behaviors that allow the leader to understand and connect with own emotions and those of others; and Dispositional flexibility is seen through behaviors conveying optimism and positive attitude (Calarco & Gurvis, 2006). George (2000) has also studied emotional intelligence as an important part of leader flexibility in his paper on emotional flexibility and leader effectiveness.
Psychological flexibility is another behavioral change model that includes perception of current environment and opportunities at hand, acceptance of self, and committed actions directed towards achievement of goals based of the individual’s values. To our knowledge there have not been many studies showing the relationship between psychological flexibility and leadership, aside from the ones conducting ACT interventions (Deval, Bernard-Curie, & Monestès, 2017; Moran, 2011).
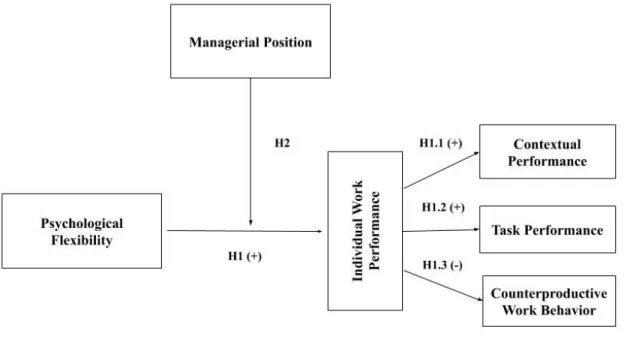
INVESTIGATION MODEL
Considering that after conducting a sizeable research, a theory that would show the relationship between the three variables (Psychological Flexibility, Individual Work Performance and executing a Leadership position) was not encountered, such empirical model has been created and operationalized in the Figure 3. It was our goal to find out whether Psychological Flexibility correlates with Individual Work Performance, and if so, whether there is a moderating effect of Leadership position between the relationships of the two.
As previous literature shows positive relationship between Psychological Flexibility and Job Performance (previously measured by target achievement and number of computer input errors), it is expected that Psychological Flexibility will positively relate to such dimensions of self-reported Individual Work Performance as Contextual performance and Task performance, and negatively correlate to the dimension of Counterproductive work behavior. It is also hypothesized that being in a Leadership (management) position may increase or lower this positive effect.
In addition to the above-mentioned model, it is essential to present the hypotheses of the current research:
H1: Psychological Flexibility positively relates to Individual Work Performance (IWP). H1.1: Psychological Flexibility will positively relate with IWP Contextual performance.
H1.2: Psychological Flexibility will positively relate with IWP Task performance.
H1.3: Psychological Flexibility will negatively relate to the IWP Counterproductive Work Behavior.
H2: Executing leadership position at workplace will moderate the relationship between Psychological Flexibility and Individual Work Performance.
METHOD
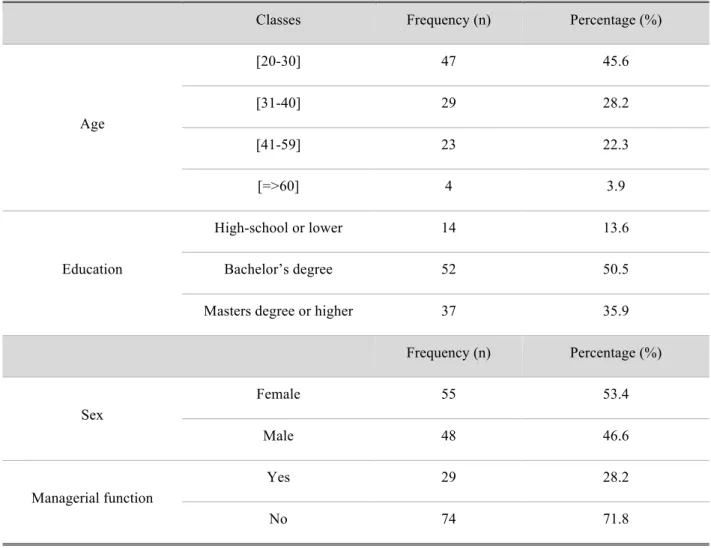
ParticipantsThe sample for this study has been selected by convenience, using the snowball method, where participants who have filled out the questionnaire shared it with their connections in order to increase the sample. All participants of the study were informed that their participation was voluntary and confidential, and that they are able to stop their participation at any given moment without any repercussions. The descriptive statistics of the sample are represented in the Table 2 and are also represented in the Annex B.
The total number of participants in this study was 103; from which 46,6% (n=48) were male and 53,4% (n=55) were female. This shows that, in terms of sex, the sample was rather balanced. In terms of age, the sample ranged from 20 to 67 years old, where the majority or the sample fell between 20 to 30 years old, making 45.6% of the sample.
In relation to Nationality, the sample turned out to be rather international and included representatives from the following countries: Portugal, Poland, Hungary, Ukraine, America, Britain, Georgia, Austria, Germany, Vietnam, Belarus, Russia, India, Latvia, Lithuania and Philippines. The number of participants per each country represented is demonstrated on the chart to follow (Figure 4). Some participants have marked their nationality as “white” or “Caucasian” that are demonstrated on the chart as “Not Specified” (Figure 4).
With regard to education level, the sample has been broken into three classes, where 13,6% (n=14) declared to have High-school education or lower, 50,5% (n=52) have declared to have completed a Bachelor's degree, and 35,9% (n=37) reported to have a Master's degree or higher level of education.
Concerning the management position at work, 28,2% (n=29) of respondents declared to execute a management function at their workplace.
Table 2 – Descriptive Statistics of the Sample
Classes Frequency (n) Percentage (%)
Age [20-30] 47 45.6 [31-40] 29 28.2 [41-59] 23 22.3 [=>60] 4 3.9 Education High-school or lower 14 13.6 Bachelor’s degree 52 50.5
Masters degree or higher 37 35.9
Frequency (n) Percentage (%)
Sex
Female 55 53.4
Design
The current study is considered to be non-experimental, as there is no manipulation of variables or the cause-effect relationship between them, but an empirical one, as it seeks to confirm a theory with hypotheses based on collected data, quantitative as the data has been collected with the help of a questionnaire, and correlational, as it seeks to investigate the correlation between presented variables. It is also an exploratory study, as it attempts to explore the reality that has not been widely studied yet, namely the impact of executing management position on the relationship between Psychological Flexibility and Individual Work Performance of an employee. Due to the data of the study being collected in one attempt this study is transversal, and explanatory, as it desires to present explanation for a determined reality.
Instruments
For this study a questionnaire consisting of two scales has been used (Annex A), one scale that measures Psychological Flexibility (WAAQ) and another - Individual Job Work Performance (IWPQ), as well as the socio-demographic data section, which was meant to characterize the sample in relation to age, sex, nationality, education level, leadership position, etc.
Psychological Flexibility
Psychological Flexibility has been measured through the Work-related Acceptance and Action questionnaire (WAAQ) designed by Bond, Lloyd and Guenole (2013). It is a seven-item self-report questionnaire that consists of one factor to measure Work-related Psychological Flexibility (α=.83), on a 7-point Likert scale, answer categories ranging from (1) “Never true” to (7) “Always true”. The total score of this scale may very between 7 and 49, where the higher the score the higher the level of Psychological Flexibility.
Considering the multi-nationality of the sample that was exposed to this questionnaire, this scale has been presented in its original language, in English (Table 3).
Table 3 – Work Acceptance and Action Questionnaire
1. I am able to work effectively in spite of any personal worries that I have 2. I can admit to my mistakes at work and still be successful
3. I can still work very effectively, even if I am nervous about something 4. Worries do not get in the way of my success
5. I can perform as required no matter how I feel 6. I can work effectively, even when I doubt myself 7. My thoughts and feelings do not get in the way of my work
Individual Work Performance
Koopmans (2014) adapted the original Individual Work Performance Questionnaire (IWPQ) to English language (Table 4). It is a self-report 18-item questionnaire that is designed to measure 3 factors (dimensions): Task Performance (α=.79), Contextual performance (α=.83), and Counterproductive Behavior (α=.89). All items are measured on a 5-point Likert rating scale from (1) - “Seldom” to (5) - “Always” for Task performance and Contextual performance, and (1) - “Never” to (5) - “Often” for counterproductive work behavior. Following the authors’ procedure, items in each dimension of the scale have been presented to participants in randomized order.
Contextual performance
In the past 3 months…
1. I took on extra responsibilities.
2. I started new tasks myself, when my old ones were finished. 3. I took on challenging work tasks, when available.
4. I worked at keeping my job knowledge up-to-date. 5. I worked at keeping my job skills up-to-date. 6. I came up with creative solutions to new problems. 7. I kept looking for new challenges in my job. 8. I actively participated in work meetings.
Counterproductive Behavior
In the past 3 months…
1. I complained about unimportant matters at work. 2. I made problems greater than they were at work.
3. I focused on the negative aspects of a work situation, instead of on the positive aspects. 4. I spoke with colleagues about the negative aspects of my work.
5. I spoke with people from outside the organization about the negative aspects of my work.
Management (Leadership) Position
In order to measure whether a respondent is executing a leadership position no specific instrument has been applied. It was decided to include a dichotomous question in the general questionnaire asking, “Are you executing a management function?” with a “yes” or “no” answer possible. In this paper the terms “leader” and “manager” are used interchangeably.
PROCEDURE
The collection of data was conducted through a questionnaire (Annex A) composed of the following scales: Work-related Acceptance and Action Questionnaire (WAAQ), Individual Work Performance Questionnaire (IWPQ) and the socio-demographic data section. This questionnaire has been created online through Google Forms platform with the goal of collecting voluntary replies. Online questionnaire helped collect diverse responses from individuals living in different countries and belonging to different nationalities.
The structure of the questionnaire followed the ensuing construction. At the beginning of the questionnaire was included a brief explanation of the goal of the study, it’s structure, information about the reason and the use for the study. It was also explained that the participants are able to stop their participation at any moment without any negative consequences and, if needed, reach out for more information through the email address provided. Before each part of the questionnaire there was included an explanation on how to answer the questions of the scale.
The collection of data lasted approximately two months. The data processing was done with the help of IBM SPSS Statistics 25 software. For this part, the variables were codified. The variable of Age was left uncodified, being expressed in numbers.
The non-numeric variables, such as Sex, Education level and Leadership position were converted into dummy variables, meaning they were converted into numeric variables. The Sex variable was converted in such a way, where male sex was given a value of “1”, and female of “2”. The Education level was converted as follows: High school or lower as “1”, Bachelor's degree as “2”, Master’s degree or higher as “3”. The Leadership position variable was also converted in such a way, where executing management position was given a value of “1”, and not
RESULTS
The first phase of results consisted of verification of metric qualities of the two scales used in the study, meaning the analysis of the sensitivity of items, factorial validity, reliability of dimensions and their sensitivity. These stages are described in detail below.
The Exploratory Factor Analysis (EFA) has been used to check the factorial validity, meaning the internal structure of the scales. The EFA has been chosen due to the internationality of the sample, as the scales of Psychological Flexibility and Individual Work Performance have only recently been adapted to some other cultures. Many of the adaptations do not exist for the nationalities represented in the sample.
The reliability of scales has been checked by testing the Cronbach's Alpha of the scales and their dimensions. The scale is considered to have a good internal consistency if its α is at least 0,70 (Marôco & Garcia-Marques, 2006). The Alpha has also been checked for the cases if one or more items had been eliminated.
In order to verify that all items are following the normal distribution the Skewness and Kurtosis of each were checked. The items were considered robust if they were not showing major deviation from normal distribution, namely Skewness level <|3| and level of Kurtosis <|8| (Kline, 2005).
Psychological Flexibility – Work-related Acceptance and Action Questionnaire (7 items)
Validity
Validity of the scale means to which degree the scale measures what it says it measures, or put simply how well the scale accomplishes its goal (Urbina, 2004). Even though the literature shows previous information about the WAAQ scale having only one factor, due to the internationality of the sample the Exploratory Factor Analysis has been conducted. The saturation for factor analysis has been set to 0,5 due to the small number of the sample (N=103). Such analysis has confirmed the uni-factorial structure of the scale with the total value of 4,279 and the % of total variance of 61,12% (Table 5, Annex C).
Table 5– Total Variance Explained of the WAAQ scale
Item Initial Eigenvalues Extraction Sums of Squared Loadings Total % of Variance Cumulative % Total % of Variance Cumulative %
1 4,279 61,129 61,129 4,279 61,129 61,129 2 ,858 12,255 73,385 3 ,576 8,228 81,612 4 ,412 5,890 87,503 5 ,364 5,195 92,697 6 ,312 4,462 97,159 7 ,199 2,841 100,000 Reliability
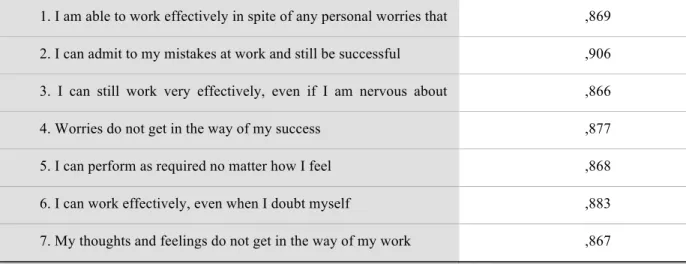
The reliability of the WAAQ scale has been tested by calculation of the Cronbach’s
Alpha. Since the scale only has one dimension, its internal consistency has been tested as a
whole. The scale presented with the coefficient Alpha of 0,89, which is a very good result (Table 6, Annex C). With the reduction of the item 2, the Alpha could have presented slightly better, but considering the low number of items in the scale to this point, it has been decided to not take the item out (Table 7, Annex C).
The results of the statistic analysis of the WAAQ scale are uniform to those of the authors, who have presented a uni-factorial, seven-item scale with the mean coefficient of Alpha
Table 7 - Reliability of the WAAQ scale if item deleted
Cronbach's Alpha if Item Deleted
1. I am able to work effectively in spite of any personal worries that I have
,869
2. I can admit to my mistakes at work and still be successful ,906
3. I can still work very effectively, even if I am nervous about something
,866
4. Worries do not get in the way of my success ,877
5. I can perform as required no matter how I feel ,868
6. I can work effectively, even when I doubt myself ,883
7. My thoughts and feelings do not get in the way of my work ,867
Sensitivity
At last, the sensitivity of the scale is the ability of the scale and its items to discriminate different participants according to the factors that are being evaluated. It was checked whether each item had replies in each of the categories and normal distribution through the index of Skewness and Kurtosis.
For the WAAQ scale measuring Psychological Flexibility all items had replies in each category ranging from (1) “Never true” to (7) “Always true”, aside from the item #2 that didn’t have a reply on the value of (1) “Never true”.
Regarding the Skewness and Kurtosis of the scale, no item has surpassed the normal distribution levels, namely Skewness level <|3| and level of Kurtosis <|8| (Kline, 2005), as can be visible in the Table 8 (Annex C). The negative scores of Skewness for all items lead us to believe that respondents tend to agree with the statements of the scale.
As mentioned previously, the item number 2 did not have replies in each category, however, the fact that the Skewness and Kurtosis of it was still within the limits of the acceptable values permitted to keep the item and not take it out of the scale (Table 8, Annex C).
Table 8 – Sensitivity of the Items of WAAQ scale
Skewness Kurtosis Minimum Maximum 1. I am able to work effectively in spite of any personal worries
that I have
-,739 -,158 1 7
2. I can admit to my mistakes at work and still be successful -1,339 2,785 2 7 3. I can still work very effectively, even if I am nervous about
something
-,774 ,141 1 7
4. Worries do not get in the way of my success -,682 -,093 1 7 5. I can perform as required no matter how I feel -,385 -,747 1 7 6. I can work effectively, even when I doubt myself -,557 ,029 1 7 7. My thoughts and feelings do not get in the way of my work -,324 -,372 1 7 Std. Error of Skewness = ,238; Std. Error of Kurtosis = ,472
Overall, good levels of Sensitivity of the Work-related Acceptance and Action scale have been observed and the results didn’t show deviation from normal distribution, namely Skewness level <|3| and level of Kurtosis <|8| (Kline, 2005) (Table 9, Annex C).
Table 9 – General Sensitivity of the Psychological Flexibility Scale
N Minimum Maximum Mean Variance Skewness Kurtosis
PF 103 1.86 7.00 4.9320 1.101 -.635 -.111
Individual Work Performance Scale – IWPQ (18 items)
The same procedure has been followed with the IWPQ scale in order to test it for the Validity, Reliability and Sensitivity levels.
Validity
The Validity of the scale and each of it dimensions has been tested to see whether the scale indeed measures what it is supposed to measure. Literature shows that the structure of the scale presents 3 dimensions (Koopmans et a., 2014), however Exploratory Factor Analysis has been selected to verify the validity of the scale due to the variety of nationalities of the sample, as it has not been verified for many of the nationalities represented. The authors specified 3 dimensions as the following: Task Performance (items 1, 2, 3, 4, 5), Contextual Performance (items 6, 7, 8, 9, 10, 11, 12, 13), and Counterproductive Behavior (items 14, 15, 16, 17, 18).
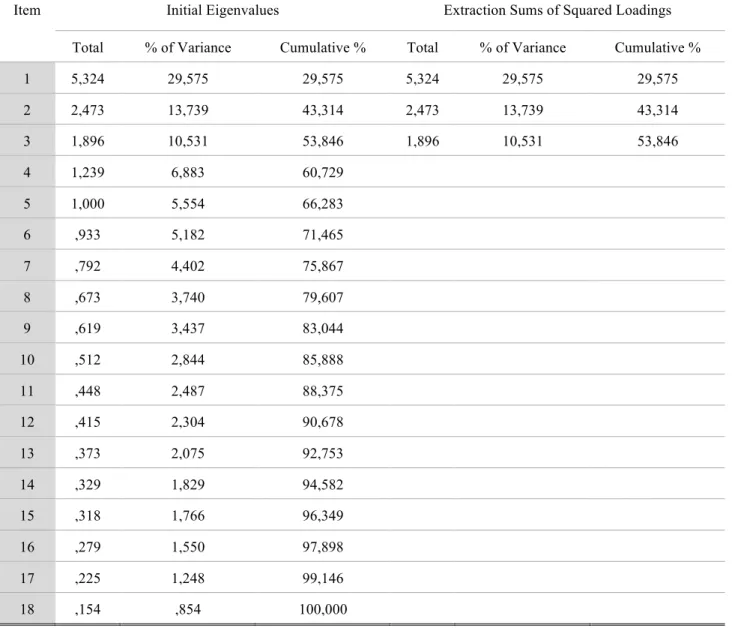
The Exploratory Factor Analysis showed that in the case of this study the scale also had 3 possible components, with total variance of 9,693 and the percent of explained variance at 53,846% (Table 10, Annex D)
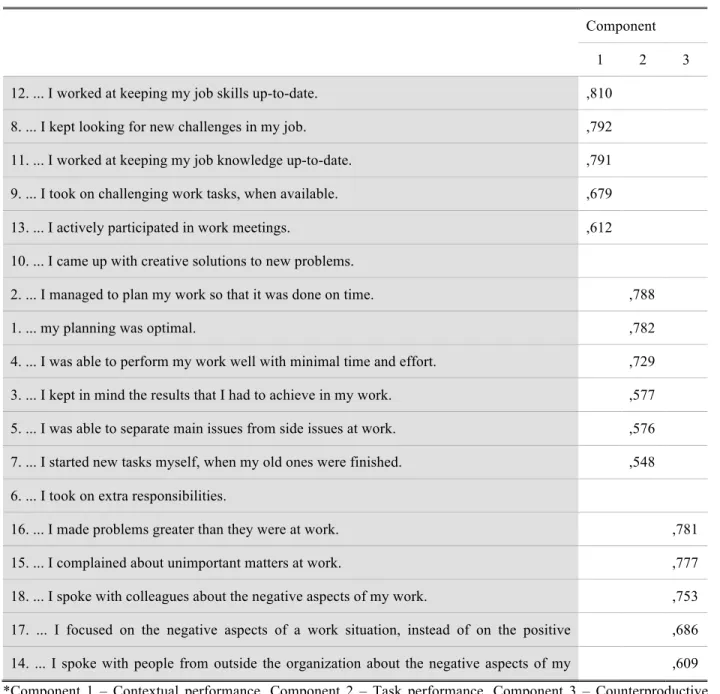
The component analysis for the 3 dimensions of the scale had shown the value of each item in each dimension (Table 11, Annex D). As with the scale measuring Psychological Flexibility, the factorial value for the IWPQ scale has been chosen to be 0,5 due to the small number of the sample (N=103). With that criteria the items 6 and 10 have been eliminated from the scale due to their saturation being inferior to 0,5.
The statistical findings for the validity of the IWPQ scale were uniform to the original structure proposed by the authors (Koopmans et al., 2014).
Table 10 – Total variance explained for the IWPQ scale
Item Initial Eigenvalues Extraction Sums of Squared Loadings Total % of Variance Cumulative % Total % of Variance Cumulative %
1 5,324 29,575 29,575 5,324 29,575 29,575 2 2,473 13,739 43,314 2,473 13,739 43,314 3 1,896 10,531 53,846 1,896 10,531 53,846 4 1,239 6,883 60,729 5 1,000 5,554 66,283 6 ,933 5,182 71,465 7 ,792 4,402 75,867 8 ,673 3,740 79,607 9 ,619 3,437 83,044 10 ,512 2,844 85,888 11 ,448 2,487 88,375 12 ,415 2,304 90,678 13 ,373 2,075 92,753 14 ,329 1,829 94,582 15 ,318 1,766 96,349 16 ,279 1,550 97,898 17 ,225 1,248 99,146 18 ,154 ,854 100,000
Table 11- Rotated Component Matrix of IWPQ scale
Component 1 2 3 12. ... I worked at keeping my job skills up-to-date. ,810 8. ... I kept looking for new challenges in my job. ,792 11. ... I worked at keeping my job knowledge up-to-date. ,791 9. ... I took on challenging work tasks, when available. ,679 13. ... I actively participated in work meetings. ,612 10. ... I came up with creative solutions to new problems. 2. ... I managed to plan my work so that it was done on time. ,788
1. ... my planning was optimal. ,782
4. ... I was able to perform my work well with minimal time and effort. ,729 3. ... I kept in mind the results that I had to achieve in my work. ,577 5. ... I was able to separate main issues from side issues at work. ,576 7. ... I started new tasks myself, when my old ones were finished. ,548
6. ... I took on extra responsibilities.
16. ... I made problems greater than they were at work. ,781 15. ... I complained about unimportant matters at work. ,777 18. ... I spoke with colleagues about the negative aspects of my work. ,753 17. ... I focused on the negative aspects of a work situation, instead of on the positive
aspects.
,686 14. ... I spoke with people from outside the organization about the negative aspects of my
work.
,609 *Component 1 – Contextual performance, Component 2 – Task performance, Component 3 – Counterproductive behavior.
Reliability
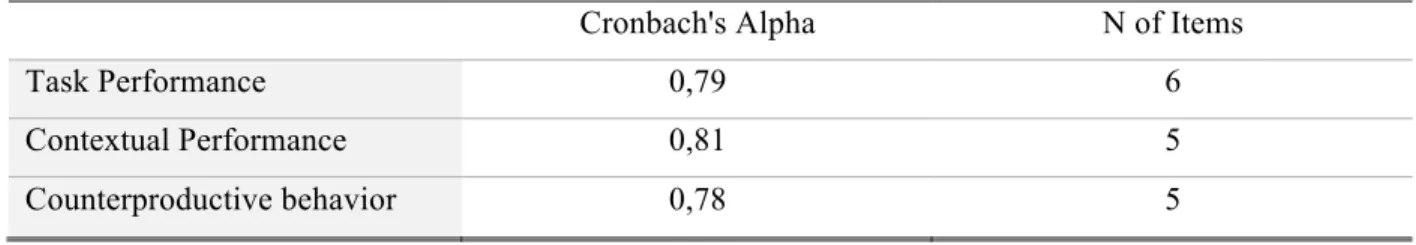
A test of Cronbach’s Alpha has been used to measure the reliability of each dimension of the scale, showing the following results: the dimension of Task Performance α=0,79, dimension of Contextual Performance α=0,81, and dimension of Counterproductive behavior α=0,78 (Table 12, Annex D).
Table 12 – Cronbach’s Alpha of the IWPQ scale and its dimensions
Cronbach's Alpha N of Items
Task Performance 0,79 6
Contextual Performance 0,81 5
Counterproductive behavior 0,78 5
The value of the general Alpha for the scale after the item 6 and 10 have been removed dropped to the coefficient α=0,69 (Annex D). Taking out one of the items could increase the alpha to show the value surpassing 0,7, however, it would not bring significant gain (Annex D). Considering the good values of Alpha for each dimension individually (Table 12, Annex D), it has been decided to keep all remaining 16 items in the scale.
After that, the reliability of each dimension of the scale if item was deleted has been checked. The following table represents the reliability of each dimension of the IWPQ scale had one of the items been deleted (Table 13, Annex D).
Table 13 – Reliability of IWPQ dimensions if item was deleted Contextual performance
In the past 3 months…
Alpha if Item Deleted
8. ... I kept looking for new challenges in my job. ,738 9. ... I took on challenging work tasks, when available. ,766 11. ... I worked at keeping my job knowledge up-to-date. ,781 12. ... I worked at keeping my job skills up-to-date. ,759 13. ... I actively participated in work meetings. ,817
Task performance
In the past 3 months…
Alpha if Item Deleted
1. ... my planning was optimal. ,761
2. ... I managed to plan my work so that it was done on time. ,747 3. ... I kept in mind the results that I had to achieve in my work. ,783 4. ... I was able to perform my work well with minimal time and effort. ,751 5. ... I was able to separate main issues from side issues at work. ,768 7. ... I started new tasks myself, when my old ones were finished. ,792
Counterproductive Work behavior
In the past 3 months… Alpha if Item
Deleted 14. ... I spoke with people from outside the organization about the negative aspects of my
work.
,776 15. ... I complained about unimportant matters at work. ,712 16. ... I made problems greater than they were at work. ,720 17. ... I focused on the negative aspects of a work situation, instead of on the positive
aspects.
,744 18. ... I spoke with colleagues about the negative aspects of my work. ,740
Sensitivity
The Individual Work Performance scale when checked for the presence of replies in each category showed, that all items have answers in the categories raging from (1) - “Seldom” to (5) - “Always”, and (1) - “Never” to (5) - “Often”, depending on the item. Only the item #11 didn’t have a response in the category of (1) – “Seldom”.
With regards to the criterion of normal distribution, it was visible that the values are satisfactory, being that none of the items had surpassed the allowed values of (<|3|) for Skewness and (<|8|) for Kurtosis (Kline, 2005) (Table 14, Annex D).
Table 14 – Sensitivity of Items of IWPQ Scale
Item N Min Max Mean Deviation Std. Variance Skewness Kurtosis
1 103 1 5 3.59 .933 .871 -.569 .347 2. 103 1 5 3.90 1.034 1.069 -.888 .347 3 103 1 5 4.29 .749 .561 -1.535 4.147 4 103 1 5 3.56 .977 .954 -.567 -.014 5 103 1 5 3.97 .902 .813 -.842 .551 7 103 1 5 3.78 1.154 1.332 -1.033 .463 8 103 1 5 3.76 1.116 1.244 -.800 -.002 9 103 1 5 3.88 1.069 1.143 -.941 .593 11 103 2 5 4.08 .801 .641 -.609 -.019
Separately, the sensitivity of Contextual performance, Task Performance, and Counterproductive Work behavior dimension has been tested as well (Table 15, Annex D).
Table 15 – Sensitivity of IWPQ Dimensions
Contextual Performance
N Minimum Maximum Mean Variance Skewness Kurtosis
CP 103 1.40 5.00 3.9262 .584 -.901 1.012
Valid N
(listwise)
103
Std. Error of Skewness = ,238; Std. Error of Kurtosis = ,472; Std. Deviation = .76389
Std. Error of Skewness = ,238; Std. Error of Kurtosis = ,472; Std. Deviation = .68182
Furthermore, it was visible that the items corresponding Task and Contextual performance are on the negative, which leads to the belief that respondents tended to agree with the statements of the scale.
Considering that all items have showed satisfactory results for the Skewness and Kurtosis values (<|3| and <|8| respectively, (Kline, 2005)), the item 11 has been kept in the sale, even though it did not pass the criterion of variability. Taken as a whole, the scale’s dimensions have presented good levels of Sensitivity.
Task Performance
N Minimum Maximum Mean Variance Skewness Kurtosis
TP 103 1.50 5.00 3.8495 .465 -1.021 1.513
Valid N (listwise)
103
Counterproductive Work Behavior
N Minimum Maximum Mean Variance Skewness Kurtosis
CWB 103 1.00 4.60 2.4796 .619 .207 -.214
Valid N (listwise)
103
Impact of demographic variables on Psychological Flexibility
After testing the metric qualities of the two scales used in the study, the relationship between the demographic variables and Psychological Flexibility has been investigated. With the use of different statistical tests (depending on the variable) the relationship between Psychological Flexibility and Age, Sex, Education level, and executing Leadership position has been explored and can be seen on the table below (Table 16, Annex E).
Table 16 – Effect of Demographic Variables on Psychological Flexibility
Correlation p r
Age .003* .286
Education level .608
t-student test results t p Mean Feminine Mean Masculine
Sex -1.409 .073 5.0675 4.7768
t p Mean Leader Mean Non-Leader
Leadership Position 2.405 .000* 5.3201 4.7799
* p<0,01
The Pearson Correlation test has been used to investigate the relationship between Age and Psychological Flexibility. Contrary to the findings of the authors (Bond, Lloyd & Guenole, 2013) there has been found a significant positive correlation between Age and Psychological