www.scielo.br/rbg
CONSIDERATIONS ON THE APPLICATION OF THE MAGNETOTELLURIC METHOD
WITH NUMERIC MODELING FOR EXPLORATION OF BASINS CONTAINING MAFIC SILLS:
THE EXAMPLE OF THE SOLIM ˜
OES UPPER AMAZON BASIN
Marcos Ka´ıre Miguel Sobrinho
1and L´ucia Maria da Costa e Silva
2ABSTRACT.The use of the magnetotelluric method (MT) in Brazil has been predominantly focused on understanding large geological structures. In the 80’s the method began to be used in petroleum exploration. Early results have been considered unsatisfactory. We modeled the MT response for the geology of the Solim˜oes Upper Amazon Basin, one of the first basins where the MT method was applied in Brazil, and basalts sills are common, to show its difference in comparison with the seismic section. The synthetic seismic section obtained for the Solim˜oes Basin allows observation of the shallow diabase sill only. However, for MT, the presence of the sill, especially if it is slightly magnetic, increases the depth of investigation possible, or allows the MT method at the very least to investigate the basement better than is possible with the seismic method.
Keywords: magnetotelluric, MT, Solim˜oes Basin, diabase sill, modeling, a priori information.
RESUMO.O uso do m´etodo magnetotel´urico (MT) no Brasil tem sido predominantemente focado na compreens˜ao de grandes estruturas geol´ogicas. Nos anos 80, o m´etodo comec¸ou a ser usado na explorac¸˜ao de petr´oleo. Os primeiros resultados foram considerados insatisfat´orios. Modelamos a resposta MT para a geologia da Bacia do Solim˜oes, uma das primeiras bacias onde o m´etodo MT foi aplicado no Brasil, e soleiras de diab´asio s˜ao comuns, para comparac¸˜ao com a sec¸˜ao s´ısmica modelada para o mesmo local. A sec¸˜ao s´ısmica sint´etica obtida para a Bacia do Solim˜oes permite a observac¸˜ao apenas da soleira de diab´asio mais rasa. Entretanto, para o MT, a presenc¸a da soleira, especialmente se ela ´e ligeiramente magn´etica, aumenta a profundidade de investigac¸˜ao poss´ıvel, ou ao menos permite que o m´etodo MT investigue o embasamento melhor do que ´e poss´ıvel com a sec¸˜ao s´ısmica.
Palavras-chave: magnetotel´urico, MT, Bacia do Solim˜oes, soleira de diab´asio, modelagem, informac¸˜ao a priori.
1In memoriam.
1,2Universidade Federal do Par´a, Faculdade de Geof´ısica, Instituto de Geociˆencias / Servic¸o Geol´ogico do Brasil (CPRM – Geological Survey of Brazil), Av. Dr. Freitas, 3645, Marco, 66095-904 Bel´em, PA, Brazil – E-mail: [email protected]
INTRODUCTION
The magnetotelluric method (MT), and its many variants are based on obtaining, by means of electrical and magnetic field compo-nents, the resistivity (and the phase between fields) for depths of about tens of meters to one hundred kilometers (Rokityan-sky, 1982; Berdichevsky & Zhdanov, 1984; Vozoff, 1991; Tezkan, 1999; Berdichevsky & Dmitriev, 2002; Simpson & Bahr, 2005; Berdichevsky & Dmitriev, 2008; Chave & Jones, 2012). Its ap-plication is therefore very broad, ranging from the investigation of waste deposit (Tezkan et al., 1996), oil-contaminated areas (Tezkan et al., 2005), underground water (Turberg et al., 1994; Tezkan, 2009), ore minerals (Varentsov et al., 2013), oil (Vozoff, 1972), tectonic provinces (Van Zyl, 1977 and 1978) to the inves-tigation of the asthenosphere (Praus et al., 1990).
The use of the method in Brazil has been predominantly used on understanding large geological structures (works from Instituto Nacional de Pesquisas Espaciais – INPE – and Ob-servat´orio Nacional – ON). However, the use of MT in Brazil started with oil exploration with the measurements of Hidro-service in the 80’s (450 MT-stations in S˜ao Paulo State for Paulista Petr´oleo – PAULIPETRO – from May 1981 to November 1983, and 35 MT-stations in the Solim˜oes Upper Amazon Basin for Petr´oleo Brasileiro – PETROBRAS – from February to August 1983) (Hidroservice, 2015).
The use of MT for oil&gas exploration has increased in re-cent years. Projects related to oil&gas exploration onshore were carried out in the Paran´a Basin (Menezes & Travassos, 2010; Philipp et al., 2014) and S˜ao Francisco Basins (de Lug˜ao et al., 2013), and the National Petroleum Agency of Brazil (ANP) con-tracted large MT acquisition projects in the Parecis and Paran´a Basins (Vital et al., 2014; Taveira et al., 2014). Offshore, a first MT survey was acquired in the Santos Basin (de Lug˜ao et al., 2008; Pinto, 2009). Mineral exploration have also been carried out – kimberlite exploration (La Terra, 2011) and others. The method, however, still sees relatively modest use, especially to the inves-tigation of hydrocarbons.
Early MT results focused on oil exploration in Brazil have been considered unsatisfactory, such as those obtained in the Rio Jurua region of the Solim˜oes Basin of the Amazon (Porsani, 1991) and in the Espirito Santo Basin (Jos´e, 2005). What are the sources of the possible shortcomings, in the case of MT? Here we explore one possible scenario.
In oil and gas exploration it is common to find magmatic in-trusions (diabase sills and basaltic flows), carbonato cover and salt domes. Seismic explorations provide invaluable results for oil exploration, but they have great difficulty imagining below
these materials due to their high acoustic impedance (high seis-mic velocity and high density), which affects the propagation of seismic waves to deeper parts of the basin (Wanderley Filho et al., 2005). In other words, magmatic intrusions, carbonato cover and salt domes reflect and scatter seismic signals, masking the characteristics of the underlying structure. However, these targets have high resistivity.
Electromagnetic methods, among which MT stands out, in contrast, are insensitive to the highly electrically resistive mag-matic intrusions, carbonato cover and salt domes. However, it is strongly influenced by the underlying sedimentar basin, which is electrically conductive. Electromagnetic soundings are therefore a valuable compliment to seismic surveys in such areas, provid-ing information which may be interpreted independently or which may be used to constrain parameters in the interpretation of seis-mic data (Menezes & Travassos, 2010). Moreover, this type of intrusion is slightly magnetic and this is always overlooked (Li & Cao, 2005).
In this paper, seismic and MT synthetic results for an area of the oil province of S˜ao Mateus in the Solim˜oes Basin (Ama-zon), a region rich in diabase sills, are used to illustrate the type of responses of the two methods. The MT response taking into consideration the sill magnetism is also investigates, in order to evaluate the convention of neglecting this feature in MT investi-gations. Delimiting diabase sills is important because they sup-ply heat for organic matter maturation in all Brazilian Paleozoic basins, and also can prevente oil or gas to get to surface (trap).
THE SOLIM ˜OES BASIN
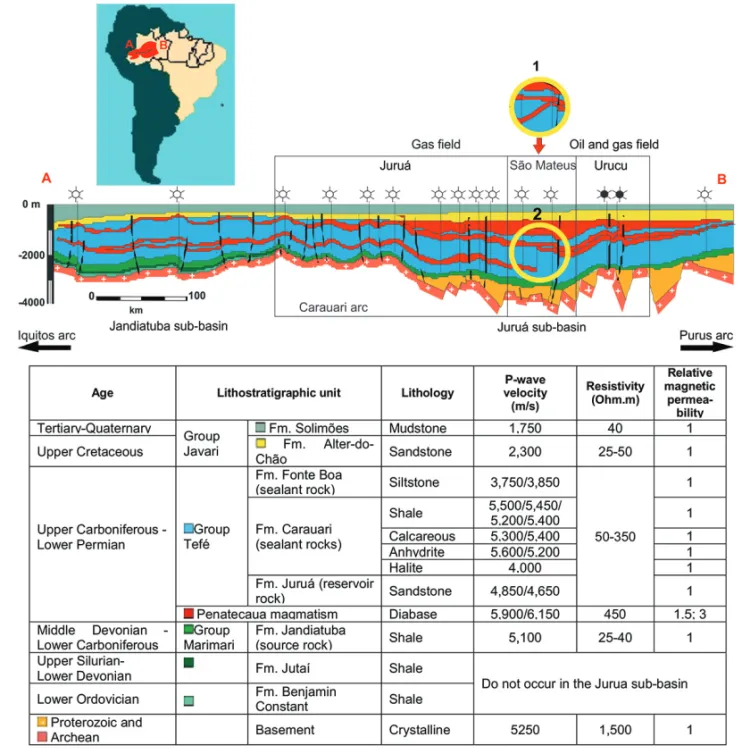
The Solim˜oes basin includes the oil and gas producing province Uruc´u and the gas producing provinces of Juru´a and S˜ao Mateus in Amazonas State (Brazil) (Fig. 1).
The main generator is the radioactive Devonian shale of the Jandiatuba Formation, whose maximum thickness is 50 meters. Producing reservoirs are Carboniferous sandstone capped by evaporites, which are also Carboniferous. The geological traps are, in general, structural (anticlines associated with reverse faults related to an extensive shear zone) (Eiras, 1988; Eiras et al., 1994). This basin is important in the Brazilian oil scenario, as it is the only Brazilian Paleozoic basin with commercial hydrocarbon production. The state is the third largest producer of natural gas (10.8%) and the seventh producer of oil (0.4%) in the country (ANP, 2016).
Wells have been drilled in the basin, but due to the abundance of diabase sills, there are still exploration challenges. Figure 1 shows two different types of structures that are found in the basin.
Figure 1 – Location of the Solim˜oes Basin (red) in South America and corresponding geological section (with seismic velocity, resistivity and
relative magnetic permeability) highlighting the province of S˜ao Mateus: 1) bifurcated model and 2) fault model (modified from Eiras, 1998 and Wanderley Filho et al., 2005).
Structure 1 is a bifurcated structure and structure 2 is a dip-slip fault structure (currently accepted for the S˜ao Mateus Province).
SEISMIC MODELING
The seismic model was constructed with 11 layers of sedimentary rock and 4 bases of diabase, in addition to the top of the base-ment, a depth of 2,640 m as schown in Figure 2(a). Thicknesses were based on Eiras et al. (1994), as well as velocities (shown on Fig. 1). The model contains both structures 1 and 2. More details on this seismic model are described by Nazar´e (2004, 2007) and Nazar´e et al. (2005).
The modeling was performed by obtaining the solution of the acoustic wave equation using the finite differences program described by (Silva Neto, 2004), for a mesh with 4001 horizontal and 701 vertical points, with each cell measuring 5 m× 5 m.
The synthetic data were generated along a 20,000 m seis-mic line using a symmetrical split-spread arrangement. The first and last sources were placed at the 3,600 m and 16,400 m coor-dinates, respectively. The distance between consecutive sources was 100 m, with 129 sections of common shot configuration being generated. Each experiment used 145 receivers spaced at 50 m, with 2 s used as total recording time.
Figure 2 – Seismic modeling. a) Velocity model (m/s) with 1) bifurcated structure and 2) fault structure.
b) Raw zero-offset section showing interpretation of the sills (solid red line) (bifurcated model).
Figure 2(b) shows the zero-offset section (Nazar´e, 2004; Nazar´e et al., 2005). It was processed by the conventional method of common midpoint stacking (CMP). The result obtained does not permit observation below the first sills (bifurcated structures), because of considerable signal loss.
MT MODELING
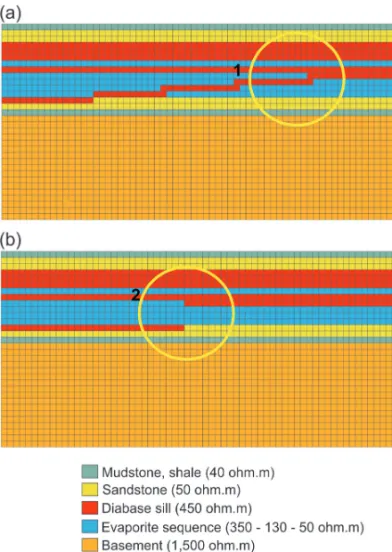
The geological section of the province of S˜ao Mateus between the STM1 and STM2 wells (Fig. 1) was redesigned with the same horizontal and vertical scales. The section was then discretized, resulting in a mesh with 64 horizontal and 32 vertical cells, with each cell measuring 200 m × 200 m (12,800 m length and 6,400 m depth). One section represented the structure 1 (diabase sill bifurcation) and another, the structure 2 (strike-slip dip
struc-ture). Both models contain 10 layers, with 5 lithologies with dif-ferent values of resistivity, as shown in Figure 3.
Thirty stations were positioned at each node of the mesh. To consider the boundary conditions, we increased the lateral and depth limits of the mesh of the model by 5 cells, with increasing dimensions.
An enhanced version of the finite element program developed by Dr. Luiz Rijo was used (Rijo, 1977) to calculate the MT re-sponses of the models for periods of 1 to 0.0002 s of the electro-magnetic spectrum.
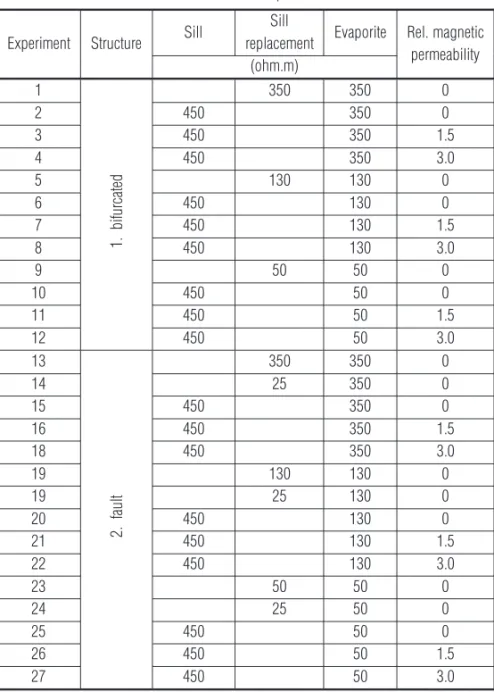
The experiments were performed with the diabase sill with resistivity equal 400 ohm.m and relative magnetic permeability equal to 1 (air, also non magnetic), 1.5 and 3 and also with the diabase replaced by evaporite sequence with a resistivity of 350,
130, and 50 ohm.m for comparison with the results obtained with the diabase. It was investigated the bifurcated structure and the fault structure. In total, 27 experiments were carried out (Table 1).
Figure 3 – MT modeling. Resistivity model with: a) bifurcated model
(struc-ture 1) and b) strike-slip fault (struc(struc-ture 2).
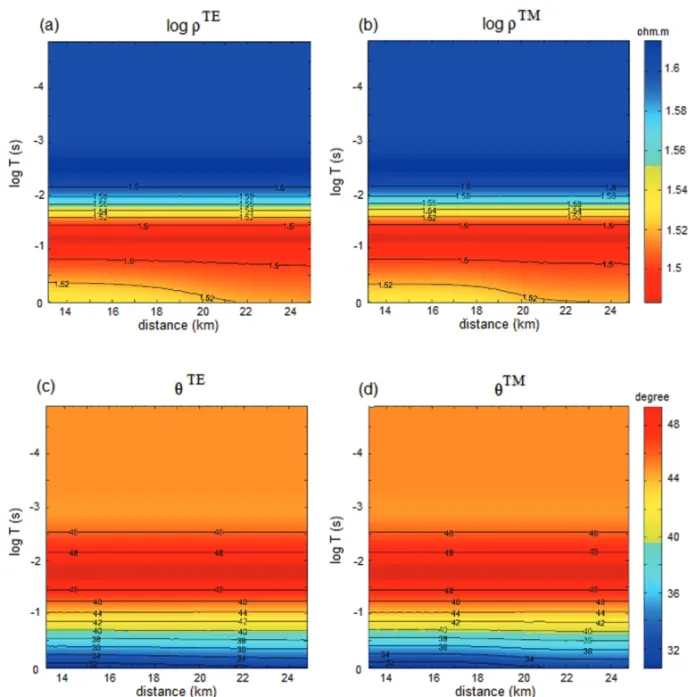
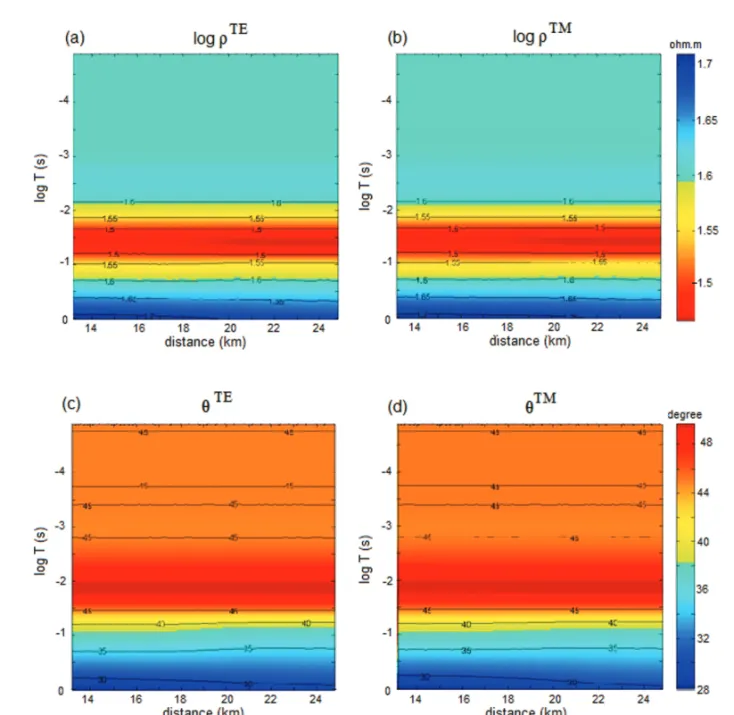
Figures 4 to 9 show some pseudo-sections. The positions of the MT stations appear in the abscissa and the logarithm of of the period, on the ordinates. The logarithm of the periods in-creases with the depth, such that the pseudo-section reflects the increase in depth. The isovalues of the logarithm of apparent re-sistivityρaare shown in color and increase from red to blue, while the isovalues of the phaseθ, increase from blue to red. Thus, for a conductive body, apparent resistivity and phase move into the red, while for a resistive body, such as the sill and the basement, move into the blue. The pseudo-sections to the left ofρaandθ were obtained with the TE mode, while those to the right were ac-quired using the TM mode. In the TE mode, telluric currents flow in the y direction, perpendicular to the plane shown in Figure 1 (i.e., along the direction of the layers). In the TM mode, telluric currents flow in the direction of the stations’ profile, (i.e., perpen-dicular to the sill).
Figures 4 and 5 show the results for the fault model with the sill replaced by the 50 ohm.m evaporite sequence and with the
450 ohm.m diabase sill in a 50 ohm.m evaporate sequence, re-spectively (experiments 23 and 25, Table 1). Figure 6, in turn, shows the responses that would be obtained with the same sill if it were magnetic (relative magnetic permeability equal to 3) (experiment 27, Table 1).
In Figure 4, the resistivity in both the TE and TM modes de-creases with increase in the period (increase with depth), thus the effect of the resistive basement is not noticeable. In fact, the basement is found at a depth of 3 km and the skin depth for a section with basement under an evaporite sequence of 50 ohm.m is about 3.6 km, since the sequence has resistivities of up to 25 ohm.m (sandstone), which further reduces the skin depth. The experiment was, in fact, planned so that the basement is near the end portion of the pseudo-sections of apparent resistivity. The phases in Figure 4 detect the basement, but it is known that the phase enables somewhat deeper investigation than the apparent resistivity.
Comparison of the results of Figure 5, generated without the diabase, with those of Figure 6, obtained with the diabase present, shows that the apparent resistivity grows as the phase decreases for the largest periods (lower portion of pseudo-sections). As the diabase is less conductive than the evaporite, it allows smaller absorption of the electromagnetic wave and therefore larger pen-etration of the field (larger skin depth).
Consequently, a greater contribution is observed in the re-sponse of the basement when there are sills. The package of con-ductive sediments with the sill will form a single, more compact zone. Thus, with the presence of diabase it becomes easier to detect the basement relief.
In the responses to the magnetic diabase of Figure 6, there is an increase in apparent resistivity of the base section, indicat-ing a greater effect of the basement. In fact, it is expected that permeability attenuates the field, thereby reducing the penetra-tion (reducpenetra-tion of the skin depth). The phase, as Li & Cao (2005) reported, sustains minor change.
The results show that the presence of a shallow resistive layer, the sill, allows for greater penetration of the EM signal and imaging of the basement.
The responses shown in Figures 7, 8 and 9 for the bifurcated model (experiments 9, 10 and 12, Table 1) are analogous to those shown respectively in Figures 4, 5 and 6 for the fault model, es-pecially in the case of the magnetic sill. Only the results TE are shown for the bifurcated model because, as shown in the pre-vious pseudo-sections, the response is essentially one dimen-sion (the biggest differences are observed with the sill replaced by 25 ohm.m sandstone or shale and the evaporite sequence with
Table 1 – Main MT experiments.
Experiment Structure Sill
Sill
Evaporite Rel. magnetic
replacement permeability (ohm.m) 1 1. bi fu rcat ed 350 350 0 2 450 350 0 3 450 350 1.5 4 450 350 3.0 5 130 130 0 6 450 130 0 7 450 130 1.5 8 450 130 3.0 9 50 50 0 10 450 50 0 11 450 50 1.5 12 450 50 3.0 13 2. fa ul t 350 350 0 14 25 350 0 15 450 350 0 16 450 350 1.5 18 450 350 3.0 19 130 130 0 19 25 130 0 20 450 130 0 21 450 130 1.5 22 450 130 3.0 23 50 50 0 24 25 50 0 25 450 50 0 26 450 50 1.5 27 450 50 3.0
350 and 130 ohm.m resistivity – experiments 14 and 19, Table 1). Comparison of the results generated for the bifurcated sill with those for the fault model show differences. The sill, although it does not appear separately, can probably not only be detected, but also outlined (although the responses shown are those with the greatest variability), which will be dealt with later.
CONCLUSIONS AND CONSIDERATIONS
The synthetic P-wave seismic section obtained for the Solim˜oes Basin allows observation of the most shallow diabase sill only. For MT, on the contrary, the presence of the sill, especially if it is slightly magnetic, increases the depth of investigation, or allows the MT at the very least to investigate the basement better than the seismic section (the phase also enables somewhat deeper
in-vestigation than the apparent resistivity, detecting the basement). This provides a new interpretation idea to deal with MT data from areas with magnetic units.
The resolution, also the shorter distance from which two dis-tinct features are perceived separately (rather than being seen as only a single feature), of the MT section is inferior to that of the seismic section, because, as ohmic dissipation limits the penetration of high frequency EM waves, the MT method uses low frequency electromagnetic waves, which are governed by the diffusion equation.
As a consequence of the above-mentioned problems, the user-friendliness and usability that are characteristics of the re-sults of the methods, and act as the interface between the inter-preter and the geophysical method, are inferior with MT sections, when compared to the seismic method.
Figure 4 – Fault model with the position of the sill replaced by evaporite sequence of 50 ohm.m. Apparent resistivity mode (a) TE and
(b) TM. Phase mode (c) TE and (d) TM.
It is not possible to interpret the pseudo-sections obtained by MT geologically, as is done with the seismic method, without us-ing either forward or inverse interpretation methods. Interpretation enables arriving at probable physical models and these, indeed, being close approximations of the geology of the area, are quite user-friendly and useful. Only with interpretation is it possible to reach individuation of the diabase sill and attempt to individuate between the bifurcated sill and the fault.
With the forward method, the interpreter provides the physical parameters of a pre-established model based on the real geology, and a mathematical formulation allows synthetic measurements to be obtained with them, which the interpreter compares with the field measurements. If synthetic and real measurements are
sim-ilar, the model can be considered as one of the many possible models that would fit the observed measurements. If not, new pa-rameters are given and the process repeated until an acceptable adjustment between the measures is found. The result is always linked with the real geology.
The inversion method is a rigorous, mathematical way to find the best model and parameters that fit the real measurements, so it’s less painstaking, but its results are somewhat dependent on the a priori information (mathematical relationships) established in one or more stabilizing functionals, which describe the geology (also known as geological functionals) (Silva et al., 2001).
However, describe the geology in terms of mathematical rela-tionships (geological funcionals) is a difficult task of geophysics.
Figure 5 – Fault model with the 450 ohm.m sill. Evaporite sequence: 50 ohm.m. Apparent resistivity model (a) TE and (b) TM. Phase mode (c) TE and (d) TM.
Consequently, almost all of the inversion algorithms reveal some inadequacy with regards to accurately depicting the real environ-ment, often to a very large degree.
In the early stage, due to the inherent lower resolution of MT compared to seismic and the use of 1-D model interpretations, MT was not suitable for imaging structures in geologically com-plicated areas. Rather MT was just used in imaging the depth to basement in basins.
By other hand, the most used relationship is smoothness, which when translated geologically means that in the subsur-face physical properties must be equal among neighboring zones, hence the transition between units, ore bodies, etc. are extremely smooth interfaces. The result is unfocussed geological models, of limited usability. Therefore, the best interpretations use the
in-version method and then return to the forward method, where the interpreter at last has the freedom to introduce information that would not be provided by the inversion method only (Jones et al., 2015). It is only very recently that attention has turned to these relationships, i.e. to consider abrupt geological interfaces, for ex-ample (Costa & Silva, 2006).
The main finding of this study is that there are signals of in-terest in the MT responses generated by the studied models.
ACKNOWLEDGEMENTS
To Prof. Dr. German Garabito and Priscilla Nazareth for the seismic data and rewarding exchange of ideas. To Professor Dr. Luiz Rijo (in memoriam) for the use of his program and data discussion on magnetic permeability values.
Figure 6 – Fault model with the 450 ohm.m sill, magnetic (relative magnetic permeability= 3). Evaporite sequence: 50 ohm.m.
Apparent resistivity mode (a) TE and (b) TM; Phase mode (c) TE and (d) TM.
Figure 8 – Bifurcated model with the 450 ohm.m sill. Evaporite sequence: 50 ohm.m. (a) Apparent resistivity and (b) Phase mode TE.
Figure 9 – Bifurcated model with the 450 ohm.m sill, magnetic (relative magnetic permeability= 3). Evaporite sequence:
50 ohm.m. (a) Apparent resistivity and (b) Phase mode TE.
REFERENCES
ANP. 2016. Anu´ario Estat´ıstico Brasileiro do Petr´oleo, G´as Natural e Biocombust´ıveis. ANP. Rio de Janeiro, Brazil. 264 pp.
BERDICHEVSKY MN & DMITRIEV VI. 2002. Magnetotellurics in the context of the theory of ill-posed problems. SEG, Tulsa. v. 11. 215 pp. (Investigations in Geophysics).
BERDICHEVSKY MN & DMITRIEV VI. 2008. Models and Methos of Magnetotellurics. Springer, Berlin. 382 pp.
BERDICHEVSKY MN & ZHDANOV MS. 1984. Advanced theory of deep geomagnetic sounding. Elsevier, Amsterdam. 408 pp.
COSTA E SILVA LM. 2006. DesG: Uma nova metodologia para invers˜ao e coleta de dados magnetotel´uricos. Doctor Thesis on Geophysics – Uni-versidade Federal do Par´a, Brazil. 183 pp.
CHAVE AD & JONES AG. 2012. The Magnetotelluric Method. Theory and Practice. Cambridge University Press, Cambridge. 570 pp. DE LUG˜AO P, FONTES SL, LA TERRA EF, ZERILLI A, LABRUZZO T & BUONORA P. 2008. First Application of Marine Magnetotellurics Im-proves Depth Imaging in the Santos Basin, Brazil. In: 70th EAGE Confer-ence & Exhibition, Rome, paper P192.
DE LUG˜AO P, SENDEROWITZ S, MENEZES A, NUNES D, GUARAGNA I, PASTANA A & BRAGA B. 2013. A Multiclient Magnetotelluric Survey on the Proterozoic S˜ao Francisco Basin to Aid the Exploration for Oil & Gas. In: 75th EAGE Conference & Exhibition incorporating SPE EUROPEC, London, paper Th-P07-06.
EIRAS JF. 1998. Tectˆonica, sedimentac¸˜ao e sistemas petrol´ıferos da Ba-cia do Solim˜oes, Estado do Amazonas. In: TAHA M (Ed.). Searching for Oil and Gas in the Land of Giants. The Search Magazine, Edic¸˜ao Especial sobre o Brasil. Argentina: Schlumberger.
EIRAS JF, BECKER CR, SOUZA EM, GONZAGA FG, DA SILVA JGF, DANIEL LMF, MATSUDA NS & FEIJ ´O FJ. 1994. Bacia do Solim˜oes. Boletim de Geociˆencias da Petrobras, 8(1): 17–45.
HIDROSERVICE. 2015. Trabalhos Hidroservice – Consulta por Pa´ıs.
Available on: <http://www.hidroservice.com.br/trabalho/index.htm>.
Acess on: September 30, 2015.
JONES AG, LEDO J & FERGUSON IJ. 2005. Electromagnetic images of the Trans-Hudson orogen: the North American Central Plains anomaly revealed. Canadian Journal of Earth Sciences, 42: 457–478.
JOS´E SA. 2005. Modelagens magnetotel´urica e s´ısmica na bacia do Esp´ırito Santo. Master Dissertation on Geophysics – Universidade Es-tadual do Norte Fluminense, Rio de Janeiro, Brazil. 149 pp.
LA TERRA EF. 2011. Interpretac¸˜ao 3D integrada do pipe kimberl´ıtico R´egis (MG). Doctor Thesis on Geophysics – Observat´orio Nacional, Rio de Janeiro, Brazil. 80 pp.
LI X & CAO J. 2005. A study of the influence of magnetic susceptibility on MT response. Chinese Journal of Geophysics, 48(4): 947–950. MENEZES PTL & TRAVASSOS JM. 2010. Magnetotellurics as a mod-eling tool in the extensive magmatic context of Paran´a Basin, Brazil. The Leading Edge, 29(7): 832–840.
NAZAR´E CPP. 2004. Modelagem s´ısmica em um modelo geol´ogico baseado em dados da Bacia do Solim˜oes. Undergraduate Final Project, Geophysics, Centro de Geociˆencias, Universidade Federal do Par´a, Brazil. 21 pp.
NAZAR´E CPP. 2007. Processamento S´ısmico CMP e CRS de dados sint´eticos ac´usticos e el´asticos representativos das Bacias Paleoz´oicas da Regi˜ao Amazˆonica. Master Dissertation on Geophysics, Centro de Geociˆencias, Universidade Federal do Par´a, Brazil. 100 pp.
NAZAR´E CPP, CALLAPINO GG, EIRAS JF & PASCHOAL JR WG. 2005. Aplicac¸˜ao dos m´etodos PMC e SRC em dados s´ısmicos sint´eticos de um modelo representativo da Bacia do Solim˜oes, Regi˜ao Amazˆonica, Brasil. In: International Congress of the Brazilian Geophysical Society, 9., 2005, Salvador. Expanded Abstracts... Salvador, Brazil: SBGf, 2005. 1486– 1490.
PHILIPP RP, ROLIM SBA, MALTA L, JELINEK AR, VIANA A, LAVINA E, CAGLIARI J & FACCINI UF. 2014. Estruturac¸˜ao do Arco de Rio Grande e da Sinclinal de Torres, Bacia do Paran´a, RS: Evidˆencias por levantamen-tos magnetotel´uricos. In: Simp´osio Brasileiro de Geof´ısica, 6., 2014, Porto Alegre. Resumos Expandidos... Porto Alegre, Brazil: SBGf, 2014. CD-ROM.
PINTO VR. 2009. O M´etodo Magnetotel´urico Marinho (MMT) na Explo-rac¸˜ao de Hidrocarbonetos. Master Dissertation on Geophysics – Obser-vat´orio Nacional, Rio de Janeiro, Brazil. 87 pp.
PORSANI JL. 1991. Estudo da estrutura geo-el´etrica da regi˜ao do Juru´a, AM, pelo m´etodo magnetotel´urico. Master Dissertation on Geophysics, Centro de Geociˆencias, Universidade Federal do Par´a, Brazil. 105 pp.
PRAUS O, P˘E ˇCV´A J, PETR V, BABUˇSKA V & PLOMEROV´A J. 1990. Magnetotelluric and seismological determination of the lithosphere-asthenosphere transition in Central Europe. Physics of the Earth and Planetary Interiors, 60: 212–228.
RIJO L. 1977. Modeling of electric and electromagnetic data. PhD Thesis on Geophysics – Department of Geology and Geophysics, University of Utah. 242 pp.
ROKITYANSKY II. 1982. Geoelectromagnetic Investigation of the Earth’s Crust and Mantle. Springer, Berlin. 381 pp.
SILVA NETO FA. 2004. Modelagem ac´ustica por diferenc¸as finitas e ele-mentos finitos em 2-D e 2,5-D. Master Dissertation on Geophysics, Cen-tro de Geociˆencias, Universidade Federal do Par´a, Brazil. 103 pp. SILVA JBC, MEDEIROS WE & BARBOSA VCF. 2001. Pitfalls in Nonlinear Inversion. Pure and Applied Geophysics, 158: 945–964.
SIMPSON F & BAHR K. 2005. Practical Magnetotellurics. Cambridge University Press, Cambridge. 270 pp.
TAVEIRA D, FONTES SL, LA TERRA EF & MIQUELUTTI LG. 2014. Ima-geamento Magnetotel´urico da Porc¸˜ao Central da Bacia do Paran´a. In: Simp´osio Brasileiro de Geof´ısica, 6., 2014, Porto Alegre. Resumos Ex-pandidos... Porto Alegre, Brazil: SBGf, 2014. CD-ROM.
VITAL LB, LA TERRA EF, FONTES SL & MIGUELUTTI LG. 2014. Inter-pretac¸˜ao Geol´ogica/Geof´ısica da Parte Central da Bacia dos Parecis, a partir de Dados Magnetotel´uricos. In: Simp´osio Brasileiro de Geof´ısica, 6., 2014, Porto Alegre. Resumos Expandidos... Porto Alegre, Brazil: SBGf, 2014. CD-ROM.
TEZKAN B. 1999. A review of environmental applications of quasi-stationary electromagnetic techniques. Surveys in Geophysics, 20: 279–308.
TEZKAN B. 2009. Radiomagnetotellurics. In: KIRSCH R (Ed.). Ground-water Geophysics: A Tool for Hydrogeology. 2 ed., Springer Verlag, Berlin Heidelberg. Ch. 10: 295–316.
TEZKAN B, GOLDMAN M, GREINWALD S, H ¨ORDT A, M ¨ULLER I, NEUBAUER FM & ZACHER G. 1996. A joint application of radiomagne-totellurics and transient electromagnetics to the investigation of a waste deposit in Cologne (Germany). Applied Geophysics, 34(3): 199–212. TEZKAN B, GEORGESCU P & FAUZI U. 2005. A radiomagnetotelluric survey on an oil-contaminated area near the Brazi Refinery, Romania. Geophysical Prospecting, 53(3): 311–323.
TURBERG P, MUELLER I & FLURY F. 1994. Hydrogeological investiga-tion of porous environments by radio magnetotelluric-resistivity (RMT-R 12-240 kHz). Journal of Applied Geophysics, 31: 133–143.
VAN ZYL JSV. 1977. Resistivity and the continental crust in Southern Africa. Nature, 265: 614–615.
VAN ZYL JSV. 1978. The relationship between the deep electrical resis-tivity structure and tectonic provinces in southern Africa. Transactions of the Geological Society of South Africa, 81: 129–142.
VARENTSOV IVM, KULIKOV VA, YAKOVLEV AG & YAKOVLEV DV. 2013. Possibilities of Magnetelluric Methods in Geophysical Exploration for Ore Minerals. Physics of the Solid Earth, 49(3): 309–328. VOZOFF K. 1972. The Magnetotelluric Method in the exploration of
sedimentar basins. Geophysics, 37(1): 98–141.
VOZOFF K. 1991. The magnetotelluric method. In: NABIGHIAN MN (Ed.). Electromagnetic Methods in Applied Geophysics. Society of Exploration Geophysicists, 2B: 641–711.
WANDERLEY FILHO JR, TRAVASSOS WAS & ALVES DB. 2005/2006. O diab´asio nas bacias paleoz´oicas amazˆonicas – Her´oi ou Vil˜ao? Boletim de Geociˆencias da Petrobras, 14(1): 177–184.
Recebido em 6 marc¸o, 2017 / Aceito em 26 abril, 2017 Received on March 6, 2017 / Accepted on April 26, 2017