Repositório ISCTE-IUL
Deposited in Repositório ISCTE-IUL: 2019-04-03Deposited version: Post-print
Peer-review status of attached file: Peer-reviewed
Citation for published item:
Lopes, I. T. (2017). Development expenditures as source of revenue and market valuation: evidence from the Iberian cluster. International Journal of Innovation and Regional Development. 7 (4), 273-289
Further information on publisher's website: 10.1504/IJIRD.2017.10007286
Publisher's copyright statement:
This is the peer reviewed version of the following article: Lopes, I. T. (2017). Development expenditures as source of revenue and market valuation: evidence from the Iberian cluster. International Journal of Innovation and Regional Development. 7 (4), 273-289, which has been published in final form at https://dx.doi.org/10.1504/IJIRD.2017.10007286. This article may be used for non-commercial purposes in accordance with the Publisher's Terms and Conditions for
self-archiving.
Use policy
Creative Commons CC BY 4.0
The full-text may be used and/or reproduced, and given to third parties in any format or medium, without prior permission or charge, for personal research or study, educational, or not-for-profit purposes provided that:
• a full bibliographic reference is made to the original source • a link is made to the metadata record in the Repository • the full-text is not changed in any way
The full-text must not be sold in any format or medium without the formal permission of the copyright holders. Serviços de Informação e Documentação, Instituto Universitário de Lisboa (ISCTE-IUL)
Av. das Forças Armadas, Edifício II, 1649-026 Lisboa Portugal Phone: +(351) 217 903 024 | e-mail: [email protected]
Development Expenditures as Source of Revenue and Market
Valuation: Evidence from the Iberian Cluster
Ilídio Tomás Lopes
Instituto Universitário de Lisboa (ISCTE-IUL) Business Research Unit (BRU-IUL)
Av. das Forças Armadas, 1649-026, Lisbon, Portugal Email: [email protected]
Abstract:
Over the last decades, companies have been aligning its strategy with focus on research and development activities, towards future economic benefits. These innovative activities are, in many cases, associated to changes by introducing new methods, ideas, processes, products, and learning practices. Innovation also translates the ability to produce and transform knowledge, contributing to potential economic returns. The current research aims to identify whether development expenditures (application of research findings or other knowledge), recognized in the firms’ annual statement of financial position, have a significant impact on Iberian firms’ revenues and on market valuation. Based on the 68 Iberian non-financial listed companies, with active development projects over the period 2010-2015, an econometric framework was regressed. Portugal and Spain are significantly aligned on the impact of development expenditures on predicting firm’s revenue and firm’s market valuation. This intangible asset, when managed together with other intangible resources, can generate higher value-added inflows, if compared with its isolated effects. Research didn’t evidence any significant time effects neither activity sector effects.
Keywords: innovation; European strategy 2020; research and development; development
Biography:
Professor of Accounting and Finance at Instituto Universitário de Lisboa (ISCTE-IUL) and researcher at Business Research Unit (BRU-IUL). Undergraduate in Business Administration, he obtained a Master’s Degree in Statistics and Information Management and a PhD in Management, specializing in Accounting (University of Coimbra, Portugal). His research is in the fields of financial accounting, corporate governance, auditing, business and performance, and research methodologies. Member of scientific and editorial boards in conferences and international journals.
This paper is a revised and expanded version of a paper entitled 'Development Expenditures towards firm's turnover and firm' market valuation: evidence from Portugal and Spain' presented at the 9th International Conference on entrepreneurship, Innovation and Regional Development (ICEIRD), National University of Political Studies and Public Administration ((SNSPA), Bucharest, Romania, 23-34 June 2016.
1. Theoretical background and objectives
The last two decades have been driven by a new techno-economic paradigm (Freeman and Louçã, 2001). The old “Fordist” style has been replaced by an “Information and
Communication Technology” (ICT) networking style, driven by information-intensive
mechanisms, by computer-added designs, by concurrent engineering, strongly customized, supported by flexible production systems, embedded in distributed intelligence procedures, based on multi-skilling, and supported by government information, coordination and regulation. Countries and firms became a very heavy spender on Research and Development (R&D) and on continuous education and training – its focus has increasingly based on innovation. It embodies an action or process of innovating. It is associated to changes, with a certain level of novelty, by introducing new methods, new ideas, or new products. Innovation translates the ability to produce knowledge, it contributes to potential inflows, and it is widely recognized as one of the primary driving forces of growth and profitability. Over the last decades, researchers tried to identify the sources that drive individuals and groups to innovate and contribute to value creation and sustainable development across firms and nations (Deschryvere, 2014; Fontana et al., 2012; Chen et al., 2011; Malerba, 2005; Breshi et al.,
2000; Malerba and Orsenigo, 1995, 1996; Pavitt, 1984; Jewkes et al., 1958). In these different approaches towards the identification of innovation drivers, Schumpeterian patterns have been stated as the most robust findings across the literature. Thus, innovative activities differ across industries along several dimensions, in particular the knowledge intensity embedded in those activities, the type of actors and institutions involved in innovative activities and policies, and the economic effects of innovations (Malerba, 2005). Those patterns are structured around four dimensions: 1. Concentration and asymmetries among innovating firms in each particular sector; 2. Size of the innovating firms; 3. Changes over time in the hierarchy of innovators; and 4. Relevance of the entry of new innovators. Fontana et al. (2012) explore the most recent literature about Schumpeterian patterns of innovation and contribute to identify the sources of breakthrough inventions by extracting new outcomes on the base of the mentioned old patterns. Broadly, a turbulent environment rather than a more stable is conducive to a higher probability of the occurrence of breakthrough inventions and creation national and regional ecosystems, understood as the way firms and agencies capture the complex synergies among a variety of collective efforts involved in bringing innovation to market. Thus, at a national level, an innovation ecosystem is made up of a network of local innovation ecosystems, built on: 1. Competencies with attention to regional strengths; 2. The identification of research strategies; 3. Regional environment; 4. Forming regional partnerships; and 5. Funding the machinery, which consists of facilities, people and organizations (NAS, 2007).
From a financial point of view, R&D disbursements are probably the most known and used proxy to measure the innovation intensity across entities and nations. According to
International Accounting Standard 38 (IASB, 2004), “Research” relates to the original and
planned investigation undertaken with the prospect of gaining new scientific or technical knowledge and understanding while “Development” is the application of research findings or other knowledge to a plan or design for the production of new or substantially improved materials, devices, products, processes, systems, or services prior to commencement of commercial production or use (Chaudhry et al., 2016). From an accounting perspective, costs incurred in the research phase are expensed immediately, affecting the current profit and loss, while costs incurred in the development phase are capitalized (IASB, 2004), recognized as intangible assets in the financial statement of financial position. Thus, R&D expenditures could lead entities (public and private) to growth, to increased returns, and subsequently into financial and strategic achievements. These expenditures, based on knowledge applications,
are the basis of innovation, driving companies to potential economic benefits (Tahinakis and Samarinas, 2013). According to Chen et al. (2011), most nations have gradually devoted more efforts to R&D and have tried to create a favorable innovation environment by enforcing intellectual property rights to promote innovations. However, literature does not provide unanimous evidence about the relationship between innovation and firm’s revenues (Lopes and Ferraz, 2016; Tudor et al., 2014; Deschryvere, 2014; Tanfous, 2013; Lopes, 2011; Chan et al., 2003; Lev and Sougiannis, 1996). In this scope, Deschrvere (2014) found that large firms that are continuous innovators have significant positive two-way associations between R&D growth and sales growth; however, in small continuous product innovators that association is clearly stronger than for large ones. Furthermore, relating the occasional process and product innovators, he found a positive and significant association between sales growth and subsequent R&D growth. Concerning the effectiveness of R&D intensity, Lopes (2011) did not achieve a significant correlation between those expenditures and turnover. However, companies and countries should monitor and report their innovation cycles in order to increase their turnovers. This result seems consistent with evidences achieved by Chan et al. (2003) relating to the stock market valuation derived from those expenditures, not supporting a direct relationship between R&D expenditures and future returns. Different evidences were obtained by Lev and Sougiannis (1996) relating insider gains. These gains in R&D inside intensive companies are significantly higher than insider gains obtained in firms not strongly engaged in innovation expenditures. Although the complex relationships between R&D and subsequent economic benefits, if efficiently and productively used, R&D can serve as a major source of competitive advantage and predicted returns (Chen et al, 2011). According to Akinwale et al. (2011), it is not enough to increase the expenditures on R&D and innovation when countries have weak institutions and networks, and poor coordination systems. Building a creative high performance R&D culture is required (Skerlavaj et al., 2013; Stock et al., 2013; Newman, 2009; Ambos and Schlegelmilch, 2008). This creative culture combines customer focus, risk tolerance, entrepreneurship, alignment with strategies, innovation, virtual organization and networking, and efficient execution. Thus, building a creative winning R&D culture is embedded on values, expertise, short and long term orientation, and effective policies.
The age of ICT has definitely marking the new ways to transform knowledge. The business to business use of the internet is probably turned out to be the most important source of productivity gains (Freeman and Louçã, 2001). Over the last decade, the efforts on R&D in
all funding sources (business enterprise sector; government sector; higher education sector; and private non-profit sector) have increased across European and Non-European countries. These efforts have been settled as a key policy component of the EU strategy 2020 for economic growth (Eurostat, 2016a), despite the intrinsic multicultural differences (Hofstede, Hofstede and Minkov, 2010). Broadly, European Union sets a 3% objective for R&D intensity and most Member States (e.g. Denmark, Germany, Slovenia, Estonia, France, Belgium, and Portugal) have adopted, at a national level commitment, that intensity target. Nordic countries (Finland and Sweden), pursuing its historic and progressive effort over time, set its target on R&D above 3%. Non-European countries, such as United States, Japan, South Korea and China, have settled a R&D intensity target of 3%, 4%, 5%, and 2.5%, respectively, despite in some cases without a defined deadline. Although the desired convergence on European strategy, challenges across European countries on R&D do not require the same intensity effort. Some of them already reached their national targets, others are still on track, and others did not settle ambitious efforts, both in the public and private funding sources. Hence, R&D expenditures are influenced by several economic and social factors, including the funding policies implemented by Member States. According to Eurostat (2016a, 2016b), the policy failures are categorised as follows: 1. Insufficient or inadequate public funding of the science base and higher education system; 2. Inefficient public incentives to stimulate business R&D; 3. Poor match between supply and demand side measures; and 4. The need to identify and address the bottlenecks that restrict the growth of firms in innovative sectors. Although the impact of macroeconomic trends at the firm’s level, organizations include in their innovation strategies important R&D efforts towards the achievement of systematic and sustainable profitability and performance standards (Tahinakis and Samarinas, 2013; Lopes, 2011; Freeman and Louçã, 2001; Lev and Sougiannis, 1996). This research aims to add complimentary evidences to previous researches (Lopes and Ferraz, 2016; Lopes et al., 2016a; Tudor et al., 2014; Tahinakis and Samarinas, 2013; Tanfous, 2013; Akinwale et al., 2011; Lopes, 2011; Chan et al., 2003; Lev and Sougiannis, 1996) and to identify whether the intangible resource “Development Expenditures”, recognized in the annual accounts, has, in the Iberian countries (Portugal and Spain), a significant and positive impact on regional firms’ economic returns and market valuation. Furthermore, it also aims to provide an integrated overview about the convergence and alignment of those countries, included in the Iberian cluster, with the EU strategy 2020 on R&D efforts.
2. Overview of R&D policies in Iberian countries
At a macroeconomic level, and relating the Iberian geographic cluster, Portugal is integrated in the Member States group which needs to substantially raise their rate of increase in R&D intensity in order to comply with its target, and whose required efforts exceeds the EU average. As illustrated by graph 1, the national target (2%) of Spain is below the EU strategy 2020 target. Thus, this country is not aligned with EU target, needing additional efforts in order to raise its own national target. Over the period 2000-2011, Portugal observed a negative average annual growth on R&D intensity (-0.2%) while Spain observed an increase of 3.6%. In order to achieve the targeted rate, set for both countries, an increase of 8% and 4.6%, respectively for Portugal and Spain, is required for the period 2011-2020.
Graph1 – R&D intensity as a % of GDP (2011/2020)
Source: Eurostat (2016a)
In European Union, 55.0% of R&D expenditures are funded by business enterprise sector and 32.7% are funded by government sector. Higher education sector and private non-profit sector, as sources of R&D funding, still evidence a marginal impact (0.8% and 1.6%, respectively). As illustrated by graph 2, Portugal and Spain observe opposite trends: in Portugal, government sector is responsible for funding 46.4% of R&D projects while in Spain 46.3% of similar projects are funded by business enterprise sector.
Graph2 – R&D by funding source (2013)
Source: Eurostat (2016b)
Crossing the Global Cultural Index (GCI), based on the six cultural dimensions defined and used by Hofstede et al. (2010), and the R&D intensity, measured as a percentage of GDP (Eurostat, 2016a), an overview of European countries can be provided in the graph 3 below. We can find signs of convergence between both countries. Thus, we consider that those countries are aligned by the same requirement efforts, integrating the same geographical and strategic cluster.
Graph 3 – Culture and R&D across Europe
At a microeconomic level (firms’ level), this research is based on Development Expenditures, capitalized and disclosed in the firm’s statement of financial position (balance sheet), of the non-financial Iberian listed firms (Portugal 24; Spain 44). Our sample integrates all the 68 Iberian firms with active development projects over the period 2010-2015. Those firms were categorized according the “Standard Industries Classification” (SIC): Energy (production and alternative energies) at 10.3%; Basic materials (forestry, paper; metals, mining) at 13.2%; Industrials (construction, materials; aerospace and defense; electronic and electrical equipment; transportation) at 20.6%; Consumer goods (automobiles, parts; beverages, food producers; household goods; residential construction; leisure goods; tobacco) at 17.6%;
Consumer services (food/drug retailers; media; travel; leisure) at 20.6%; Telecommunications
(fixed-line, mobile) at 4.4%; Utilities (gas, water, electricity, multi-utilities) at 2.9%; and
Technology (software/ computer services, technology hardware/equipment) at 10.3%. Data
relates to the period 2011-2015 for the dependent variables and to the economic period 2010-2014 for the independent variables. Data was extracted from the Datastream database, and from the annual financial reporting, yearly disseminated to stakeholders as required by the financial markets regulators and taxation authorities.
As previously described, this research, in the scope of business R&D intensity policy, has the main objective to identify whether development expenditures (recognized as intangibles in the statement of financial position) funded by business enterprise sector have a significant impact (isolated or aggregated effects) on Portuguese and Spanish firms’ economic revenue (measured through firm’s Turnover) and on market valuation (measured through firm’s Market Value). Thus, we formulate two econometric models with the following core specifications:
Model 1 (Isolated effect of Development Expenditures)
Yit = β0 + β1DEVEXPi(t-1) + β2OTHINTi(t-1) + β3BOARDi(t-1) + β4LEVi(t-1) + β5SIZEi(t-1) +
β6COUNTi(t-1) +β7Sector Effectsi(t-1) + β8Time Effectsi(t-1) + εit
(i = 1,….,n ; t = 1,….,m)
Model 2 (Conjoint effect of Development Expenditures)
Yit = β0 + β1(DEVEXP*OTHINT)i(t-1) + β2BOARDi(t-1) + β3LEVi(t-1) + β4SIZEi(t-1) +
β5COUNTi(t-1) +β6Sector Effectsi(t-1) + β7Time Effectsi(t-1) + εit
Where:
- Yit is the logarithm of firm’s turnover (TURN) at the end of economic year t, and average firm’s market value (MVALUE) per common share over the economic year t.
- DEVEXPi(t-1) is the logarithm of total development expenditures (e.g. patents; software projects, technical design, etc.) capitalized by firm i in economic year t-1.
- OTHINTi(t-1) is the logarithm of total other intangible assets (goodwill; brands and trademarks; licenses; alliances; etc.) recognized by firm i in economic year t-1.
- BOARDi(t-1) represents the number of members of the board of directors of firms in economic year t-1.
- LEVi(t-1) is the debts to assets ratio (financial leverage) of firm i in year t-1.
- SIZEi(t-1) is the logarithm of total assets, evidenced by firm i at the end of economic year t-1.
- COUNTi(t-1) expresses the country and stock exchange: Portugal – PSI; Spain – IBEX.
- Sector Effectsi(t-1) is a dummy variable for each activity sector, according “Standard
Industries Classification”.
- Time Effectsi(t-1) is a dummy variable for each year over the period 2010-2015.
- εit is the residual of firm i in period t or t-1.
Hence, model 1 captures the isolated effect of development expenses and other intangibles on firm´s turnover and on firm’s market value while model 2 captures the effect of those resources through an aggregated approach with other intangible assets such as brands, licenses, trademarks, among others. This research can consolidate the previous outcomes provided by Lopes and Ferraz (2016), Lopes et al. (2016b), Miller and Choi (2010) and Lev and Sougiannis (2003, 1996).
MVALUE, as a dependent variable, is used in this scope as an embodiment of all intellectual drivers (e.g. firm’s reputation; stakeholders’ satisfaction; strategic alliances; etc.) whose capitalization in the statement of financial position is not supported by financial and accounting rules, and complimentary information is not disclosed in the management reporting notes (Tahinakis and Samarinas, 2013; Akinwale et al., 2011; Chan et al., 2003; Lev and Sougiannis, 1996). However, market value can also be understood as a source of future returns, by inducing stakeholders into future shares acquisitions and other financial behaviors. Thus, we formulate the model 3, in which MVALUE is used as a predictor of firm’s future revenue.
Model 3
TURNit = β0 + β1(DEVEXP*OTHINT)i(t-1) + β2BOARDi(t-1) + β3MVALUEi(t-1) + β4LEVi(t-1) +
β5SIZEi(t-1) + β6COUNTi(t-1) +β7Sector Effectsi(t-1) + β8Time Effectsi(t-1) + εit
(i = 1,….,n ; t = 1,….,m) Variables were simultaneously introduced in the models in order to identify whether development expenses and other intangible assets can act as predictors of economic returns and firm’s valuation (rejection of H0: β1=β2=…=β7=0; p<α). Thus, based on the literature theoretical background, we formulate the following four hypotheses:
H1: Development expenditures have a positive impact on Iberian firm’s turnover.
H2: Development expenditures have a positive impact on Iberian firm’s market
valuation.
H3: Development expenditures and other intangibles have a positive aggregated impact
on Iberian firm’s turnover.
H4: The impact of development expenses on firm’s economic returns and on firm’s
market valuation is convergent within Portugal and Spain.
The phenomenon under analysis is complex and has multivariate causes and effects. Although the lack of literature on the linkage proposed for analysis, R&D (IASB, 2004), as an intermediate stage of conclusive innovation, has the power to embody a set of skills, abilities, knowledge, expertise, and strategic decisions, towards the dynamic transformation of tacit knowledge into explicit knowledge (e.g. patents, software, alliances, rights, trademarks, technical design, etc.). Thus, our assumption is that only proactive and dynamic organizations, strongly oriented to efficient knowledge transformation mechanisms, can support strong R&D expenditures efforts (Skerlavaj et al., 2013; Stock et al., 2013; Newman, 2009; Ambos and Schlegelmilch, 2008; Lev and Sougiannis, 2003, 1996).
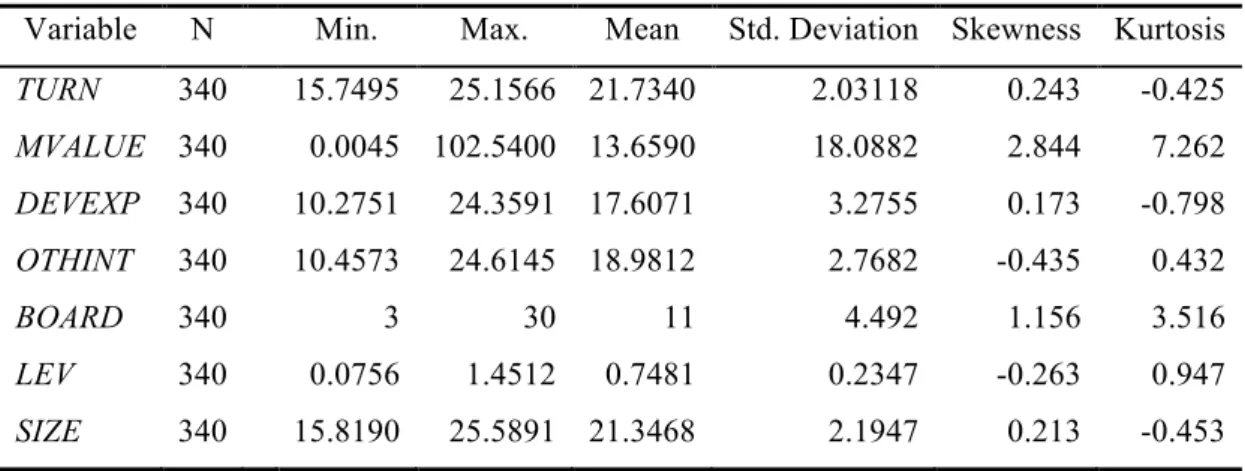
The means, standard deviations, and other descriptive measures, for the sample as a whole on the various measures of interest are shown in Table 1. The simple correlations (Pearson’s coefficients) between the variables of interest are shown in Table 2.
Table 1: Descriptive measures
Variable N Min. Max. Mean Std. Deviation Skewness Kurtosis
TURN 340 15.7495 25.1566 21.7340 2.03118 0.243 -0.425 MVALUE 340 0.0045 102.5400 13.6590 18.0882 2.844 7.262 DEVEXP 340 10.2751 24.3591 17.6071 3.2755 0.173 -0.798 OTHINT 340 10.4573 24.6145 18.9812 2.7682 -0.435 0.432 BOARD 340 3 30 11 4.492 1.156 3.516 LEV 340 0.0756 1.4512 0.7481 0.2347 -0.263 0.947 SIZE 340 15.8190 25.5891 21.3468 2.1947 0.213 -0.453
Table 2: Pearson’s correlation coefficients
VAR. TURN MVALUE DEVEXP OTHINT BOARD LEV SIZE COUNT
TURN 1 MVALUE 0.228 1 0.065* DEVEXP 0.673 *** -0.045 1 0.000 0.815 OTHINT 0.815 *** -0.089 0.648*** 1 0.000 0.365 0.000 BOARD 0.603 *** -0.134 0.342*** 0.532*** 1 0.000 0.256 0.000 0.000 LEV 0.201 -0.267 0.214 0.072 0.039 1 0.114 0.254 0.417 0.419 0.810 SIZE 0.912 *** 0.276** 0.587*** 0.643*** 0.581*** 0.118 1 0.000 0.021 0.000 0.000 0.000 0.327 COUNT 0.193 0.287 ** -0.034 -0.028 -0.012 -0.081 0.132 1 0.116 0.013 0.797 0.786 0.919 0.467 0.244 *** p< 0.01; ** p<0.05; *p<0.1
Based on the bivariate analysis, TURN is significantly correlated with DEVEXP (r=0.673;p<0.001), OTHINT (r=0.815;p<0.001), BOARD (r=0.603;p<0.001), and SIZE (r=0.912;p<0.001). These evidences, corroborating the achievements provided by Lopes and Ferraz (2016), Lopes et al. (2016a, 2016b), Miller and Choi (2010), and Lev and Sougiannis (2003, 1996), are aligned with the assumptions of International Accounting Standard 38
(IASB, 2004) that intangible assets are associated to expected future benefits, flowing for the owner, over a certain useful life period. However, we didn´t find any significant correlation between MVALUE, and DEVEXP (r=-0.045;p=0.815) and OTHINT (r=-0.089;p=0.365). Thus, customers seem to incorporate more easily the power of intangibles through turnover, as the most direct performance measure, instead of adjusting it on firm´s market value (strongly driven by multiple factors, including irrational technical behaviours and decisions, instead of using a more fundamental approach). The unexpected negative signal supports the need for additional developments about the information asymmetry between intangible resources recognition and measurement basis, and shareholders’ perceptions. This result is consistent with outcomes provided by Chan et al. (2003), in respect to stock market valuation derived from R&D expenditures. Those results do not support a direct relationship between development expenditures and firm’s market valuation. The regression model towards the prediction of TURN and MVALUE (with and without time effects and activity sector effects) are evidenced in the table 3 and table 4 below.
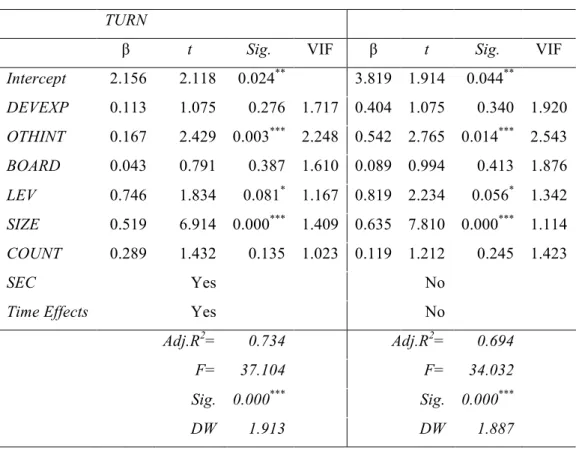
Table 3: Regression model equations - TURN (Model 1)
TURN
β t Sig. VIF β t Sig. VIF
Intercept 2.156 2.118 0.024** 3.819 1.914 0.044** DEVEXP 0.113 1.075 0.276 1.717 0.404 1.075 0.340 1.920 OTHINT 0.167 2.429 0.003*** 2.248 0.542 2.765 0.014*** 2.543 BOARD 0.043 0.791 0.387 1.610 0.089 0.994 0.413 1.876 LEV 0.746 1.834 0.081* 1.167 0.819 2.234 0.056* 1.342 SIZE 0.519 6.914 0.000*** 1.409 0.635 7.810 0.000*** 1.114 COUNT 0.289 1.432 0.135 1.023 0.119 1.212 0.245 1.423 SEC Yes No
Time Effects Yes No
Adj.R2= 0.734 Adj.R2= 0.694
F= 37.104 F= 34.032
Sig. 0.000*** Sig. 0.000***
DW 1.913 DW 1.887
Table 4: Regression model equations - MVALUE (Model 1)
MVALUE
β t Sig. VIF β t Sig. VIF
Intercept -7.213 -2.453 0.017** -8.594 -2.525 0.014** DEVEXP 0.448 0.389 0.804 1.921 0.337 0.361 0.719 1.827 OTHINT -2.125 -2.312 0.027** 2.115 -3.032 -2.433 0.018** 2.340 BOARD -1.116 -1.907 0.025** 1.610 -1.377 -2.170 0.034** 1.610 LEV -5.867 -1.413 0.089* 1.345 -6.940 -1.660 0.102 1.033 SIZE 6.768 4.143 0.000*** 2.678 6.768 4.143 0.000*** 2.309 COUNT 7.654 1.642 0.077* 1.713 8.761 1.727 0.089* 1.181
Sector Effects Yes No
Time Effects Yes No
Adj.R2= 0.312 Adj.R2= 0.239
F= 5.209 F= 3.999
Sig. 0.000*** Sig. 0.000***
DW 1.432 DW 1.387
*** p< 0.01; ** p<0.05; *p<0.1
Considering the effects of time (2010-2015) and the activity sector (eight typology classification), 73.4% of variance is explained when regressed against TURN while only 31.2% of variance is explained when regressed against MVALUE. In all cases, DEVEXP is not statistically significant (p>0,1), contradicting the evidences provided in the bilateral correlations analysis (table 2). Thus, although the positive expected signal, our hypotheses 1 and 2, are rejected, stating that development expenditures disbursed by firms cannot be used, on single effect, as a predictor of revenue and market value. As expected, other intangible resources can be used to predict TURN and MVALUE, however in the case of MVALUE, with an unexpected negative signal (Lopes and Ferraz, 2016; Lopes and Martins, 2016; Deschryvere, 2014; Tudor et al., 2014; Tanfous, 2013; Lopes, 2011; Chan et al., 2003; Lev and Sougiannis, 1996). This support the assumption that market value is driven by multiple factors, not supported by the fundamental analysis taken into account only by a certain type of shareholders. The size of the board of directors, as an embodiment of strategic expertise and strategic directions, is not statistically significant (p>0.05) in predicting TURN, however statistically significant in the prediction of MVALUE (p<0.05), despite its negative signal. These evidences confirm its indirect impact on turnover and its direct impact on
shareholder’s perceptions (market approach) as signaled by Lopes et al. (2016a). As expected, the control variable SIZE is significant in both cases at 1% significance level.
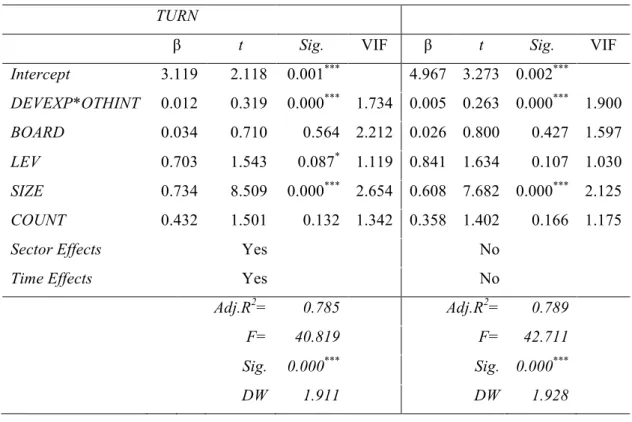
Table 5: Regression model equations – TURN (Model 2)
TURN
β t Sig. VIF β t Sig. VIF
Intercept 3.119 2.118 0.001*** 4.967 3.273 0.002*** DEVEXP*OTHINT 0.012 0.319 0.000*** 1.734 0.005 0.263 0.000*** 1.900 BOARD 0.034 0.710 0.564 2.212 0.026 0.800 0.427 1.597 LEV 0.703 1.543 0.087* 1.119 0.841 1.634 0.107 1.030 SIZE 0.734 8.509 0.000*** 2.654 0.608 7.682 0.000*** 2.125 COUNT 0.432 1.501 0.132 1.342 0.358 1.402 0.166 1.175
Sector Effects Yes No
Time Effects Yes No
Adj.R2= 0.785 Adj.R2= 0.789
F= 40.819 F= 42.711
Sig. 0.000*** Sig. 0.000***
DW 1.911 DW 1.928
*** p< 0.01; ** p<0.05; *p<0.1
This model is globally adherent (With time and activity sector effects: Adj.R2=0.785;
F=40.819;p<0.001/Without time and activity sector effects: Adj.R2=0.789; F=42.711;p<0.001), and the conjoint effect of DEVEXP and OTHINT is statistically significant (p<0.001) as turnover’s predictors. Based on these outcomes, development projects capitalized in financial statements have an aggregated effect (synergy effect) on performance, corroborating the evidence provided by Lopes and Ferraz (2016), Tudor et al. (2014), Tanfous (2013), and Lev and Sougiannis (2003, 1996). This evidence is also aligned with the findings achieved by Macerinskiené and Survilaité (2011), which when parts of intellectual capital are managed together, business organisations can generate high value-added flows. This reflects the effect of the synergy between intangibles and their conjoint impact on the operational revenue of businesses. Thus, when parts of intellectual capital are managed together, its synergetic
effects increase the performance and profitability of businesses. According other researches,
incorporating a single typology of intangibles such as R&D or software developments, authors have found a significant relationship between those intangibles and firm’s
performance level (Lev and Sougiannis, 2003, 1996). The same approach in predicting MVALE is evidenced in the table 6 below.
Table 6: Regression model equations – MVALUE (Model 2)
MVALUE
β t Sig. VIF β t Sig. VIF
Intercept -8.320 -1.917 0.014** -7.620 -2.837 0.006*** DEVEXP*OTHINT -0.039 -1.210 0.112 1.900 -0.044 -1.370 0.176 1.900 BOARD -1.413 -2.345 0.007*** 1.597 -1.398 -2.152 0.035** 1.597 LEV -6.156 -2.234 0.114 1.030 -6.191 -1.546 0.127 1.030 SIZE 7.675 4.319 0.000*** 2.125 5.675 3.524 0.001*** 2.125 COUNT 6.128 1.934 0.045** 1.175 9.396 1.807 0.076* 1.175
Sector Effects Yes No
Time Effects Yes No
Adj.R2= 0.198 Adj.R2= 0.226
F= 4.819 F= 3.917
Sig. 0.000*** Sig. 0.003***
DW 1.565 DW 1.428
*** p< 0.01; ** p<0.05; *p<0.1
Relating the prediction of firm’s market value, the robustness of the model is not significant (Adj.R2=0.198; F=4.819;p<0.000, considering the model with time and activity sector effects
and Adj.R2=0.226; F=3.917;p=0.003 without those effects). As already mentioned,
MVALUE is driven by other factors, most of them beyond the financial and accounting approach embedded in this research.
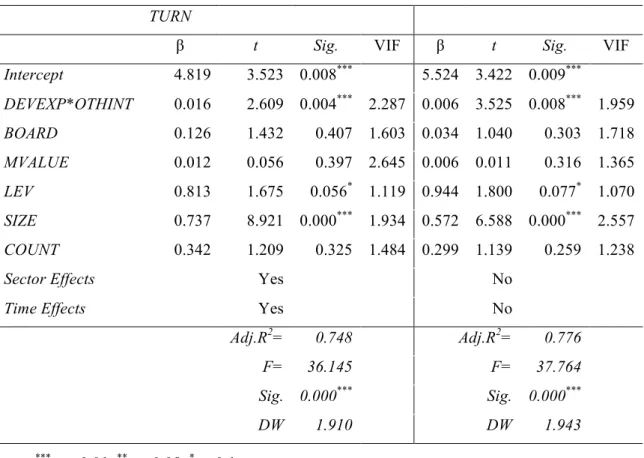
In model 3, we aimed to identify the effect of firm’s market price (MVALUE) on revenue (measured through TUR) generation, considering the conjoint effects of development
expenditures and other intangible assets. This model is globally adherent (Adj.R2=0.748;
F=36.145;p<0.000 considering time and activity sector effects and Adj.R2=0.776;
F=37.764;p<0.000 otherwise). The key variables (DEVEXP and OTHINT) are statistically significant (p<0.01) as turnover’s predictors, confirming the positive synergy effect and the alignment provided by International Accounting Standard 38 (IASB, 2004). Results summary of model 3 are evidenced in table 7.
Table 7: Regression model equations (Model 3)
TURN
β t Sig. VIF β t Sig. VIF
Intercept 4.819 3.523 0.008*** 5.524 3.422 0.009*** DEVEXP*OTHINT 0.016 2.609 0.004*** 2.287 0.006 3.525 0.008*** 1.959 BOARD 0.126 1.432 0.407 1.603 0.034 1.040 0.303 1.718 MVALUE 0.012 0.056 0.397 2.645 0.006 0.011 0.316 1.365 LEV 0.813 1.675 0.056* 1.119 0.944 1.800 0.077* 1.070 SIZE 0.737 8.921 0.000*** 1.934 0.572 6.588 0.000*** 2.557 COUNT 0.342 1.209 0.325 1.484 0.299 1.139 0.259 1.238
Sector Effects Yes No
Time Effects Yes No
Adj.R2= 0.748 Adj.R2= 0.776
F= 36.145 F= 37.764
Sig. 0.000*** Sig. 0.000***
DW 1.910 DW 1.943
*** p< 0.01; ** p<0.05; *p<0.1
We can conclude, therefore, that intangibles recognised in financial statements have an aggregated effect on turnover, corroborating our hypothesis 3, and also supporting the evidences provided by Lopes and Ferraz (2016), Tanfous (2013), Tudor et al. (2014), and Lev and Sougiannis (2003, 1996). This outcome is also aligned with the findings of Macerinskiené and Survilaité (2011), which when parts of intellectual capital are managed together, business organisations can generate high value-added flows.
Relating the robustness of the models, we run the multicollinearity diagnosis, the residual analysis, and the heteroscedasticity tests. The Variance Inflation Factor (VIF) assesses the degree of multicollinearity in the models. In this scope, we found that none of the independent variables of the current research has a VIF value close to 10, concluding that the analysis does not observe a severe problem of multicollinearity. Towards the analysis of independence of residuals, we used the Durbin-Watson (DW) test. Based on DW statistic, we noted that a null hypothesis is not rejected, which means that residuals describe a normal distribution, confirming that those errors are not auto correlated. Relating heteroscedasticity, we used the test of White, not rejecting the null hypothesis (p>0.05). Thus, the evidences
provided by the current econometric model can serve as an important contribution to theory and practice.
Towards the analysis of the last hypothesis (H4: The impact of development expenses on
firm’s economic returns and on firm’s market valuation is convergent within Portugal and Spain), we used a comparison of independent samples, using the dummy variable COUNT. Thus, null hypothesis states that the distribution between variables is the same across both countries (Portugal and Spain).
Table 8: Comparison between Iberian countries
Variable Equality of Variances (F) Sig. Equality of Means (t) df Sig. Mean Dif.
TURN 0.048 0.816 -1.619 338 0.145 -0.8223 MVALUE 15.191 0.000*** -2.463 338 0.013** -11.7121 DEVEXP 0.413 0.489 0.319 338 0.817 0.2572 OTHINT 2.659 0.067* 0.119 338 0.653 0.1638 BOARD 6.167 0.038** 0.215 338 0.718 0.1494 LEV 1.437 0.309 0.518 338 0.302 0.0690 SIZE 0.389 0.614 -1.276 338 0.359 -0.5913
***Null hypothesis rejected at 1% (p<0.01); ** Null hypothesis rejected at 5% (p<0.05); * Null hypothesis rejected at 10% (p<0.1)
Relating the equality of means, null hypothesis cannot be rejected for TURN, DEVEXP, OTHINT, BOARD, LEV, and SIZE, which confirms that observations do not differ across
countries (H4 is not rejected). We consider it an expected outcome because firms are
integrated in a globalized market, are affected by macroeconomic externalities, such as the European Union common policies (European Strategy 2020) and the sovereign debts effects. This confirms the assumption that both countries are aligned by the same innovation efforts, beyond the integration in the same geographic cluster, those countries are driving the same economic and strategic cluster. In respect the equality of variances, the null hypothesis is rejected for MVALUE, OTHINT, and BOARD. These results can be supported on cultural issues (Hofstede et al., 2010), on scale effects, and on differences associated to the national corporate governance codes (Lopes et al., 2016a).
3. Concluding remarks and directions
Research and Development (R&D), as a key pillar in the micro and macro level innovation policies, are sources of value by fostering markets’ development with new innovative products and services. Primarily embodied by individuals and groups, knowledge is transformed and embedded in the innovation cycles, driving companies and nations towards an increased labour productivity, towards the industrial competitiveness, towards the development of efficient resources, and towards the sustainable growth (Eurostat, 2016a). Based on the main objective of this research - to identify the financial impact of Development Expenditures (application of research findings or other knowledge) on firms’ future revenues and market valuation - our analysis can provide some additional and corroborative insights to the literature, as follows:
• At a macroeconomic level, Iberian countries are not convergent in terms of R&D targets in the scope of European Union strategy 2020. Portugal needs to substantially raise their rate of increase to reach their target while Spain requires lower efforts, however with a national target below the 3% fixed in EU strategy 2020 on R&D intensity target. In Portugal, R&D is mainly funded by government sector while in Spain similar projects are mainly funded by business enterprise sector. Funds from higher education sector and private non-profit sector are still marginal, however in line with EU average trends.
• At a microeconomic level, the intangible Development Expenditures has a statistically positive and significant conjoint effect as a predictor of firm’s revenue (measured by firms’ Turnover). Intangibles recognised in the statement of financial position have an aggregated effect on firm’s turnover. When managed together, firms can generate high value-added flows, reinforcing the synergy effects derived from immaterial resources. This research didn’t find any significant effects derived from time (2010-2015) neither from the activity sector categorization. These outcomes are aligned with other evidences provided over the last decade, such as Lopes and Ferraz (2016), Tudor et al. (2014), Tanfous (2013), Macerinskiené and Survilaité (2011), Lev and Sougiannis (2003, 1996).
• Although the global adherence of the econometric models, we achieved a weak result in predicting the firms’ market value variances. In the scope of market valuation, other intangibles seem to be directly perceived by shareholders with a significant and direct impact on turnover, however unexpectedly negatively correlated. Investors
seem to privilege primarily the technical analysis of stocks rather than supporting their decisions on a fundamental analysis. Once again, no significant effects were obtained derived by time or activity sector categorization.
• In the scope of development expenditures, as the application of research efforts in developing new products, services and processes, Portugal and Spain are significantly convergent. This evidence is supported on culture, economic and social issues, and on European common directions, such as the European strategy 2020 and the Eurozone convergence commitments and requirements. However, the difference between corporate governance issues and rules can also support the divergences still evidenced in the firms’ market valuation.
Finally, some limitations of the current research are acknowledged, principally its focus on only large listed companies. This research only provides an accounting perspective of the intangible asset “Development Expenditures” as a predictor of future revenues, as stated in the International Accounting Standard 38. It does not provide any analysis based on the innovation cycles (processes and steps) at a firm micro or macro level. However, as the current approach is replicable over time, it can also be conducted in the scope of other countries and regions, and structured on different and alternative metrics and approaches.
References
Akinwale, Y. O., Dada, A. D., Oluwadare, A. J., Jesuleye, O. A., and Siyanbola, W. O. (2012) ‘Understanding the Nexus of R&D, Innovation and Economic Growth in Nigeria’, International Business Research. Vol. 5, N.º 11, pp.187-196.
Ambos, B. and Schlegelmilch, B. B. (2008) ‘Innovation in Multinational Firms: Does Cultural Fit Enhance Performance?’, Management International Review. Vol. 48, N.º 2, pp.189-206.
Breshi, S., Malerba, F. and Orsenigo, L. (2000) “Technological regimes and Schumpeterian patterns of Innovation”, Economic Journal. Vol. 110, N.º 1, pp.388-410.
Chan, L. K. C., Lakonishok, J. and Sougiannis, T. (2003) ‘The stock market valuation of Research and Development Expenditures’, In Hand, J. and Lev, B. (Eds.). Intangible
Assets: Values, Measures, and Risks (pp. 387-414) Oxford: Oxford University Press.
Chaudhry, A., Fuller, C., Coetsee, D., Rands, E., Bakker, E., van der Merwe, M., Yeung, P, Varughese, S., Mcllwaine, S. and Balasubramanian, T. V. (2016) 2016 Interpretation
and Application of International Financial Reporting Standards (Wiley Regulatory Reporting), New Jersey: John Wiley & Sons.
Chen, C., Hu, J. and Yang, C. (2011) ‘An international comparison of R&D efficiency of multiple innovative outputs: the role of the national innovation system’, Innovation:
Management, Policy & Practice, Vol. 13, N.º 1, pp.341-360.
Deschryvere, M. (2014) ‘R&D, firm growth and the role of innovation persistence: an analysis of Finnish SMEs and large firms’, Small Business Economics, Vol. 43, N.º 1, pp.767-785.
Eursotat (2016a) Europe 2020 Targets: Research and Development [Online]
http://ec.europa.eu/europe2020/targets/eu-targets/index_en.htm (accessed 10 July 2016).
Eursotat (2016b Eurostat Key European Statistics: Science, Technology and Innovation
[Online] http://ec.europa.eu/eurostat/data/browse-statistics-by-theme (accessed 10 July
2016).
Fontana, R, Nuvolari, A., Shimizu, H. and Vezzulli, A. (2012) ‘Schumpeterian patterns of innovation and the sources of breakthrough inventions: evidence from a data-set of R&D awards’, Journal of Evolutionary Economics, Vol. 22, N.º 1, pp.785-810.
Freeman, C. and Louçã, F. (2001) As Time Goes By: From the Industrial Revolutions to the
Information Revolution, New York: Oxford University Press.
Hofstede, G., Hofstede, G. J., and Minkov, M. (2010) Cultures and Organizations: Software
of the Mind. Revised and Expanded, 3rd Edition, New York: McGraw-Hill.
IASB (2004) International Accounting Standard No. 38: Intangible Assets [Online]
http://www.ifrs.org/IFRSs/Pages/IFRS.aspx (accessed 12 July 2016).
Jewkes, J., Sawers, D., and Stillerman, R. (1958) The sources of invention, revised edition 1969, London: MacMillan.
Lev, B., Sougiannis T. (2003) ‘The capitalization, amortization, and value-relevance of R&D’, in Hand, J. and Lev, B. (Eds.): Intangibles: Management, Measurement, and
Reporting, pp.123-152, Brooking Institution Press, Washington.
Lev, B., Sougiannis T. (1996) ‘The capitalization, amortization, and value-relevance of Research and development’, Journal of Accounting and Economics, Vol. 21, N.º 1, pp.107-138.
Lopes, I. T. (2011) ‘The boundaries of intellectual property valuation: cost, market, income based approaches and turnover’, Intellectual Economics, Vol. 1, N.º 9, pp.55-72.
Lopes, I. T., and Ferraz, D. P. (2016) ‘The value of intangibles and diversity on boards looking towards economic future returns: Evidence from non-financial Iberian business organisations’, Int. J. Business Excellence, Vol. 10, Nº 3, pp.392-417.
Lopes, I. T., Ferraz, D. P. and Martins, M. M. (2016a) ‘The influence of diversity on boards on profitability: an overview across Iberian non-financial listed companies’, Corporate
Ownership and Control, Vol. 13, N.º 2-C2, pp.455-461.
Lopes, I. T., Ferraz, D. P. and Rodrigues, A. M. (2016b) ‘The drivers of profitability in the top 30 major airlines worldwide’, Measuring Business Excellence, Vol. 20, N.º 2, pp.26-37.
Macerinskiené, I. and Survilaité, S. (2011) ‘Company’s value added and its intellectual capital coherence’, Business: Theory and Practice, Vol. 12, N.º 2, pp.183‒192.
Malerba, F. (2005) ‘Sectorial systems: how and why innovation differs across sectors’, In J. Fagerberg and D.C. Mowery (Eds.), The Oxford handbook of innovation (pp. 380-406) Oxford: Oxford University Press.
Malerba, F. and Orseningo, L. (1995) “Schumpeterian patterns of innovation”, Cambridge
Journal of Economics, 19(1), 47-65.
Malerba, F. and Orseningo, L. (1996) ‘Schumpeterian patterns of innovation are technology-specific’, Research Policy, Vol. 25, N.º 1, pp.451-478.
Miller, C. C. and Choi, C. J. (2010) ‘Development and knowledge resources: a conceptual analysis’, Journal of Knowledge Management, Vol.14, No. 5, pp.759-776.
NAS – National Academy of Sciences (2007) Innovation Policies for the 21st Century:
Report of a Symposium, Wessner, C.W., Washington, D. C: The National Academy
Press.
Pavitt, K. (1984) ‘Patterns of technical change: towards a taxonomy and a theory’, Research
Policy, Vol. 13, N.º 1, pp.343-373.
Newman, J. L. (2009) ‘Building a Creative High-Performance R&D Culture’, Research
Technology Management, September-October, pp.21-31.
Skerlavaj, M., Su, C. and Huang, M. (2013 ‘The moderating effects of national culture on the development of organizational learning culture: a multilevel study across seven countries’, Journal of East European Management Studies, Vol. 18, N.º 1, pp.97-134. Stock, R. M., Six, B. and Zacharias, N. (2013) ‘Linking multiple layers of
innovation-oriented corporate culture, product program innovativeness, and business performance: a contingency approach’, Journal of the Academy of Marketing Science, Vol. 41, N.º 1, pp.283-299.
Tanfous, M. B. (2013) ‘The contribution of intangibles to value creation’, Journal of
Business Studies Quarterly, Vol. 5, No. 1, pp.43-75.
Tahinakis, P. and Samarinas, M. (2013) ‘R&D Expenditures and Investors’ Perception for an Input on Innovation Creation and Firm Growth: Empirical Evidence from Athens Stock Exchange’, The Journal of Applied Business Research, Vol. 29, N.º 1, pp. 125-137. Tudor, A. T., Dima, S., Dima, B. and Ratiu, R. V. (2014) ‘The linkage between intangibles
and profitability’, Annales Universitatis Apulensis Series Oeconomica, Vol. 16, No. 1, pp.283-293.