Dissertation
Master in Civil Engineering – Building Construction
Construction ceramic materials using ash waste from
thermal power plants
Zadora Pavel
Dissertation
Master in Civil Engineering – Building Construction
Construction ceramic materials using ash waste from
thermal power plants
Zadora Pavel
Dissertation developed under the supervision of Candidate of Engineering Sciences Parfenova Lyudmila, head of the department of building production of the Polotsk State University and Doctor Florindo Gaspar, professor at the School of Technology and Management of the Polytechnic Institute of Leiria.
I
RESUMO
Os materiais cerâmicos para paredes ocupam uma posição de destaque no mercado da construção devido às suas propriedades físico-mecânicas, térmicas, durabilidade, respeito pelo meio ambiente e expressividade arquitetónica. A indústria de materiais cerâmicos para a construção é uma das indústrias de maior consumo de energia.
Na quantidade total de combustível consumido na construção, os custos na produção de tijolos cerâmicos são de 4,6%, portanto, o uso racional de combustíveis, matérias-primas e outros recursos materiais está-se a tornar num fator decisivo na competitividade dos materiais cerâmicos no mercado da construção civil.
A cinza de carvão é um subproduto da queima de carvão mineral em centrais termolétricas. Este resíduo é responsável por muitos problemas ambientais, pois polui o solo, a água e o ar. Portanto, é importante encontrar maneiras de reutilizá-lo.
A este respeito, a questão do uso de resíduos de cinzas e escória de usinas térmicas na produção de cerâmica de parede torna-se urgente.
Palavras-chave: cerâmica, argila, cinza, matérias-primas, produção, resíduos
II
ABSTRACT
Ceramic wall materials occupy a leading position in the construction market due to their physico-mechanical, thermal properties, durability, environmental friendliness and architectural expressiveness. The industry of ceramic building materials is one of the most material and energy-intensive industries.
In the total amount of fuel consumed in the construction complex, the costs for the production of ceramic bricks are 4.6%. Therefore, the rational use of fuel, raw materials and other material resources is becoming a decisive factor in the competitiveness of ceramic wall materials in the construction market.
Coal ash is a by-product of the burning of mineral coal in thermal power plants. This residue is responsible for many environmental problems because it pollutes the soil, water and air. Therefore, it is important to find ways to reuse it.
In this regard, the issue of using ash and slag waste from thermal power plants in the production of wall ceramic products becomes urgent.
The aim of the master's thesis is to develop compositions and study the properties of a ceramic crock using ash waste from Thermal Power Station.
The main results of the work: The influence of the Stahiment 2000 MZh30 superplasticizer on the strength and density of a ceramic crock from clays of the Osetka deposit was studied, the results on the physic-mechanical characteristics of a ceramic crock containing ash waste from the Belorussian Thermal Power Station Orekhovsk were obtained.
III
List of Figures
Figure 2.1 – Structural model of ideal closed packing ceramics: Filler - yellow;
matrix - brown.………..………..…..7
Figure 2.2 - Specific energy consumption in the production of ceramic bricks in different countries (in parentheses are the years of construction / reconstruction companies)……… ………..…....10
Figure 3.1 – Furnace chamber, model PKC-30 /12.5………..…..….…….17
Figure 3.2 – Testing of ceramic samples in the press SGP - 500MG4A………….17
Figure 3.3. - Workplace in experiments on water absorption………..…...18
Figure 3.4. - Workplace in the determination of shrinkage……….20
Figure 4.1 – Schematic representation of the dispersion process of polycarboxylate esters of MelfluxR ………..21
Figure 4.2 – Scheme of electrostatic interaction of clays and particles in an acidic medium ………..……….21
Figure 4.3 – Model of the formation of hydrogen bonds in the clay system, plasticized with hyperplasticizers on the basis of polycarboxylates …………...22
Figure 4.4 – The typical fracture of the ceramic sample ……….……..…25
Figure 4.5 – Density results for the three first compositions ……….28
Figure 4.6 – Strength results for the three first compositions ………29
Figure 4.7 – Density of samples of the fourth composition ………..…30
Figure 4.8 – Strength of samples of the fourth composition ………...30
Figure 4.9 – Water absorption of different compositions ………..34
Figure 4.10 – Graph of water absorption of the samples fourth composition…....35
Figure 4.11 – Graph of shrinkage samples of third compositions………..38
IV
List of Tables
Table 2.1 - Models structures ashceramic compositions such as "core-shell"…….8
Table 3.1 - Chemical composition "Osetki" clay deposit...13
Table 3.2 - Characteristics of sand……….14
Table 3.3 - Grain composition of sand………...15
Table 3.4 - Grain size distribution fireclay……….15
Table 3.5 - Features peat and wood bottom ash……….15
Table 3.6 - Chemical composition of the mixture of ash Belarusian (TPPs) (wt.%) ……… ………..16
Table 4.1 - Strength and density of the modified ceramic samples …………...23
Table 4.2 - Density and strength of the ceramic samples of the first composition………...……….25
Table 4.3 - Density and strength of the ceramic samples of the second composition………..………...26
Table 4.4 - Density and strength of the ceramic samples of the third composition……….………..27
Table 4.5 - Density and strength of the ceramic samples fourth composition…...29
Table 4.6 - Water absorption of the first composition………....31
Table 4.7 - Water absorption of the second composition………...32
Table 4.8 - Results of water absorption of the third composition………...32
Table 4.9 - Results of water absorption fourth composition………...34
Table 4.10 - Shrinkage first composition………....35
Table 4.11 - Shrinkage second composition………...36
Table 4.12 - Results of shrinkage of the third composition………..…..37
V
Contents
RESUMO I
ABSTRACT II
LIST OF FIGURES III
LIST OF TABLES IV TABLE OF CONTENTS V 1. INTRODUCTION 1 1.1. GENERAL 1 1.2. OBJECTIVES 1 1.3. STRUCTURE 2
MODERN REQUIREMENTS FOR RAW MATERIAL COMPONENTS AND 2. TECHNOLOGIES FOR THE PRODUCTION OF WALL CERAMIC 3
2.1. The influence of the chemical composition of clay wall on the quality of ceramic products 3
2.2. Eligibility angry TPP for the production of wall ceramic materials 4 2.3. Principles of forming a matrix structure of ceramic materials based on natural and man-made materials 7
VI
PREPARATION OF SPECIMENS AMD TESTING PROCEDURE 13
3. 3.1. Characteristics of used materials 13
3.1.1. Source materials 13
3.1.2. Methods of research 16
INVESTIGATION OF PHYSICAL-MECHANICAL 4. CHARACTERISTICS OF CERAMIC SAMPLES USING ASH WASTE 20
4.1. Modification of clay raw materials surfactant additive 20
4.2. The effect of ash waste on the physicomechanical properties of a ceramic shard 24
4.2.1. Influence of ash waste of thermal power plants on the density and strength of the ceramic shard 24
4.2.2. Influence of ash waste from thermal power plants on the water absorption of a ceramic shard 31
4.2.3. Influence of ash waste of thermal power plants on the shrinkage of ceramic shards 35
4.3. Chapter summary 40
5. CONCLUSIONS AND FUTURE DEVELOPMENTS 41
5.1. Conclusions 41
5.2. Future developments 41
1
1. INTRODUCTION
1.1 General
Coal ash is a byproduct of mineral coal combustion in thermal power plants [1, 2]. Its physical and chemical characteristics depend on the origin of the coal as well as its burning process in the power plant [3]. However, the main chemical elements usually found in coal ash are silicon, calcium, aluminum, iron, magnesium, sulfur, carbon, and several trace elements [4]. Based on the burning process, coal ash is divided into three types: slag, bottom ash, and fly ash [5]. Fly ash is a residue collected by electrostatic precipitators, mechanical filters, or it is simply ejected into the atmosphere [6]. It is composed mainly of hollow spherical particles known as cenospheres, which are parti-cles of low density generally formed by glassy aluminum-silicate matrix, quartz, mul-lite, calcite, and magnetite [7]. Fly ash represents around 70% of the coal ash produced by thermal power plants [8]. The presence of this residue in the environment is highly detrimental as it pollutes soil, water, and air. In addition, it modifies the composition of the environmental medium through the insertion of potentially toxic substances [9]. However, based on its chemical composition, fly ash has been used as additive in the manufacture of cement and concrete, conventional ceramics, and vitroceramics, among other uses [10].
1.2 Objectives
The purpose of the master's thesis is to develop compositions and study the proper-ties of a ceramic materials using bottom ash waste from Thermal Power Plants (TPPs).
To achieve this goal in the work solved the following tasks:
1. The analysis of requirements for raw materials and production technology of brick ceramic materials;
2. The effect of superplasticizer Stahiment 2000 MZh30 on the physicomechani-cal characteristics of ceramic materials has been studied;
3. The effect of bottom ash wastes on the density, strength, water absorption and shrinkage characteristics of a ceramic specimen has been studied;
4. The selection of charge mixtures with the use of bottom ash waste from Ther-mal Power Plants (TPPs) was carried out and the physicomechanical characteristics of the ceramic material were determined.
2
1.3 Structure
Present research work consists of 5 chapters. Chapter 1 contains the introduction, objectives and structure of the work done.
Chapter 2 is devoted to the requirements for raw materials and technology for the production of ceramic bricks, shows the influence of the chemical composition of clay on the quality of ceramic products, and energy saving in the production of ceramic bricks.
Chapter 3 describes the basic materials, their characteristics and sample prepara-tion, shows the test procedure and describes the research methods.
The main experimental work is described in Chapter 4. In this part, clay materials are modified using surface-active additives, and physicomechanical characteristics (density, strength, water absorption, shrinkage) of ceramic samples using ash waste are studied.
Chapter 5 outlines the conclusions on the work done and the results obtained, sug-gestions for further research on this topic.
3
2. REQUIREMENTS FOR RAW MATERIAL
COMPO-NENTS AND TECHNOLOGIES FOR THE
PRODUC-TION OF CERAMIC BRICKS
2.1 The influence of the chemical composition of
clay on the quality of ceramic products
The raw material for the manufacture of ceramic materials are clay rocks. The composition of clays include various oxides (AI2O3, SiO2, Fe2O3, CaO, Na2O, MgO and
K2O), the free and chemically bound water, and organic impurities [11].
The most important component of the raw material in the manufacture of clinker is alumina (Al2O3). It reduces the melt viscosity, and its content is sufficient to reduce
the deformation of the material during firing. Fusible brick clays are composed of an insufficient amount of Al2O3, the content is increased by adding the charge kaolinitic
clays. The optimal content of Al2O3 in the mixture of 17-25% [12].
Clays must not contain iron oxide (Fe2O3) more than 6-8%, as in the firing
pro-cess, trivalent iron oxide under the influence of a reducing environment at 1000 °C in-tensively proceeds at a bivalent iron oxide FeO (oxide) which rapidly reacts with the silica, forming a fusible phaelite (2FeO x SiO2) [12].
As a result, a solid crust is formed in the products near the surface, which pre-vents the removal of carbon dioxide. To burn carbon, it is necessary to reduce the heat-ing rate of bricks in the range of 900–1100 ° С. If these conditions are not met, then the deposited carbon can cause blistering on the surface of the product. [12].
Iron oxides have an effect on product color after firing. Depending on the ratio of Fe2O3 and FeO colored products from cherry red to dark purple [11].
The clays should contain calcium oxide is not more than 7-8%. Elevated levels of CaO in the clay sintering causes a decrease interval. Carbon dioxide formed by the de-composition of CaCO3, may increase the porosity of the product. With increased CaO content in the clay in the beginning of the sintering process can be slow shrinkage or expansion, followed by the formation of a liquid phase - a sharp melting and defor-mation of the products, especially under load (lower rows of cages bricks) on the sin-tered surface blistering. It is necessary to CaO in clay was in a finely distributed state [13].
Magnesium oxide (MgO) in the clays should be 3-4%. In clays containing the MgO, sintering interval is greater than for the same content in their CaO. A significant drawback of magnesian clays is that they have a relatively high shrinkage. [13]
4
The alkali metal oxides (Na2O; K2O) are in ceramic clays in an amount of
1.5-4.5%. With insufficient sintering or firing temperature is too high the composition must be adjusted by the addition of fluxing agents [13].
To assess the quality of raw materials, the clay silica module is used. Good clay for the manufacture of clinker are characterized by silica module 3-4.5. At its high val-ue, the fragility of the products increases, their strength and frost resistance are reduced. At low - there are difficulties with the release of clinker, since the sintering interval dur-ing the firdur-ing process decreases, the likelihood of deformation increases. From the point of view of the mineral composition, clay with a polymineral composition, that is, con-taining various clay components that have different dispersion and fire resistance, has an advantage. It was established that the presence of minerals of the kaolinite group should be within 20–30%. With a high content of montmorillonite (more than 30%), coolants must be added. Difficulties can arise with increased (over 10%) hydromica content. In this case, the sintering interval decreases and rapid deformation occurs at the maximum firing temperature.[11].
The remaining clay minerals in the clay brick are available in small quantities and do not have significant effect on the process . Presence of unacceptably large inclusions carbonates as free oxides formed during calcination of calcium can cause a change in volume, cracking and even destruction products by reacting with atmospheric moisture. Harmful impurities in the clays are some iron compounds such as pyrite and siderite, occurring in the form of large inclusions. Oxides and hydroxides of iron in a finely di-vided state are not harmful impurities [11].
By granulometric composition, finely dispersed clays are more suitable, since the finest fractions contain the largest number of smoothers; plasticity - medium plastic clay. To obtain high-quality clinker from a clay mixture with a small sintering interval (60–90 ° С) in a tunnel furnace with a channel height of 1.85 m, where it is impossible to create a uniform temperature field, it is necessary heating, sintering and cooling products to produce very slowly (at least 138 h) at low thrust in a redox medium [13].
2.2 Eligibility angry TPP for the production of wall
ceramic materials
In should be considered the chemical and mineralogical composition of the ash thermal power plants as the first criterion. In terms of chemical and mineralogical com-position, ash TPPs are close to clay raw materials used for making bricks. The function-al suitability of ash in the manufacture of ceramic materifunction-als in [14] proposed to deter-mine the ratio of the oxides Fe2О3/CaО+MgО, SiО2+Al2О3/Fe2О3:
5
- when the content of Fe2О3/CaО+MgО more than 1, and SiО2+Al2О3/Fe2О3 less
than 2 by-product refers to sintering intensifier;
- when the content of Fe2О3/CaО+MgО less than 1, SiО2+Al2О3/Fe2О3 greater
than 2, byproduct - depletion.
To ashes used as additives in the production of wall of ceramic products must meet the following requirements [15]: the amount of SО3 does not exceed 2% of the
to-tal weight, and slag inclusions larger than 3 mm - 5%. Inadmissible inclusions larger than 1 mm in the form of a dense stony grains. Fluctuations in the ash content of the fuel should be as low and does not exceed ± 4% of the mean value taken.
The chemical composition of ash from thermal power plants allows them to be used not only as supplementary materials, but also as the main raw materials. Ash is produce from the ceramic mass, consisting of 60-80% of ash, 10-20% clay and other additives. Installed [15] that based ash with high amount of aluminum oxide and silicon (75-95%) can be receive ceramic wall materials, characterized by a sufficiently high compression strength (10-60 MPa); the compressive strength of the ceramic material based ash with low content of the amount of said oxides (30-50%) is only 2.6 MPa. Low content of oxide А12О3 and SiО2 in the ash complicates the process of firing due to
the low sintering interval, and a lower melt viscosity leads to uneven firing of products. Significant impact on the structure formation processes ashceramic materials have significant variations CaO content provided by the inclusion of carbonate and the free calcium oxide. Installed [15] that ash containing up to 4.5% CaO, can be used as a feedstock without preliminary grinding in-line with the fine grinding rollers which ena-ble grind carbonate inclusions. Ash with a high content of CaO necessary to pre-grind the carbonate inclusions size not exceeding 1 nm. Ash containing CaO 30-50%, are un-suitable for ashceramic materials. The processes of moistening and processing mixtures based on ashes with a high content of calcium oxide are accompanied by an exothermic hydration reaction, the heat of which causes the mass to dry and, as a result, to disperse it, which complicates the process of forming products.
The criterion for efficacy is ash additives and their dispersity. Studies [16] showed that the ceramic samples with 60% ash content in the mixture dispersity 1800 cm2 / g have a compressive strength within the 19 MPa, and replacement with more disperse ash (2700 cm2 / g) has increased the value of compressive strength to 26 MPa. When the semidry method of forming the growth compressive strength of the ceramic samples was observed using a ash with a specific surface not more 2700-3000 cm2 / g. When the content of ash powders disperse more in the mixture strength is little reduced. This is explained with the features of compaction of raw semidry process production, namely the removal of air from the raw. local stresses within the crude can be formed by pressing high dispersion powders, due to the inability of excess air output by creating a dense structure composed of particulate molding powder of small dimensions, in the early stages of compression. Thus, it was concluded that the use of ash with a specific
6
surface 2700-3000 cm2 / g in the production of wall of ceramic products by dry press-ing maybe come ineffective.
The compressive strength in the raw state fresh molding using crushed ash charge consisting of (TPPs) is increased as compared with the ashes to grinding, due to [16] the physical layout characteristics of a powder having a high dispersibility. It is noted that a more dense packing of the press powder can reduce the number of pores and their size. With the destruction of large ash aggregates are formed during grinding non-glassy open pores in the particles, thereby enhancing the ability to retain moisture and as a result, somewhat improving formability and plastic raw materials [16].
Density ashceramic samples with increasing content of ash (TPPs) in the charge decreases linearly. This effect is due to peculiarities of the ash powder, porous particles which are not subject to structural changes in the process of calcination at 975-1000 ° C, since obtained at higher temperatures (1200-1600 ° C) [16].
In determining the optimum ash content in the charge should take into account its calorific value and the plasticity of the clay material used. It is known [17], that the troduction of the ash into a mass of highly plastic clays effectiveness of the additive in-creases when large quantities of ash 40-50%. When this product is sufficiently high strength, and the bulk mass considerably decreases. The optimum amount of ash intro-duced into the medium plastic clay is about 30%. Input ash in weight of low plasticity clay in quantities of 10-20% provides improved molding properties and drying mass, increased strength of the products, while achieving fuel economy of about 20% [17].
When using ash must also consider its grain (grain size) composition. The fine grained ash fraction increases the exit of raw fractured. In this case, in order to reduce spoilage in dried additionally introduced leaner grain size of 0.2-0.3 mm. The required ratio of coarse to fine grained ash leaners decreases with increasing clay sensitivity co-efficient when drying from 3: 1 to 1: 1. The fine grained ash, deteriorating the drying characteristics of raw, however, increases the strength of the finished articles with clay-ey rock during firing. As depletion additive ash additive mixture is most effective with a maximum grain size of 1.5 mm and a fraction content of less than 0.3 mm, no more than 30% [17].
Application area ash TPPs in the manufacture of wall of ceramic materials is de-fined as the softening temperature and fuel content. So, for the manufacture of corpulent and hollow blocks of brick and ceramic stones recommended use ash softening tem-perature to 1200 ° C. Ashes and slags containing up to 10% of the fuel, used as addi-tives depletion, and 10% or more - as a fuel-containing [15]. With burnout unburned particles contained in the ash in articles formed semi-closed and closed pores. Their walls are wetted by the glass phase formed through the interaction of components ash-clay mixture that provides strength and frost resistance ashceramic wall materials, re-duces their bulk mass, thermal conductivity, gas permeability improves crock and firing conditions. Due to the presence in the ash of finely divided fuel combusted in the body
7
and contributes to a uniform raw roasting , improved product quality and is completely eliminated coal input into the charge that allows to save fuel [15].
Thus, the effectiveness of ash (TPPs) in the production of ceramic materials is de-termined by the following criteria: chemical and mineralogical composition of the ashes (TPPs), dispersion and particle size distribution, the content of unburned fuel, plasticity clays used.
Preparation of high quality on the basis of the most widespread method of mold-ing plastic articles ashceramic requires improvement and regulation of the directional properties of the raw clay. One effective way is the use of plasticizing additives, allow-ing to give the necessary formability in the manufacture of the product and a mechanical strength sufficient for further operations molded article [18].
2.3 Principles of forming a matrix structure of
ce-ramic materials based on natural and man-made
materials
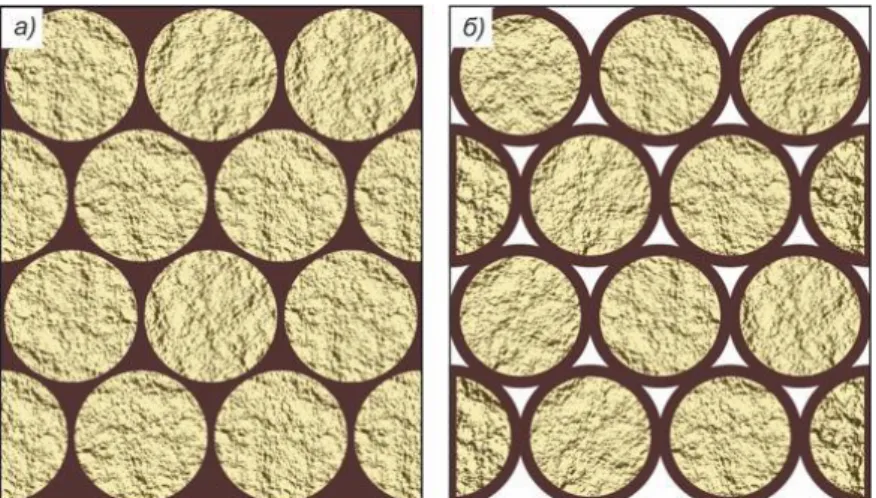
In [19] proposed models of the structure of ceramic brick plastic molding (Figure 2.1, a) and semi-dry pressing (Figure 2.1, b) of waste. Obtained two parts ceramic crock: matrix which is a product of high temperature reactions binder (activated clay material) and macro aggregate in aggregated waste enclosed therein. The ratio of their volumes is determined by the size distribution and packing of the macro-filler grains. Based on the model structure of ceramic products illustrated in Figure 2.1, the authors of [19] found that the matrix volume is 25.95% of the total in the case of a dense pack particulate filler with a coordination number of 12.
Figure 2.1. - Structural model of ideal closed packing ceramics: Filler - yellow; matrix - brown
8
Thus, it was shown [19] that in the case monofractional filler composition (waste) to obtain a composite ceramic material requires approximately 30% clay binder. In less dense packing of the grain aggregate amount of binder needed for filling intergranular spaces increases.
When dry pressing (Figure 2.1, b) a ceramic product the matrix structure from the technological mineral raw materials, the required amount of clay binder will be less than 25%, if the relationship between coating thickness and diameter of the pellets will be closer to 0.05. In accordance with the considered model (Figure 2.1, b) in [19] conclud-ed that ceramic matrix composites can be preparconclud-ed by combining the particulate matter waste into individual aggregates of clay coating substance followed by compression products, their drying and firing. It was observed during firing that the dispersion envi-ronment will produce a liquid phase which are embedded in a peripheral zone of the dispersed phase after crystallization should form a solid matrix structure.
In source [20] pattern composed of structures of the "core-shell", taking into account the average size of the particles microdispersed raw ash and density raw (Table 2.1).
Table 2.1. - Models structures ashceramic compositions such as "core-shell" [20]
Numb -er Specific surface ash aggregates (cores) cm2 / g Compo-nent com-position: core / shell (ash / clay) Particle size ra-tio: core / shell Scheme of the particle location Structure model after firing Porosi ty ,% 1 2700 60/40 4/1 14 2 4000 50/50 2/1 17 3 900 60/40 20/1 26
According to the models shown in Table 2.1, the formation ashceramic structure based on the principle enveloping refractory ash particles formed from the initial melt fusible clay fractions while contraction ash aggregates adhesion forces between an alu-minosilicate melt into a single monolithic structure.
9
Comparing ashceramic model structures shown [20] that when using a dispersed sol with a specific surface of 2700 cm2 / g is more dense packing low plasticity parti-cles that leads to formation of a solid monolithic structure. Further studies carried out in [20] confirmed increase compressive strength (R) ceramic samples of 80-100% and a decrease in the overall shrinkage of the ceramic piece by 20-30% by increasing the packing density of the raw mix to 10-15% when using sol with a specific surface area of not more than 2700- 3000 cm2 / g. in an amount of 40-60%.
2.4 Energy saving in the production of ceramic
brick
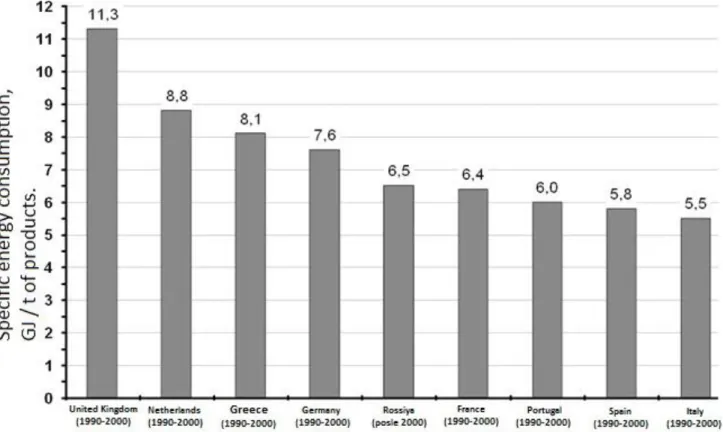
Ceramic wall materials due to high consumer properties are widely used in con-struction. Production of wall ceramic materials in the Republic of Belarus is carried out: «Minsk PFP" , "Gorynsky KSM", "Radoshkovichsky-fault" , "Loev KSM", "Ceramics" (Vitebsk), Ceramic Plant "Keramin" , «Brest KSM", "Obol ceramic plant», «Stolbtsy ceramic factory" and a few other seasonal businesses with annual capacity of 1-3 mil-lion units bricks. The costs of technological fuel for production range from 143 kg fuel. "Radoshkovichi" and "Keramin", up to 260 kg - "Ceramics" and "Gorynsky KSM". Average electricity consumption for production of 1 thousand units bricks from 95 to 164 kW⋅h [21]. Manufacturers of ceramic bricks, working in Western European coun-tries have a much lower specific energy consumption. A comparison of the specific en-ergy consumption, typical of ceramic brick producers operating in different countries are shown in Figure 2.2 [22].
10
Figure 2.2. - Specific energy consumption in the production of ceramic bricks in differ-ent countries (in pardiffer-entheses are the years of construction / reconstruction companies)
In the production of ceramic bricks are two main methods used in the production plants of the republic: the method of dry pressing and plastic forming method. Due to the fact that most of the fields of the republic is represented by low-melting clays, the most widely used method of molding plastic.
The technology of production of ceramic bricks "worked out " and is represented in detail in the literature [23]. The main process steps: mining of clays and the prepara-tion of the charge; forming and drying bricks; burning. The use of plastic molding method involves the preparation of a clay mass with a moisture content of 15-20%. Al-so, various additives are used. The additives may be waste coal or any local waste (e.g., ash, coal waste mining). The amount of additives is about 30% [23].
Pieces of clay thoroughly pulverized to a size of 100-150 mm, and then using special conveyors set of rollers are sequentially further grinding the clay mass (up to 1 mm in size) and removal of small stone inclusions. Then, in a mixer with filter grille clay mass is moistened and thoroughly mixed. The amount of moisture is adjusted to 18-25%. The mixer is admixed to the clay additive required. At completion of the first stage of press mold timber, the preform bricks future [23].
In the second phase the molded timber is cut into separate products, the so-called brick raw. Can not directly burn raw bricks, since, at this stage it has a very high mois-ture content and a crack during firing. Therefore the bricks is first dried, the drying pro-cess is mandatory. At this time, moisture contained in the product is moved from the interior to the surface, comes into contact with the warm air and evaporates. As a result
11
of evaporation of water is freed space between the clay particles. It occurs volume re-duction product shrinkage. drying and firing temperature, and the temperature rise rate play an important role in the manufacture of bricks. The moisture begins to evaporate by heating the product in the temperature range 0-150 ° C. When the heating tempera-ture reaches 70 ° C, vapor pressure can reach critical values, which in turn lead to crack-ing. The recommended rate of growth temperature 50-80 ° C in hour. The rate of evapo-ration of moisture from the surface will not outperform rate of vaporization within the article. After completion of drying bricks are sent to a special firing furnace [23].
The final step in the manufacturing process of plastic molding bricks by - firing. Brick raw sent to the oven, while still having a small amount of water, about 8-12%. Therefore, at the beginning of roasting occurs final drying bricks. Then, at temperatures 550-800 ° C, dehydration starts clay minerals. The crystal lattice of minerals breaks down, resulting in lost plasticity of clay, there is product shrinkage. In the temperature range of 200-800 ° C are allocated volatile organic impurities and the clay additive. In this firing temperature rise rate attains a value of 300-350 ° C per hour. Next, while the temperature is maintained until complete carbon burnout. Further increase in ture, over 800 ° C, leads to a structural change of the product. At this stage, the tempera-ture increase rate is 100-150 ° C in hour brick and 200-220 ° C in hour hollow. Once it reached the maximum firing temperature, maintaining the temperature occurs, for uni-form heating of the entire product. Then begin to lower the firing temperature at 100-150 ° C. In this case, the bricks further shrink and deformed. By achieving temperatures below 800 ° C cooling rates reach values in the 250-300 ° C in hour. Time per batch calcination products under these conditions is approximately 6-8 hours. After firing, the product structure is changed. Now it stone-like subject, waterproof, durable, resistant to temperature changes, as well as possessing other useful properties [23].
Analyzing the brick manufacturing technology from the standpoint of energy consumption, it is obvious that the main fuel consumers are driers and heaters. The heat of combustion fuel consumed in their physicochemical transformations in the green body and different compensation of heat losses in the unit. heat loss physicochemical transformations defined by the feed and its state, and compensation costs depend on the organization of the drying and firing processes and the losses in themselves aggregates structures [24].
Reduced energy consumption in the modern ceramic technology is not possible without optimization of drying, including the increase in speed, thermal efficiency and lower losses. It is noted [22], which in all processes, except for long and mild drying conditions must be carefully controlled heating rate, air recirculation mode, the tem-perature and humidity of the drying. Hot air driers supplied mainly from gas burner or furnace cooling zone. Ceramic mass may have differing sensitivity to drying (drying a sample of the inability of a given mass without cracking), but in overwhelming majority beneficial effect preheating in high humidity conditions (with minimal or no removal of
12
moisture), followed by primary drying step and a hot dry air. Residual moisture is re-moved from a semifinished particularly hard, most demanding application of dry and hot air.
Main energy consumption associated with the firing of ceramic products. Calci-nation is carried out in ovens, it may be furnace hearth furnaces and bell furnace, annu-lar furnace (furnace Hoffman), roller furnaces, rotary kilns or tunnel kilns. Most full industrial production technology correspond tunnel furnace [22].
Tunnel kilns are constructed of refractory material tunnels, which are laid rails for moving the trolleys. On trolleys arranged refractory shelves where in a certain order are the product. Trolley is pushed along the furnace at regular intervals against the move-ment of air pumped by one or more fans in the exhaust duct near the mouth of the fur-nace. Most modern tunnel ovens heated gas, the maximum temperature generated in the furnace near the center of the firing zone. As part of its movement cage warmed by hot flue gases, and the exiting cooled by blowing air supplied into the furnace, which thus heated. Part of the air from the cooling zone to adjacent dryers selected to provide sub-stantial fuel savings. furnace channel is isolated from the inflow of air from undercar-riage space with the sand valve to reduce power consumption by creating a sealed fur-nace working space. In some cases, tunnel ovens, equipped with specific types of transport devices (e.g., the shuttles-containers) are used for the firing of raw materials and products of technical ceramics [22].
Indisputable advantages tunnel furnaces are continuous cycle of high perfor-mance, possibility of automation of the firing process. Disadvantages: material con-sumption, inertia uneven firing wasteful loss of heat loss from outgoing flue gases with the heated product and trolleys et al. [24].
In [24] are the following major ways of improving the design and operation of thermal tunnel furnaces:
- the development of individual projects furnaces for specific fields and technolo-gies;
- Development and application of high-speed modes of drying and calcination; - improving the quality of fuel combustion;
- application of new efficient burners and pulsed heating systems; - optimizing a workspace furnace cages and brick;
- reducing thermal inertia and heat losses through the walls and the roof, with the trolleys and ready brick;
- the application of new effective refractory and thermal insulation materials; - the use of RLS control the firing mode.
Modern technology allows resource use various technological industry waste in manufacturing ceramic wall without deterioration. For example, as can be used deple-tion slag and fly ash, milled ceramic production waste (fireclay) burnt rock overburden.
13
To reduce the density of the raw ceramic mass is introduced burnable various organic additives - waste coal, sawdust, ground bark, peat litter.
Chemical and mineralogical composition of the charge and the introduction of the additives have a significant impact on power consumption. For example, the presence in the mixture of 8% - 10% is sufficient coal dust to conduct firing energy by the combus-tion of the organic additive. Substantial savings of fuel firing is achieved with the intro-duction into the batch for the porization sawdust, as well as when using so-called "car-bonaceous" clays characterized by increased content of organic compounds. At the same time with an increase in raw materials limestone and clay components required increased fuel consumption for the endothermic decomposition reactions hydroalumino-silicates and carbonates. Therefore, depending on the type of raw energy consumption may vary significantly regardless of what equipment is equipped with a factory and what technology is used [22].
Generalization of the best technologies in the manufacturing of ceramic products [22] showed that the reduction of energy consumption in the production of ceramic products can be achieved by applying a set of technological solutions and techniques.
3. PREPARATION OF SPECIMENS AND TESTING
PROCEDURE
3.1 Characteristics of the materials
3.1.1 Source materials
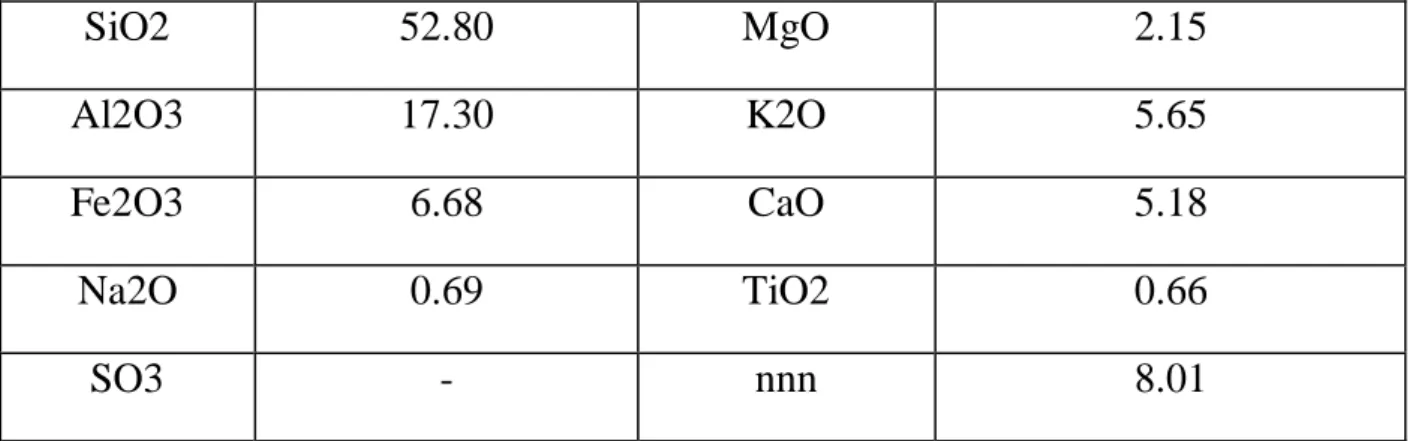
Clay raw material from "Osetki" field was used for the experimental research. The clay feedstock from "Osetki" field has a heterogeneous coloration, lumpy dense structure, soaks well in water. Quarry humidity is 22-32%. Plasticity number 13,7-23,3. Sintering interval 50 ° C. The chemical composition of clay is given in Table 3.1.
Table 3.1 - Chemical composition "Osetki" clay deposit*
14 SiO2 52.80 MgO 2.15 Al2O3 17.30 K2O 5.65 Fe2O3 6.68 CaO 5.18 Na2O 0.69 TiO2 0.66 SO3 - nnn 8.01
*results given by the manufacturer OAO «Keramika», Vitebsk, Republic of Belarus. The clay feedstock (Table 3.1) the content of the alumina belongs to the group of semi-acid clay (Al2O3 ≥ 15%). The calcium and magnesium oxides contained in it are found as carbonate compounds, which, like iron oxide, are a fluxing component of the raw. These compounds, in combination with alumina, indicate fusibility of clay, which can play a positive role in the formation of the structure of a ceramic product using the ash of (TPPs) due to the formation of the initial melt at the initial stages of firing.
Used sand satisfying the requirements of GOST 8736-2014 [25], whose characteristics are listed in Table 3.2.
Table 3.2. - Characteristics of sand* Bulk density, kg / m3 Density grains kg / m3 Content silty and clay particles,% Voidness, % Humidity, % 1567 2650 0 39.2 5.26
*results given by the manufacturer OAO «Keramika», Vitebsk, Republic of Belarus. Quality was assessed on the sand GOST 8736-2014[25]. Determination results of grain composition are presented in Table 3.3.
15
Table 3.3. - Grain composition of sand
Hole sizes sieve, mm 2.5 1.25 0.63 0,315 0.16 less than 0.16 Sieve residue % 3.0-6.0 1.0-6.0 2,0-7,0
20,0-30,0
25,0-35,0 25,0-40,0 *results given by the manufacturer OAO «Keramika», Vitebsk, Republic of Belarus.
According to test results the sand belongs to the group of middle-class II module size Mach = 2.23.
As used fireclay ground combat inappropriate production of ceramics after firing and sushi. Grain size distribution is shown in Table. 3.4. Chamotte Bulk density - 1004 kg / m3. Relative humidity - no more than 3%.
Table 3.4. - Grain size distribution fireclay Fraction grains, mm 5 - 3 3 - 2 2 - 1 1 - 0.5 0.5 - 0.25 less than 0.25 Mass fraction of grains fraction,% 7.1 20.5 35.4 12.3 13.5 11.2 *results given by the manufacturer OAO «Keramika», Vitebsk, Republic of Belarus.
As mineral additives used bottom ash Belarusian Thermal Power Plants (TPPs)
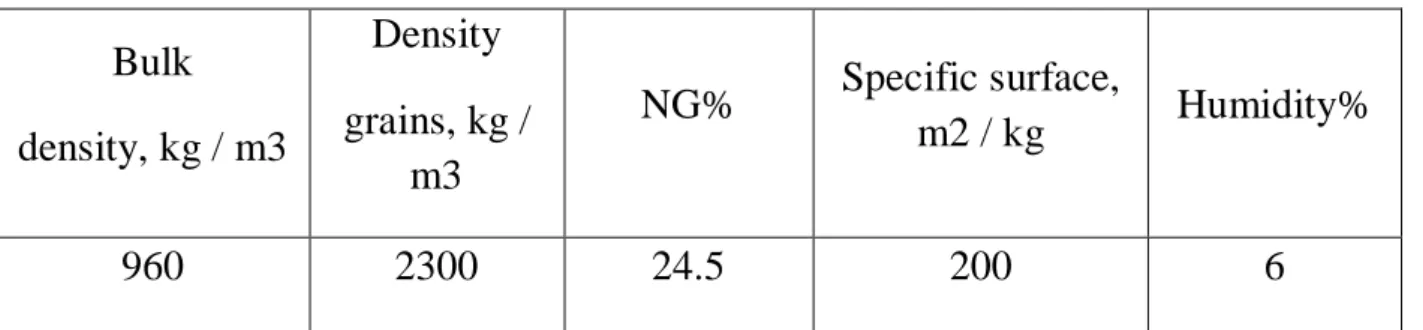
Orekhovsk Vitebsk regionand. In tests it was used a mixture of bottom ash fraction that passed through the sieve № 008 (hereinafter - ash). The additive meets the requirements of GOST 25818-91. [26]Properties peat and wood ash mineral additives are presented in Table 3.5.
Table 3.5. - Features peat and wood bottom ash Bulk density, kg / m3 Density grains, kg / m3 NG% Specific surface, m2 / kg Humidity% 960 2300 24.5 200 6
*results given by the Belarusian Thermal Power Plants (TPPs), Orekhovsk, Republic of Belarus.
16
Peat wood ash chemical composition (wt.%) In accordance with GOST 10538-87 [27] is presented in Table 3.6.
Table 3.6. - Chemical composition of the mixture of ash Belarusian (TPPs) (wt.%) SiO2 Al2O3 Fe2O3 CaO MgO Na2O K2O TiO2 P2O5 SO3 nnn 87.62 4.39 1.08 3.08 0.55 0.61 1.79 0.24 0.19 0.10 0.07 *results given by the Belarusian thermal station , Orekhovsk , Republic of Belarus .
According to the chemical composition of the mixture of ash consists primarily of silica and alumina (92%). Modulo basicity (Mo <1) relates to the mixture of ash acid [42], calcium oxide and magnesium oxide is 3.63%.
As the plasticizer used superplasticizer Stahiment 2000M ZH30 (in liquid form) [28]- a product based on polycarboxylates. Opaque liquid of light brown color. Density ranges from 1075 ± 30 kg/m3
. Hydrogen index 8 + 1.5.
Stahiment 2000M ZH30 - additive-superplasticizer (I group) of the new genera-tion based on polycarboxylates. Stahiment 2000M ZH30 used to obtain
high-mobility including self-compacting concrete mixtures, for the production of thin-walled and heavily reinforced vertically moldable products and structures complicat-ed configuration and a high degree of prefabrication. Additive Stahiment 2000M ZH30 possible to produce concretes high marks (M 600 or more) on the compressive strength of the superplastic (cast) concrete; increase mobility , to increase the initial and final strength of the concrete to increase the density; reduce the consumption of cement by 20% or more; improve the quality of the concrete; reduce energy con-sumption for steam curing; reduce or eliminate vibration during her.
3.1.2 Methods of research
The test batches were prepared by using plastic moulds of cubic shape to get specimens of the size 20 × 20 × 20 mm, which, after drying, were fired at 1000°C.
Drying was performed for 96 hours at a temperature of 100°C. Drying was carried out in an oven, model SNOL 60/300.
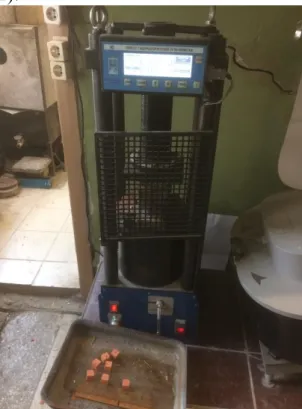
Firing was carried out in an electric furnace chamber, model PKC-30 / 12.5 of "heat sealed" (Figure 3.1).
17
Figure 3.1. - Furnace chamber, model PKC-30 / 12.5
Test specimens were tested on compression according to the standard GOST 8462-85 [29] on a test press, model PMG - 500MG4A, loading speed was of 0.25 - 5.0 kN/s.
Test press includes loading device (vertical power frame with lower hydraulic cylinder), remote control with pumping unit and measuring system. The press has a manual control of the test process and is equipped with measuring system, model SI-2-100-UHL4.2, intended to measure the test parameters (load), and for indicating the de-viation of the load speed from the reference loading rate. The load is measured by a pressure sensor (Figure 3.2).
18
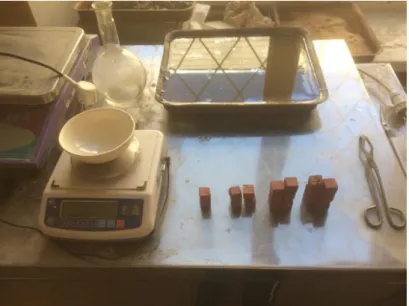
Density of the samples was determined according to the standard GOST 7025-91 [30]. Geometric dimensions were determined using a digital caliper device with measuring range of 0-150 mm. The mass of the samples was measured using electronic laboratory scales, model BK-300, for accurate measurement. Electronic balance laboratory VC-300 of the II class of accuracy of production "Massa-K" can work with several units of measurement of weight and in various modes of weighing.
Water absorption was determined from the difference between the weight of the dried sample till constant mass and the mass after immersion in water for 48 hours, in accordance to the standard GOST 7025-91 [30]. Calculation was performed according to the formula: % 100 1 2 V m m Bo (2.1) where:
m2 - saturated weight of sample, g;
m1 - dry sample weight, g;
V - specimen volume, cm3.
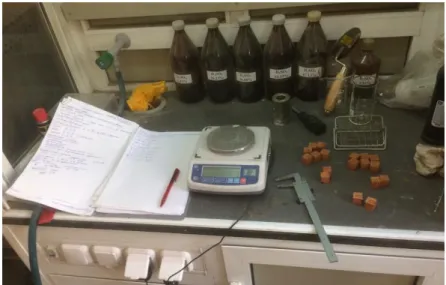
The Figure 3.3 shows the experimental workplace on the water absorption tests.
19
Features of the method for determining the shrinkage of ceramic samples. Small specimen sizes (20x20x20 mm) do not allow to predict the overall shrinkage in a
pro-duction environment. However, they allow one to study and model changes shrinkage with a change in composition in the sample. To determine the shrinkage of the samples were measured in the linear dimensions of cubes with an accuracy of 0.1 mm after molding, drying and firing. To increase the accuracy of the results was assessed non-linear and volumetric shrinkage of the samples. shrinkage is calculated according to the following formulas:
- shrinkage after drying
%
100
2 2 1
V
V
V
U
с (2.2) - fire shrinkage 100% 3 3 2 V V V Uo (2.3)- the total shrinkage
100% 3 3 1 V V V U (2.4) where:
V1 - specimen volume after moulding, cm3;
V2 - specimen volume after drying cm3;
20
The Figure 3.4 shows the experimental workplace on the determination of shrink-age.
Figure 3.4. - Workplace in the determination of shrinkage
4. INVESTIGATION OF PHYSICAL-MECHANICAL
CHARACTERISTICS OF CERAMIC SAMPLES USING
ASH WASTE
4.1 Modification of clay raw materials using
surfac-tant additives
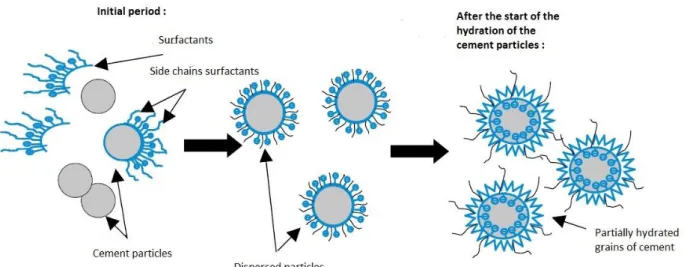
Achieving a high water-reducing effect, obtaining high-strength concrete and highly mobile, non-delaminating, self-compacting concrete mixtures in concrete tech-nology provide chemical additives of new generation plasticizers - syperplasticizers. Recent studies [20–25] have shown that plasticizers, the chemical basis of which are acrylic polymers, give the greatest effect. (MelfluxR, Stahiment 2000 and Sika ViscoCrete 5–600). The effect of these and superplasticizers is based on the plurality of electrostatic and steric (spatial) effects. The latter is achieved by hydropho-bic side chains by Polyester polycarboxylate ester molecule. In this way,
water-21
reducing effect of present plasticizers several times stronger and last longer than normal (Figure 4.1) [31].
Figure 4.1 . - Schematic representation of the dispersion process of polycarboxylate es-ters of MelfluxR
In the production of ceramic wall materials, the issues of obtaining a defect-free structure, reducing shrinkage deformations and increasing the strength characteristics of the crock after firing remain relevant. An effective way to solve these problems, as in the technology of concrete, may be the use of superplasticizers.
When considering action superplasticizers in clay systems, it should be noted that the clay particles bears is negative s-particle charge. Under certain conditions, the parti-cles separated liquid dispersion medium, together with molecular attraction, electrostat-ic interactions can occur, at about advent appearance of the partelectrostat-icles of hard dipole mo-ment [32]. The formation of a dipole momo-ment is associated with the recharging of chipped clay particles in an acidic medium and the formation of inappropriately charged ( heteropotential ) surface areas of particles (Figure 4.2), which can be followed by ad-sorption processes [32].
Figure 4.2 . - Scheme of electrostatic interaction of clays and particles in an acidic medi-um [27]
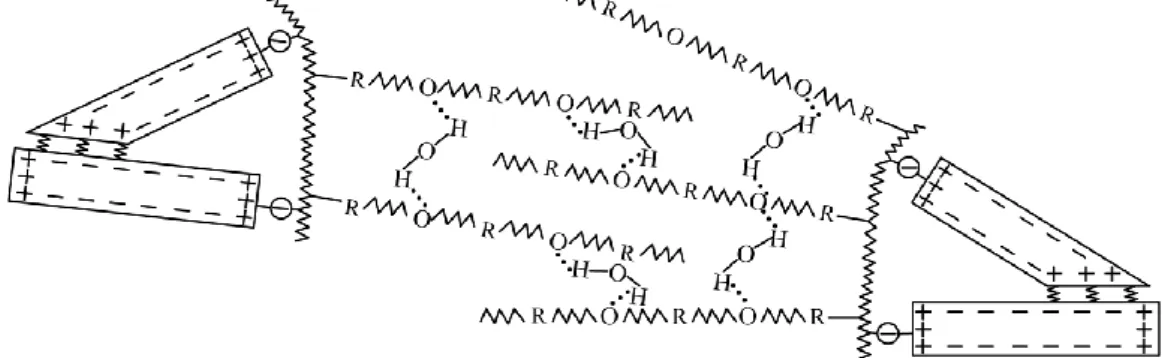
It has been suggested [33] that polycarboxylates may form hydrogen bonds in the side chains of a graft copolymer with the attraction of water molecules, which can lead
22
to the formation of gel-like layers of different thickness and density on the surface of mineral particles. In this case, hydrogen bonds can also be intermolecular, formed due to the interaction of surfactant side chains located on the surface of different clay parti-cles. The model for the formation of intermolecular hydrogen bonds assumed in [32] is presented in Figure 4.3.
Figure 4.3 . - Model of the formation of hydrogen bonds in the clay system, plasticized with superplasticizers on the basis of polycarboxylates
It is assumed [32], that the interaction of the surfactant molecules and clays and grained particles in the aqueous medium may follow three schemes: 1. Ad-sorption of the surfactant molecules at the wall capillaries; 2. AdAd-sorption of surfactant molecules from a solution onto the surface of clay particles; 3. Diffusion of surfactant solutions in the interlayer space of clay particles.
Installed [32], that the introduction of a small number of plasticizers and honors (0.01%) results in a marked improvement in their plastic properties of clay. Moreover, superplasticizers on the basis of polycarboxylates are more effective than plasticizers of previous generations. The effectiveness of lignosulfonates is manifested at high con-centrations (1%), and for some clays the was more effective than polycarboxylates.
When modifying with surfactants , along with an increase in the plasticity num-ber, for the clay mixture, an increase in its cohesion is not-ed. Introduction of plasticizing additives based polycarboxylates enhances the strength characteristics of the burning crock. However, the introduction in an amount of more than 0.01% does not lead to significant improvements in the characteristics of the burned skull.
It is known that the refinement of clay mass with quartz sand reduces the com-pressive strength of the original crock, but after the introduction of the additive it is not-ed [27, p. 182] improving the strength characteristics of the sample. Moreover, a signif-icant role in this case is played by the route of administration. Modification of the clay mass with the introduction of the additive preliminary into quartz sand showed better results than the introduction of plasticizers directly into clay.
Introduction of plasticizing additives based polycarboxylates can improve the frost resistance and lower water absorption and reduce water absorption of modified ceramic samples. Research [32] showed that clay samples made of clay without
modify-23
ing and durable additives passed 25 frost resistance test cycles. After quenching by quartz sand, the frost resistance index increased to 30 cycles. Modifica-tion of surfactants on allowed to increase this figure to 50 or more cycles of freezing / thawing. The results of the study shard, burned at 1000 ° C , showed that the water ab-sorption of the modified samples is significantly lower than that of the original. This fact is explained by [32] and it is formed by drying a grid of tiny capillaries, which cause the formation of capillaries is to increase elasticity of the walls associated with the processes of sorption and d on their surfaces surfactant molecules.
Thus, it was established [32] that superplasticizers introduced into the head and back of the charge, having the property of reducing surface tension forces by adsorbing to the surface of clay particles, exert a structuring effect in the main material at the micro level. The optimized structure of the raw material makes it possible to improve the strength characteristics, reduce crack formation of the samples at the stages of drying and firing, and increase the frost resistance of the ceramic sam-ple.
Study of the effect of superplasticizer Stahiment 2000 MZH30 the strength and density of the ceramic crock "Osetki" clay deposit was performed by administering a 30% solution of the additive directly into superplasticizer directly into clay in quantities 1%, 2%, 3% by weight of clay. The results are presented in Table 4.1.
Table 4.1 - Strength and density of the modified ceramic samples
Compositi
on number Additive name
Amount of plasti-cizing additive,% of clay mass Density Compressive strength kg/ m3 % MPa % 1 Control (without additives) - 1602 100 18.56 100 2 Stahiment 2000MZh30 1 1597 99.69 19.93 107.4 3 Stahiment 2000MZh30 2 1567 97.82 22.47 121.0 4 Stahiment 2000MZh30 3 1565 97.69 22.50 121.2 Introduction superplasticizer Stahiment 2000 MZH30 leads to a decrease of the density of the sample by about 2%, with an increase in compressive strength to about
24
20% compared with the sample without the additive. Increasing the additive amount of more than 3% by weight of clay did not further increase the strength.
It should be noted that the modification at the stage of mass preparation, reflected on the quality of the molding of products, as well as on the drying and firing process. Plasticization of clay with superplasticizer Stahiment 2000 MZh30 by introducing it in the form of a solution leads to an increase in volume, which is typical of capillary-porous colloidal systems when moistened. The reverse process, accompanied by a de-crease in size , is characteristic of firing. The removal of the additional water additive introduced into the solution from the samples is accompanied by a violation of its con-nection with the clay rock and the formation of additional pores, which obviously led to a decrease in the density of the samples. Analyzing the strength increase of the modified ceramic crock, it can be assumed that the chemical composition of the polycarboxylate ester molecule of the additive can contribute to the formation of a new mineral that is characterized by high hardness and high melting point. It should also be noted that the introduction superplasticizer and possible to improve the appearance of the samples that had a more "coherent" surface.
4.2 The effect of ash waste on the
physicomechani-cal properties
4.2.1 Influence of ash waste of thermal power plants on
the density and strength
Effect of ash on the physicomechanical properties of ceramic materials has been studied by preparing batches with different percentages of components:
- Formulation 1 - clay and ash;
- Formulation 2 - Powdered clay and ash;
- Formulation 3 - clay, fly ash and superplasticizer Stahiment 2000MZH30; - Formulation 4 - clay, fly ash, sand, and fireclay.
For each Formulation specimens were made, using plastic molds with an edge of 20 mm, which, after drying, were fired at 1000°C.
With the introduction of the ash on the specimens a color change was observed after firing to lighter shades of red. This effect can be explained by the presence of alka-li metal oxides (Na2O and K2O) in the ash, which weaken the coloring effect Fe2O3 and TiO2. It is known [29, p. 104] that alkali metal oxides (Na2O and K2O) are smooth,
25
lower the firing temperature and give the ceramic shard greater strength. In ash, they are present in the form of soluble salts. When drying products, they migrate (penetrate) through the capillaries to their surface, and after firing, they are sintered with a shard, forming whitish deposits on the outer surface of the product.
Determination results of density and strength are presented in Tables 4.2; 4.3; 4.4; 4.5, for each of the three formulations.
The Figure 4.4 shows the typical fracture of the ceramic specimen.
Figure 4.4. - The typical fracture of the ceramic sample
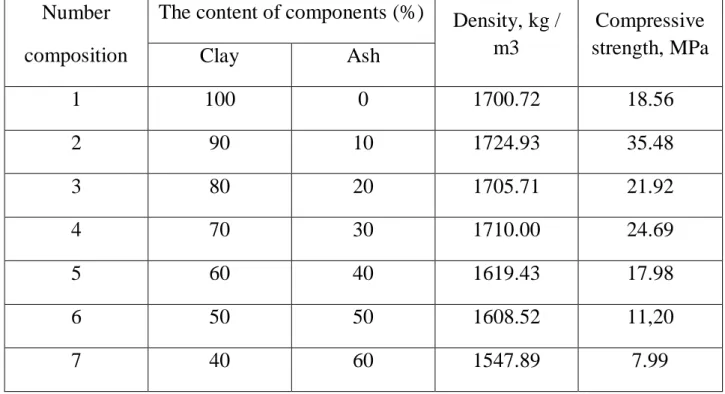
Table 4.2 - Density and strength of the ceramic samples of the first composition Number
composition
The content of components (%) Density, kg / m3 Compressive strength, MPa Clay Ash 1 100 0 1700.72 18.56 2 90 10 1724.93 35.48 3 80 20 1705.71 21.92 4 70 30 1710.00 24.69 5 60 40 1619.43 17.98 6 50 50 1608.52 11,20 7 40 60 1547.89 7.99
26
8 30 70 1522.78 5.25
9 20 80 1538.36 2.21
According to the results we can conclude that with the increase of the ash content till 30% the results gave higher density and strength than the reference sample, however for higher content of ash than 30% the density decreases, as well as the strength of the samples.
Table 4.3 - Density and strength of the ceramic samples of the second composition Number
Composition (%) Density (kg / m3)
Strength (MPa) Clay Ash (milled)
1 100 0 1918.83 18.56 2 90 10 1836.31 18.48 3 80 20 1773.06 22.89 4 70 30 1755.40 30.74 5 60 40 1720.73 29.50 6 50 50 1710.67 21.99 7 40 60 1645.42 18.27 8 30 70 1532.13 9.00 9 20 80 1501.89 4.15
In the second composition using clay and ash (milled), with an increase in the ash content, density is reduced. Compression strength increases with the increase of the ash content till 30%, giving maximum strength of 30.74 MPa, decreasing afterwards for ash content higher than 30%. Ash contents between 20% and 50% gave higher strength than the reference sample (with no ash).
27
Table 4.4 - Density and strength of the ceramic samples of the third composition
Number Composition (%) Density (kg / m3) Strength (MPa) Clay Ash Stahiment 2000MZh30
(3% by mass of clay) 1 100 0 3 1790.58 22.50 2 90 10 2.7 1683.04 35.27 3 80 20 2.4 1673.02 31.87 4 70 30 2.1 1700.52 20.31 5 60 40 1.8 1703.81 17.56 6 50 50 1.5 1629.21 9.61 7 40 60 1.2 1581.67 7.50 8 30 70 0.9 1546.27 3.82 9 20 80 0.6 1495.60 2.33
Analyzing the obtained values see that the introduction of the Stahiment 2000MZH30, as with the first composition, the density decreases with increasing ash. Also, the strength increases with a decrease in the ash content.
28
The Figure 4.5 shows the density results for the three first compositions.
Figure 4.5. – Density results for the three first compositions
0 500 1000 1500 2000 2500 0 10 20 30 40 50 60 70 80
Clay+Ash Clay+Ash(milled) Clay+Ash+Stahiment2000МZh30 p
(kg/m3)
Ash content(%)
29
The Figure 4.6 shows the strength results for the three first compositions.
Figure 4.6. – Strength results for the three first compositions
Table 4.5 - Density and strength of the ceramic samples of the fourth composition Num ber Composition (%) Density (kg / m3) Strength (MPa) Clay Ash Ash
(ground) Sand Fireclay
1 75 15 10 1644.60 20.69
2 75 15 10 1749.28 26.12
3 75 10 15 1735.38 19.95
4 75 10 15 1734.92 19.73
5 75 15 10 1743.30 17.61
The Figure 4.7 shows the density of samples of the fourth composition.
0 5 10 15 20 25 30 35 40 0 10 20 30 40 50 60 70 80
Clay+Ash Clay+Ash(milled) Clay+Ash+Stahiment2000MZh30
Ash content (%) R
30
Figure 4.7. – Density of samples of the fourth composition
The Figure 4.8 shows the strength of samples of the fourth composition.
Figure 4.8. - Strength of samples of the fourth composition
This composition results with maximum density and strength for the sample number with 75% of clay, 15% of ash, and 10% of fireclay, having density of 1749.28 kg/m3 and strength of 26.12 MPa.
According to the data obtained, analyzing all the compositions, we can conclude that an increase in the ash content in the composition of the mixture leads to a decrease in density and strength.
1580 1600 1620 1640 1660 1680 1700 1720 1740 1760 1 2 3 4 5 Fourth composition Сomposition number (№) p (kg/m3) 0 5 10 15 20 25 30 1 2 3 4 5 Fourth composition Composition number (№) R (МPа)
31
4.2.2 Influence of ash waste from thermal power plants on
the water absorption of a ceramic shard
The results of the water absorption tests for the first composition are shown on the Table 4.6.
Table 4.6 - Water absorption of the first composition Number
Composition Water absorption by mass (%) Clay Ash 1 100 0 16.26 2 90 10 12.69 3 80 20 14.76 4 70 30 16.76 5 60 40 16.89 6 50 50 18.65 7 40 60 19.91 8 30 70 20.66 9 20 80 24,10
With increasing ash content in the samples, the water absorption increases to 24.10% by weight of the sample № 9 containing 80% ash. Low water absorption in the sample was № 2, equal to 12,69%, for the composition: 90% of clay and 10% of ash.
The results of the water absorption tests for the second composition are shown on the Table 4.7.
32
Table 4.7 - Water absorption of the second composition Number
Composition Water absorption by mass (%) Clay Ash (milled)
1 100 0 15.99 2 90 10 9.00 3 80 20 16.85 4 70 30 16.89 5 60 40 18.03 6 50 50 19.54 7 40 60 20.26 8 30 70 23.91 9 20 80 24.62
With an increase in fly ash (milled) content water absorption increased to 24.62% by weight of the sample № 9 with 80% ash (milled) content. Lower water absorption was obtained in the sample № 2 equal to 9%, for the composition: 90% of clay and 10% of ash .
The results of the water absorption tests for the third composition are shown on the Table 4.8.
Table 4.8 - Results of water absorption of the third composition
Number Composition Water absorption by mass (%) Clay Ash Stahiment (3% by mass of clay) 1 100 0 3.00 12.96 2 90 10 2.70 13.97
33 3 80 20 2.40 19.06 4 70 30 2.10 17.92 5 60 40 1.80 19.78 6 50 50 1.50 21.90 7 40 60 1.20 21.49 8 30 70 0.90 20.28 9 20 80 0.60 24.81
With increasing ash content in the samples water absorption increases to 24.81% by weight of the sample № 9 containing 80% ash. The lower water absorption in the samples was for № 1 with 12,96%, for the composition: 100% of clay, no ash and 3% of Stahiment 2000MZH30 (by mass of Clay).
34
The Figure 4.9 shows the water absorption of different compositions.
Figure 4.9. - Water absorption of different compositions
The results of the water absorption tests for the fourth composition are shown on the Table 4.9.
Table 4.9 - Results of water absorption fourth composition Num
ber
Composition Water absorption by mass (%) Clay Ash Ash (milled) Sand Fireclay
1 75 15 10 18.46 2 75 15 10 17.69 3 75 10 15 17,01 4 75 10 15 15.76 5 75 15 10 16.50 0 5 10 15 20 25 30 0 10 20 30 40 50 60 70 80
Clay+Ash Clay+Ash(milled) Clay+Ash+Stahiment2000МZh30
Water absorption by mass (%)
35
Most lower water absorption obtained was equal to 15.76% for the sample № 4 with the composition: 75% of clay, 10% of ash and 15% of sand.
The Figure 4.10 shows the graph of water absorption of the samples fourth com-position.
Figure 4.10. - Graph of water absorption of the samples fourth composition
4.2.3 Influence of ash waste of thermal power plants on
the shrinkage of ceramic shards
The results of the shrinkage first composition are shown on the Table 4.10. Table 4.10 - Shrinkage first composition
Number Composition Shrinkage after drying (%) Firing shrinkage (%) Total shrinkage (%) Clay Ash 1 100 0 14.78 0.29 15,11 2 90 10 13.96 0.57 14.61 3 80 20 2.56 11.43 14.29 4 70 30 12.36 1.71 14.29 14 14,5 15 15,5 16 16,5 17 17,5 18 18,5 19 1 2 3 4 5 Fourth composition Composition number (%) Water absorption by mass (%)
36 5 60 40 7.38 0.54 7.96 6 50 50 5.82 0.67 6.52 7 40 60 1.65 0.51 2.17 8 30 70 0.88 0.38 1.27 9 20 80 0.25 0.38 0.63
We see that the maximum total shrinkage was 15.11% on the sample № 1 with the content of 100% clay and was the lowest (0.63%) on the sample № 9 where the con-tent of clay is 20% and 80% of ash. According to the results of shrinkage of the first composition we can conclude that the increase in the ash content reduces the overall shrinkage of the samples.
The results of the shrinkage second composition are shown on the Table 4.11. Table 4.11 - Shrinkage second composition
Number Composition Shrinkage after drying (%) Firing shrinkage (%) Total shrinkage (%) Clay Ash (milled)
1 100 0 29,24 0.49 29.87 2 90 10 18.52 0.45 19,05 3 80 20 8.40 8.05 17.13 4 70 30 3.36 11.37 15,11 5 60 40 12,20 0.56 12.83 6 50 50 11.89 0.42 12.36 7 40 60 5.54 0.66 6.24 8 30 70 2.17 0.64 2.83 9 20 80 0.25 0.38 0.63
We see that the maximum total shrinkage (29.87%) was on the sample № 1 with the content of 100% clay and the lowest (0.63%) was on the sample № 9 where the
con-37
tent of clay is 20%, and 80% of ash (milled). According to the results of the first com-position we can conclude that the increase in the ash content reduces the overall shrink-age of the samples.
The results of the shrinkage of the third composition are shown on the Table 4.12. Table 4.12 - Results of shrinkage of the third composition
Number Composition Shrinkag e after drying (%) Firing shrinkage (%) Total shrinkage (%) Clay Ash Stahiment (3% by mass of clay) 1 100 0 3.00 28.82 0.81 29.87 2 90 10 2.70 18.17 0.74 19,05 3 80 20 2.40 8.40 0.54 8.99 4 70 30 2.10 3.49 0.65 4.17 5 60 40 1.80 12,20 0.56 12.83 6 50 50 1.50 11.73 0.56 12.36 7 40 60 1.20 5.68 0.53 6.24 8 30 70 0.90 2.04 0.77 2.83 9 20 80 0.60 0.25 0.38 0.63
The presence Stahiment 2000MZH30 in the sample №3 compared with the com-position № 1 without it, does not affect the overall shrinkage of the samples.
38
The Figure 4.11 shows the graph of shrinkage samples of third compositions.
Figure 4.11. - Graph of shrinkage samples of third compositions
The results of the shrinkage on the fourth composition are shown on the Table 4.13.
Table 4.13 - Results of shrinkage on the fourth composition
Num ber Composition Shrink age after drying (%) Firing shrinkag e (%) Total shrinka ge (%) Clay Ash Ash
(milled) Sand Fire-clay 1 75 15 10 14.45 0.58 15,11 2 75 15 10 13,80 0.72 14.61 3 75 10 15 11.27 0.14 11.42 4 75 10 15 11.89 0.28 12,20 5 75 15 10 12.52 0.28 12.83 0 5 10 15 20 25 30 35 0 10 20 30 40 50 60 70 80
Clay+Ash Clay+Ash(milled) Clay+Ash+Stahiment2000МZh30
Total shrinkage(%)
39
The Figure 4.12 shows the graph of shrinkage samples fourth compositions.
Figure 4.12. – Graph of shrinkage samples fourth composition 0 2 4 6 8 10 12 14 16 1 2 3 4 5 Fourth composition Total shrinkage (%) Composition number (№)