LAGOON WATER-LEVEL OSCILLATIONS DRIVEN BY RAINFALL AND WAVE CLIMATE 1
González-Villanueva, R.1, 2 , Pérez-Arlucea, M.1 and Costas, S.3
2
1 Departamento de Xeociencias Mariñas e O.T. (XM1), Universidade de Vigo, 36310 Vigo, Spain
3
2 Department of Geography, University of Dundee, Dundee, Scotland
4
3 CIMA, Universidade do Algarve, Portugal Campus de Gambelas, Edifício 7, 8005-139 Faro,
5
Portugal 6
7
8
Corresponding author: González-Villanueva R. [email protected] 9
ABSTRACT 11
Barrier breaching and subsequent inlet formation represent critical processes that ensure the 12
temporary or permanent connection and transference of water, nutrients, or living organisms between a 13
lagoon and the open sea. Here, we investigate the conditions inducing natural barrier breaching through 14
a 34 months monitoring program of water-level oscillations within a shallow lagoon and the adjacent 15
nearshore, at the Northern coast of the Iberian Peninsula, Louro lagoon. Seven natural openings were 16
identified during the three monitored wet seasons (Wet1, Wet2 and Wet3), four in the Wet1, two in the 17
Wet2 and 1 in the Wet3. Identified openings were grouped in three types depending on the observed 18
relation between the lagoon water-level (Lwl), the berm height (Bh) and the water-level at the beach (Bwl):
19
(i) openings by lagoon outflow, which include those characterized by Lwl higher than the Bh and lower
20
Bwl; (ii) openings by wave overwash, including those induced by Bwl higher than the Bh, and (iii) mixed
21
openings, which result from a combination of the two previous conditions. We have found that the Lwl
22
is modulated by the rainfall regime (Rf) and can be explained by the accumulated precipitation while Bh
23
and Bwl depend on the wave climate and tidal level and can be estimated applying runup equations. The
24
inlet lifespan was found to be regulated by the wave climate and rainfall regime; in particular barrier 25
sealing was associated with a sudden increase in wave period and reduction in precipitation. This work 26
proves that the natural openings could be predicted successfully with support to medium term water-27
level monitoring programs, which in turn may significantly contribute to strategic decision making for 28
management and conservation purposes. 29
KEYWORDS 30
Natural barrier breaching, rainfall regime, wave climate, coastal lagoon, berm height, tidal range, 31
intermittent inlet 32
1. INTRODUCTION 33
Coastal barrier breaching (inlet formation) is a complex morphodynamic process that enables free 34
water exchange between the lagoon and the open sea. Processes performing at both the seaward and the 35
bay side of a barrier may induced barrier breaching (Boothroyd, 1985; Fagherazzi and Priestas, 2012; 36
Gordon, 1990; Hayes, 1979; Kraus et al., 2002; Pierce, 1970). The consequences of such processes are 37
not restricted to lagoon and barrier morphology (Bird, 1993; FitzGerald et al., 2000; Gordon, 1990; 38
Kraus et al., 2002; Morris and Turner, 2010; Pacheco et al., 2011), but they also have a significant 39
impact over the biogeochemical fluxes by promoting water, sediments, nutrients and pollutants 40
exchange, with the sea (Dussaillant et al., 2009; Dye and Barros, 2005; Gale et al., 2006; Moreno et al., 41
2010; Schallenberg et al., 2010). Once open, inlets can remain active or close after a period of time 42
depending on their hydraulic efficiency, which in turn depends on the rainfall regime, the tidal prism 43
and the long-shore and/or cross-shore sediment transport by local waves (Castelle et al., 2007; Cayocca, 44
2001; Cruces et al., 2009; Fitzgerald et al., 1984; Fortunato et al., 2014; Green et al., 2013; Ranasinghe 45
and Pattiaratchi, 2003; Ranasinghe et al., 1999; Rich and Keller, 2013). Yet, inlets can intermittently 46
open and close, imposing a temporary character to the connection between lagoons and the ocean. 47
Depending on the timing of their opening through the year, inlets can be regular, i.e. the connection 48
with open sea occurs seasonally or cyclically, or they can be irregular, if the opening timing does not 49
occur periodically. Regular openings are related to seasonal favorable conditions such as (i) high water-50
levels and large storm waves impacting the sea side of coastal barriers, or (ii) lagoon high water-levels 51
induced by strong river discharges and heavy rainfalls (Bird, 1993; Dussaillant et al., 2009; Gale et al., 52
2006; Gordon, 1990; Weidman and Ebert, 2013). Alternatively, irregular openings usually occur at sites 53
where the seasonal contrasts are not significant, preventing periodic timing in their opening-closing 54
behavior (Gale et al., 2006; Gordon, 1990; Morris and Turner, 2010). Yet, it is worth noticing that many 55
of the examples described in the literature refer to manually opened inlets (with the support of 56
bulldozers) for flood-abatement and flushing purposes (Fortunato et al., 2014; Kraus and Wamsley, 57
2003; Roy et al., 2001; Wainwright and Baldock, 2015). 58
Establishing the frequency and the thresholds of natural barrier breaching and closure is crucial for 59
vulnerability assessment and to prevent the loss of human lives, damage to infrastructures in populated 60
coastal areas and/or damage to ecosystem services. Despite this, understanding barrier breaching and 61
closure is constrained by limitations related to the apparently unpredictable character of natural openings 62
and closures, and the oftentimes lack of data regarding barrier breaching and inlet development fronting 63
a coastal lagoon. Indeed, very few are the examples that include a complete monitoring to understand 64
all the processes involved and provide the required information for management purposes. 65
To our knowledge, so far only a few studies have been made in small coastal lagoons -pocket 66
lagoons- (Figueiredo et al., 2007; Gordon, 1981; Rijkenberg, 2015), and are inexistent in coastal lagoons 67
located in rocky coasts. In this regard, the present work aims at resolving the mechanisms behind barrier 68
breaching and closure of intermittently connected lagoons by monitoring water-levels in a coastal 69
lagoon. The study site is located at the NW Iberian coast, with a relatively small surface and catchment 70
area and feeding by an ephemeral river. The aim is to improve our understanding on natural breaching 71
and closure processes with particular attention to those openings induced by extremely high water 72
lagoon levels. To understand the mechanisms behind the opening and closure of the ephemeral inlet at 73
Louro lagoon we have examined the water-level changes in the lagoon and explored the most likely 74
associated forcers. This was undertaken through the analysis of different data sets of water-level 75
monitoring (sea and lagoon), topographic, wave climate and metereological data. 76
2. STUDY SITE 77
The explored pocket coastal lagoon (Louro) is located in a small embayment at the northern margin 78
of the Ría de Muros entrance, at the Atlantic coast of Galicia, NW Iberia (Figure 1). Louro lagoon is a 79
pocket lagoon and is influenced by both fresh and saline waters (Cobelo-García et al., 2012). It is an 80
important habitat for numerous plant and animal species, and is included in the Natura 2000 network of 81
the European Union (EU). 82
The lagoon is a very shallow water body with a flat bottom bed (Figure 1). It has a surface area about 83
0.25 km2, nearly 0.62 km-long and around 0.34 km wide. Reed beds characterize the marginal areas of
84
the lagoon, where the sediment is mostly sand and silt. Sandy sediments characterize the central area, 85
while muddy sediments dominate the inland sector. The communication with the open sea usually 86
happens through barrier breaching and inlet formation during winter. The inlet opens at the westernmost 87
part of the lagoon (Figure 1D). A 2 m-depth channel with an average width of 15 m cuts the barrier 88
perpendicular to the shoreline just after the barrier is breached (González-Villanueva, 2013; Pérez-89
Arlucea et al., 2011). Over time, the channel shifts to the north with its long axis becoming parallel to 90
the shoreline until its closure (Almécija, 2009). 91
The lagoon is separated from the open sea by a 300-600 m-wide and 1500 m-long sand barrier, which 92
anchors to rocky outcrops at both ends (Figure 1). The sandy barrier hosts a dune ridge fragmented by 93
aeolian corridors running across the dune from the upper part of the beach. The dune-ridge reaches 94
maximum heights of 15 m above the Mean Sea-Level in Alicante (MSLA; topographic Spanish Zero, 95
located 1.893 m above mean sea level at Coruña maritime port; see www.puertos.es for more 96
information). High waves come from W to NW directions, with higher values (more than 8 m) during 97
winter (Figure 1C). The NW-SE orientation of the system protects the barrier from the direct impact of 98
these energetic waves. The beach morphology oscillates between two morphodynamic states i.e., 99
intermediate and reflective morphologies from summer to winter conditions respectively (Almécija et 100
al., 2009). In addition, Almécija et al. (2009) demonstrated that the presence offshore of a shallow zone 101
provokes changes in the wave approaching to the coast and a wave divergence with an important energy 102
loss in the northern area of the sand barrier. 103
105
Water-level oscillations within the lagoon are mostly seasonal and related to catchment runoff 106
(Cobelo-García et al., 2012; González-Villanueva, 2013; Pérez-Arlucea et al., 2011). Louro catchment 107
area is 4.57 km2, with a mean basin slope of 0.19 m/m. The areal percentage of plutonic rocks in the
108
catchment area is 12.58 %, metamorphic rocks 18.83 % and sedimentary (quaternary) rocks and soil 109
68.59 %. Natural scrubland, abandoned agricultural plots and sparse trees complete the landscape of the 110
catchment areas. The drainage network has a marked torrential regime except for the main tributary, 111
which is the only one with a seasonal water discharge, despite its reduced flow distance of 3.85 km. 112
Louro is located at the southern limit of the North Atlantic storm track. This region is particularly 113
sensitive to interannual shifts in the trajectories of the mid-latitude cyclones, which are controlled by 114
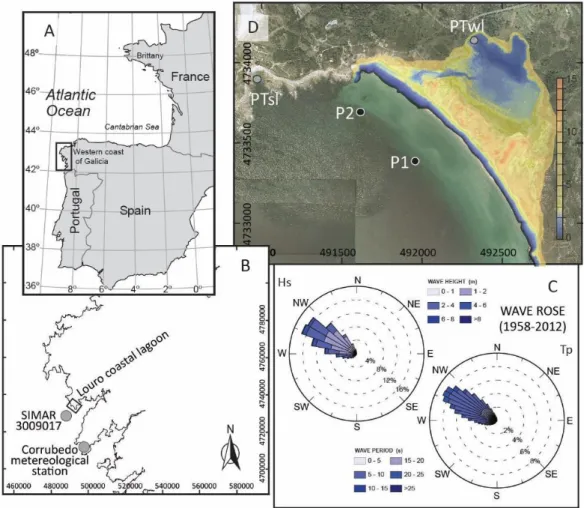
Figure 1. Location of field site. (A): Location in the framework of the Iberian Peninsula. (B): Position of Louro coastal lagoon, SIMAR node and meteorological station. (C): Significant wave height (Hs) and period (Tp), at SIMAR 3009017 point. (D): Aerial imagery of Louro coastal barrier lagoon (2004), with MDT of the barrier and lagoon derived from LiDAR data (2009). The grey dots indicate the location of the water-level loggers. PTsl: sea level record; PTwl: lagoon record; P1 and P2 are the locations for the points used to extract wave characteristics from SWAN propagation model.
the North Atlantic Oscillation -NAO- (Goodess and Jones, 2002; Osborn et al., 1999). The rainfall in 115
the study area is highly variable, with an average rainfall ranging from 600-700 mm in winter to less 116
than 100 mm in summer. The average annual rainfall is close to 1700 mm (Martínez Cortizas and Pérez 117
Alberti, 1999). Previous works suggested that precipitation in this region is strongly modulated by the 118
NAO, with more humid conditions during winters corresponding to low and negative NAO index values 119
(Rodriguez-Fonseca and de Castro, 2002; Trigo et al., 2008). 120
3. MATERIAL AND METHODS 121
Two water-level loggers were deployed at the study site to monitor water-level oscillations (Figure 122
1, Table 1). Available topographic data (Table 1) was obtained from two high-resolution DTMs, 123
measured at low and high lagoon water-levels. These data were used to examine the morphology of the 124
barrier and the bottom topography of the lagoon. The first was surveyed on 19/09/2009, with a 125
Terrestrial Laser Scanner (TLS) Class-1 TSL-RIEGL model LMS Z-390i while the second was surveyed 126
by the IGN on 8/03/2011 using an airborne LiDAR (downloaded from http://pnoa.ign.es/coberturalidar). 127
The DTM were constructed based on the Geodetic Reference System ED50 and were represented on the 128
UTM mapping projection (UTM zone 29N). All heights were referred to MSLA. 129
Metocean data were also examined and jointly analyzed with in-situ water levels: (i) meteorological 130
data (i.e. rainfall and evaporation parameters) from a near coastal meteorological station -Corrubedo 131
station (Figure 1) - (downloaded from http://www.meteogalicia.gal/web/index.action), and (ii) wave 132
climate data from one node of the SIMAR dataset (courtesy of Puertos del Estado), which includes 133
hindcast winds, sea-level and waves starting in 1958 (Figure 1, Table 1).
134
Available data
Type of data Units Temporal resolution
or accuracy Temporal range Data source
Rainfall l/m2 10 min mean 10/2009-7/2012 Meteogalicia
Evaporation l/m2 24 hour mean 10/2009-7/2012 Meteogalicia
Offshore waves
(H, T, Direction) (m, s, °)
3 hour mean 10/2009-12/2011
Puertos del Estado
1 hour mean 12/2011-7/2012
Sea level M 5 min mean 10/2009-1/2012 Survey-Pressure transducer
Lagoon water-level M 5 min mean 10/2009-7/2012 Survey-Pressure transducer
DTM’s M H: 3mm V:3mm 19/09/2009 Survey-TLS
Topographic data M H: 8mm V:15mm 30/01/2010 Survey- DGPS-RTK
Topographic data M H: 8mm V:15mm 05/02/2010 Survey-DGPS-RTK
DTM’s M H: 0.15m V:0.2m 08/03/2011 LiDAR- IGN
Topographic data M H: 8mm V:15mm 29/09/2011 Survey-DGPS-RTK
3.1. Lagoon water-level changes 135
Lagoon water-level monitoring 136
One logger was located in the lagoon to register lagoon water-levels (Lwl; Figure 1). Water
137
oscillations were recorded at 5 min time intervals, for 34 months (Table 1) with Water-level logger 138
models Seabird SBE 39 and AQUALogger 520 PT. The elevation of the logger was measured, once 139
deployed, using a Trimble DGPS-RTK. Observations were therefore referred to the MSLA by 140
referencing to the corresponding water logger elevation. Water-level measurements were corrected for 141
variations in barometric pressure using the data downloaded from the closest meteorological station 142
(Figure 1). 143
Corrected data were used to determine the timing of lagoon natural opening, the duration of the active 144
inlet phase, inlet sealing and the associated water-level thresholds. In addition, these data allowed us to 145
identify the parameters that can characterize the lagoon openings: (i) the plateau phase, which 146
corresponds to the time (in hours) between the moment when the lagoon reaches its highest water-level 147
and the breach, and (ii) the water-head (or hydraulic head) difference (in meters), which was calculated 148
as the difference between the lagoon water-level and the water-level in the nearshore at the opening. 149
Rainfall regime impact on lagoon water-level 150
The relation between Lwl and the rainfall was evaluated using the accumulated rainfall (Rf) for the
151
periods when the lagoon was closed. First the periods with more intense and frequent rainfalls or wet 152
seasons were identified, including also the periods during which the lagoon opens. In addition, the water 153
storage capacity of the lagoon was obtained using the bathymetry to translate lagoon water-levels into 154
water-volumes (Lv). Therefore, the relation between Lv and Rf was obtained, which can be applied for
any situation knowing the accumulated rainfall. In addition, the obtained expression can only be applied 156
after a certain level in the lagoon is reached in order to allow direct comparison between events (Lmwl).
157
To select the latter, we have imposed criteria to normalize all the data that is defined by local sea water 158
levels: 159
(1) 𝐿𝑚𝑤𝑙= 𝑀𝑊 + 1 2⁄ (𝑀𝐻𝑊 − 𝑀𝑊)
160
where MW is sea mean water-level and MHW is the high sea mean water-level 161
3.2. Nearshore water-levels 162
Tidal regime 163
The tidal regime was monitored using a logger located at the beach nearshore (Figure 1). Water 164
oscillations at the nearshore were recorded at 5 min time intervals, for 28 months (Table 1). We used 165
the same models of water-level loggers as previously described for the Lwl monitoring. The same
166
topographic and barometric corrections used for the lagoon water-level record were applied to these 167
data. The corrected record was analyzed using the script World Tides (Boon, 2004) for MATLAB 168
software. This MATLAB routine calculates the tidal curves and residuals (storm surges) using the 169
highest astronomical tide (HAT) and the lowest astronomical tide (LAT). Different reference tidal-levels 170
were obtained from the data record: MW, MHW and mean low water-level (MLW). Identified short 171
gaps in the observed sea-level record due to failures in the logger were corrected by including the 172
predicted tide level obtained with the same MATLAB routine. The tidal height (Th) at identified lagoon
173
openings were extracted from the record. 174
Runup 175
The runup formulation (equation 2) proposed by Stockdon et al. (2006) was chosen to estimate the 176
2% exceedance value of runup peaks (R2). Among the available formulas for runup calculation, this one
177
was selected because can be applied to intermediate or reflective beaches. Indeed, under storm 178
conditions (reflective beaches, with ξ0>1.25), where the swash is dominated by incident energy, the
179
equation 2 can be simplified into the equation 3. 180
(2) 𝑅2= 1.1 (0.35 𝛽𝑓√(H0L0) +
√[𝐻0𝐿0(0.563𝛽𝑓2+0.004)]
2 ) or (3) 𝑅2= 0.73 𝛽𝑓√(H0L0); for ξ0> 1.25
where βf is the beach-face slope, H0 and L0 are the deep-water wave height and length, respectively. The
182
ξ0 is a non-dimensional surf similarity parameter or Iribarren number (Battjes, 1974) and is defined by
183 the equation 4: 184 (4) ξ0= 𝛽𝑓 √(H0L0) 185
The beach morphology falls into the reflective type during winter conditions (Almécija, 2009) with 186
an average winter slope of 0.1, which was used to calculate the Iribarren number and the runup values. 187
Bwl at the breaching moment was obtained by the addition of the measured tidal-level (Th) and the
188
calculated runup levels (R2).
189
To estimate runup levels at the beach we have used the wave data from a hindcast time series 190
extracted from the SIMAR-3009017 node, located offshore of Louro (Figure 1), for the time period 191
overlapping the record of the water loggers. Because of the orientation and irregular shape of the coast, 192
offshore waves have been propagated onshore using a bathymetric grid with the best available data with 193
a 50m resolution. The SIMAR wave data were used to feed the SWAN (Simulating WAves Nearshore) 194
model (Booij et al., 1999) to simulate the nearshore wave climate. The model was run in non-stationary 195
mode using one computational grid based on the bathymetric grid and was forced along its open 196
boundaries by the integral parameters of the wave time series: Hs, Tp and θp. The spectral domain was
197
discretized with 31 frequency bins (distributed logarithmically between 0.04 and 1), with a directional 198
spreading coefficient of 3. Wave parameters (Hs, Tp and θp) were extracted from 2 locations alongshore
199
the Louro embayment at 12 m depth (Figure 1). 200
To ensure the correct application of equation 2, the simulated nearshore waves were reversed shoaled 201
to deep-water using the linear wave theory, and assuming a shore-normal approach and the unrefracted 202
wave height and period as suggested by Stockdon et al. (2006). 203
A similar approach was used to estimate a range in the elevation of the sandy barrier (Bhmin - Bhmax)
204
by assuming that Bwl during antecedent spring-high tides is a proxy for beach berm elevation. The latter
205
is in turn assumed as representative of the barrier dimensions at the area where the barrier breaches, 206
which in turn lacks any dune building. 207
4. RESULTS 208
4.1. Lagoon water-levels 209
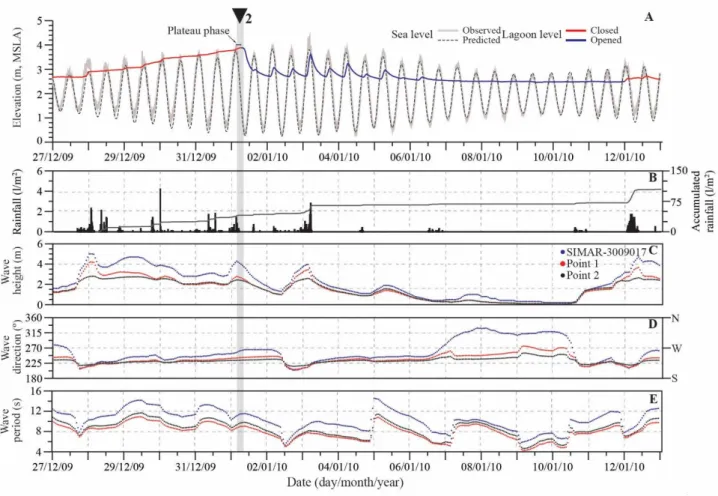
Figure 2A shows the water-level in the lagoon. The basal lagoon water-level was around 2 m 210
(MSLA), which was reached during the dry seasons and when the lagoon was opened. In general terms, 211
when the wet season starts, Lwl gradually raises 2 m, reaching values above 4 m MSLA (Figure 2A). All
212
recorded openings at Louro were natural; they had not been artificially forced or initiated. Opening 213
events were easily recognized within the lagoon water-level record as sharp elevation drops (1-2 m), 214
occurring in a short period of time (8-12 hours). The maximum level recorded in the lagoon before 215
barrier breaching was 4.72 m in March 2010 (Figure 2A, Table 2-event 3-). However, the maximum 216
water-level recorded in the lagoon was 4.83 m in February 2011 (Figure 2A-star-, Table 2-event *-), 217
which did not trigger a breaching but showed a gradual water-level lowering that spanned over few 218
months in the following spring and summer. 219
When breaching occurs, and the lagoon communication opens, water fluctuations driven by tides are 220
propagated inside the lagoon, showing a small time lag relative to the nearshore water-level (Figure 2A). 221
The number of days that the lagoon remained open ranged between 7 and 29 days (Table 2). Once the 222
connection with the open sea became more restricted, tidal fluctuations in the lagoon were flattened, 223
tending to disappear. 224
Figure 2. (A) Water-levels obtained from the loggers: observed, predicted and residual sea-level and water oscillations in the lagoon (red close and blue open). (B) Rainfall and evaporation record from the Corrubedo meteorological station during the same period. Grey bands show the wet seasons 1 to 3 (October to April) during the test period. Black arrows indicate the most significant events of inlet opening: 1 to 7. Star symbol corresponds to high water-levels into the lagoon which not ended in a barrier breaching. (C,D,E) Wave height (m), period (s) and direction (º) record of offshore waves obtained from the SIMAR node and at the points 1 and 2 from the SWAN model.
226
227
228
Table 2. Detailed information of water-levels into the lagoon, rainfall, tides and waves for opening events. Initial water-levels in the lagoon are established as the minimal water-level before a breach (Lmwl). Beach berm values (minimal and maximum) are calculated by adding to the height of the spring-high tides values the corresponding runup values before a barrier beach. The
plateau phase corresponds to the time (in hours) between the highest water-level reached by in the lagoon and the breach. The barrier recovery time is referred to the time between the closing of the inlet. The next opening is given in days. The water-head (or hydraulic head) difference (in meters) was calculated as the difference between the water-level in the lagoon and in the barrier. Accumulated rainfall corresponds to the rainfall drop lapsing between the moments that the lagoon reaches the Lmwl and a barrier breaching event. The event marked as * corresponds with a
maximum water-level not leading to an opening. Different font colors in the events correspond to different wet seasons.
Event
Lagoon water-level (m)/Date
Bhmin -Bhmax (m) Plateau phase (h) Days open Barrier recovery time (days)
Characteristics at barrier breaching
Initial level (m) Breach level (m) Water-head (m) Accumulated rainfall (l/m2) Water-level at the beach (m) Wave direction (º) Wave height (m) Tidal level (m)
Tidal stage Tidal type
Tidal range (m) 1 2.91 (14/11/2009) 4.14 (2/12/2009) 4.1-5.1 15.5 7 >76 -0.19 153 4.33 239-WSW 1.52 3.13 Rising, close to high Close spring 2.98 2 2.91 (28/12/2009) 3.89 (1/1/2010) 3.9-4.1 5.8 13 4 0.83 40.8 3.06 242-WSW 2.57 1.38 Falling, close to low Spring 3.73 3 2.91 (31/1/2010) 4.72 (2/3/2010) 4.2- 5.1 21.8 15 48 1.09 162.1 3.63 232-SW 1.17 2.80 Rising, close to high Spring 4.11 4 2.91 (18/3/2010) 3.49
(30/3/2010) 3.7-4.8 --- 29 13 -2.03 78.5 5.51 231-SW 2.57 3.49 Close high Spring 4,29
5 2.91 (8/10/2010) 4.62 (3/12/2010) 4.6- 4.8 46.3 13 229 2.93 261.6 1.69 239-WSW 0.64 1.05 Falling close to low Close spring 2.55
6 (22/12/2010) 2.91 (6/1/2011) 3.57 4.5-4.8 --- 11 19 -1.28 81.1 4.84 223-SW 2.23 3.55 Rising, close to high Spring 3.07
* 2.91 (3/2/2011) 4.83* (25/2/2011) 5.2-5.3 153 --- --- 1.15* 105.9 3.68* 230*-SW 1.19* 2.48* Rising* Neap* 1.65 7 2.91 (3/11/2011) 4.43 (16/12/2011) 4.2-5.1 61.2 20 344 1.13 265.8 3.30 233-SW 2.78 1.3 Low Close neap 2.12
4.2. Impact of rainfall on lagoon water-levels 229
Figure 2B shows rainfall and evaporation data for the same time interval. From these data, we could identify 230
three wet seasons during the monitoring program: Wet1 extended from October 2009 to April 2010, Wet2 231
from October 2010 to April 2011, and Wet3 between October 2011 and April 2012. The total rainfall decreased 232
from Wet1 to Wet3. Seven opening events were identified; 4 events during Wet1, 2 events during Wet2, and 233
only one event during Wet3. The first opening event of each wet season was characterized by Lwl above 4 m
234
(Table 2) while consecutive openings within a same season were below 4 m, which means that the time interval 235
for barrier recovery would be relatively short; openings 2, 4 and 6 (Table 2). 236
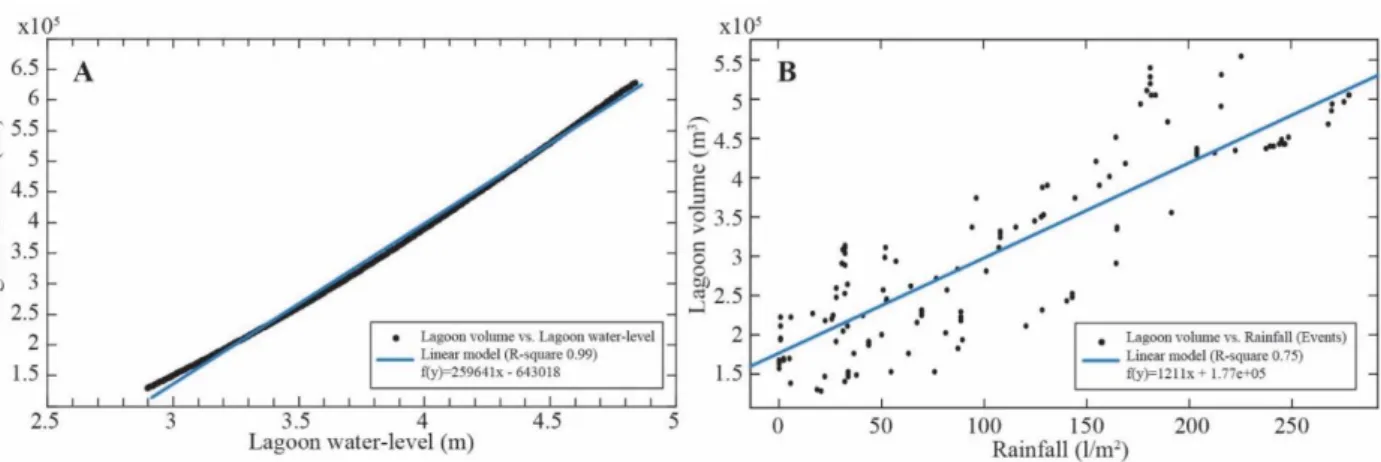
Figure 3A shows the relationship between Lwl and the corresponding Lv for Lwl higher than 2.91 m (Lmwl
237
obtained using equation 1). The relation (with a r2 value of 0.99) between these variables was:
238
(4) 𝐿𝑣 = 259641𝐿𝑤𝑙− 643018
239
Figure 3B shows Lv versus Rf for each opening event between the moments in which the imposed criteria
240
is attained (Lwl=Lmwl) and the breaching moment. The relation (with a r2 value of 0.75) between these variables
241
can be described with by the following regression: 242
(5) 𝐿𝑣 = 1211𝑅𝑓+ 1.77𝑒+05
243
244
Combining equations 4 and 5 we can obtain the relation between the rainfall and the lagoon water-level: 245
(6) 𝐿𝑤𝑙 =
(1211𝑅𝑓+ 820018)
259641 246
Figure 3. (A) Lagoon water volume in m3 versus lagoon water-level in m (black points) and the linear regression (blue line) (B)
Lagoon volume in m3 obtained for each event from 2.91m of water-level in the lagoon until the opening level versus accumulated
To validate this relation, we have used the values of rainfall in our study area and the recorded lagoon 247
water-levels. Figure 4 represents the Lwl, recorded and predicted using equation 6, at the barrier breach. The
248
predicted values are close to the recorded values (less than 0.3 m of difference) with the exception of the events 249
2 and 3, having a difference of 0.5 and 0.8 m respectively. 250
Figure 4. Lagoon water-level in m for each opening event. Black points represent the recorded water-levels and the grey points the predicted water–levels using the equation 6.
251
4.3. Nearshore water-levels 252
Figure 2A shows the complete record of sea level during the monitoring program. The mean sea water-253
level (MW) was 1.99 m above MSLA; close to the basal level recorded in the lagoon (i.e. 2 m). The obtained 254
mean low water-level (MLW) was 0.19 m while the mean high water-level (MHW) was 3.83 m above MSLA. 255
However, sea level reached values of 4.4 m during storm events (Figure 2A). Identified openings occurred at 256
spring tides or close to spring tides with the exception of opening 7, which took place close to neap tides. Four 257
of the recorded openings occurred close to the high tide (openings 1, 3, 4 and 6) while the other three (opening 258
2, 5 and 7) happened close to the low tide (Table 2). 259
Figures 2C, D and E show the wave parameters obtained from the node SIMAR-3009017 and the 260
propagated waves with SWAN model at points 1 and 2 (Figure 1). The results show that higher wave heights 261
came from SW, suggesting the occurrence of storms recorded during the wet seasons. Waves from SW impact 262
the beach directly while waves from westerly and northerly directions are transformed before reaching the 263
beach due to wave refraction. The effect of refraction is not linear and becomes higher as the offshore waves 264
approach NW, reaching a maximum difference of 50º between offshore and local wave direction (e.g. 343º -265
NNW- transformed to 290º-WNW-). The wave height and period were reduced by 30% and 20% respectively. 266
Differences between the nearshore points 1 and 2 were only observed on waves above 3m, suggesting a higher 267
effect as the waves enter the northern-end of the bay. 268
The minimum and maximum values estimated for barrier elevation (Bhmin and Bhmax) before the openings
269
are presented in Table 2, ranging from 3.7 to 5.3 m. The latter were associated with local waves arriving 270
parallel to the beach or with low angles (≈225-230º) and high periods (>8 s), promoting onshore sediment 271
transport. 272
In the same way, Bwl at the openings were calculated and are presented in Table 2. The estimated values of
273
Bwl for four of the identified openings were lower than the recorded Lwl (openings 2, 3, 5 and 7), resulting in a
274
positive water-head difference. Alternatively, the other three cases estimated Bwl values were higher than Lwl
275
(openings1, 4 and 6), producing a negative water-head difference (Table 2). 276
4.4. Processes and data integration 277
Barrier breaching was tentatively parameterized using the relation between the Lwl (lagoon water-level); Bh
278
(Barrier height) and Bwl (barrier water-level). Wave climate, rainfall and the tidal range modulate the selected
279
parameters. Indeed, the water level in the lagoon can be predicted using the accumulated rainfall, while the 280
elevation of the berm can be estimated using the local wave climate and nearshore water level. In addition, the 281
relation between these parameters determines the mechanism that will induce barrier breaching and could be 282
used to predict the timing, the direction of the lagoon openings and, therefore, the type of opening. Three types 283
of openings have been identified: (i) Lw-type or breaching triggered from the lagoon, (ii) Sw-type or breaching 284
triggered from the sea and (iii) Mx-type or mixed lagoon-sea opening. 285
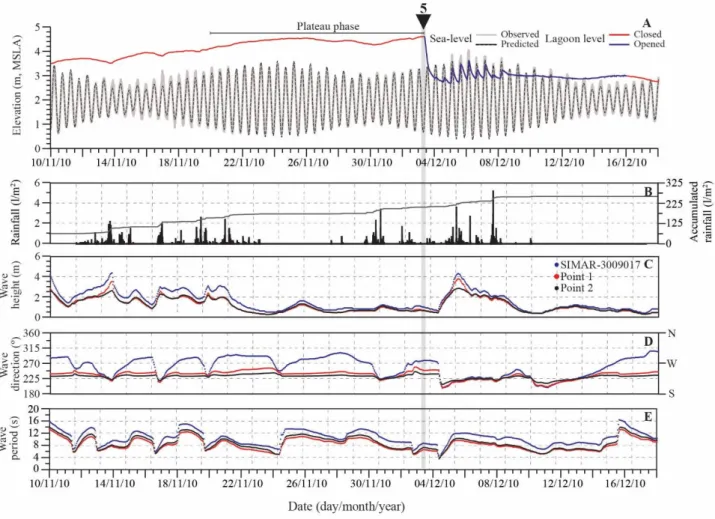
(i) Lw-type. Three of the identified events were included into this type of event: openings 3, 5 and 286
7 (Figure 5, event 5). Lw-type was associated with the highest recorded water-levels in the lagoon, 287
ranging from 4.43 to 4.72 m, and highest values of accumulated rainfall with values up to 288
268.5 l/m2. The high lagoon water-levels were maintained between 21.8 and 61.2 hours, what we
289
have named as the plateau phase (Table 2). This type was also associated with a strong barrier, 290
with more than 48 days to recover from a previous opening (Table 2). In addition, the water-head 291
difference (Table 2), always showed positive values greater than 1 m, generating a gradient 292
between the lagoon and the sea side. Lw-types were preferably happening with low waves heights 293
and spring tide, only the event 7 occurred with high height waves but at low and close to neap 294
tides (Table 2). We observed that for all these cases the relation Lwl ≥ Bhmin > Bwl was filled.
295
Figure 5. Example of Lw type (event 5). (A) lagoon water-level and sea-level, (B) rainfall and (C, D, E) waves previous, during and after the opening..
296
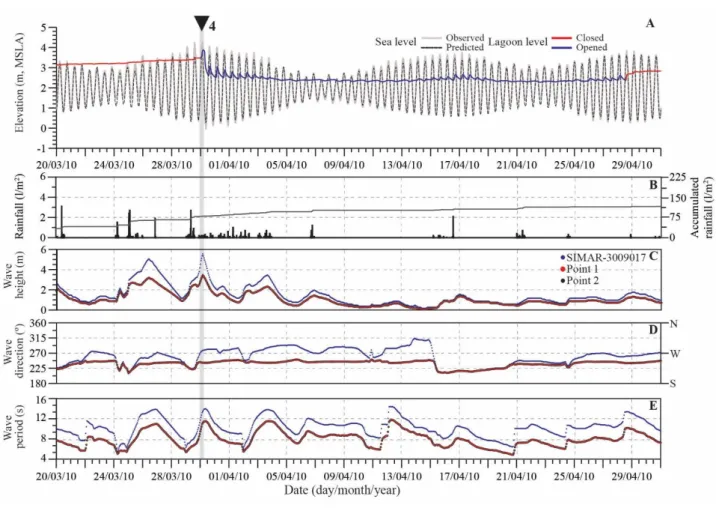
(ii) Sw-type. Openings 4 and 6 (Figure 6, event 4) were classified as Sw-type. In both cases, the
297
opening occurred shortly after beach berm reconstruction, following barrier breaching within the 298
same wet period. The water-level inside the lagoon and the accumulated rainfall was lower than 299
for the Lw-type, with values circa 3.5 m of water-level and circa 80 l/m2 for rainfall (Table 2).
300
Estimated beach berm elevations before the opening were similar or lower than the values 301
obtained for the Lw-type (see Table 2). However, the barrier recovery time in these cases was less 302
than 20 days (Table 2), and the SW waves reached the beach at an oblique angle to the shoreline. 303
These waves were previously documented as responsible for the beach-face erosion in the study 304
area, provoking the lowering and narrowing of the barrier (Almécija et al., 2009). Water-head 305
differences were negative and greater than 1 m for these cases, generating an inverse gradient 306
between the lagoon and the ocean. During these events, the plateau phase was not present. Sw 307
type events developed during spring tides, coincident with high tides and high SW waves
308
promoting high runup values (see Figure 2 and Table 2). For these cases the observed relation 309
between the three variables was Bwl ≥ Bhmax > Lwl.
310
Figure 6. Example of Sw type (event 4). (A) lagoon water-level and sea-level, (B) rainfall and (C, D, E) waves, previous, during and after the opening.
311
(iii) Mx-type. This type represents the openings 1 and 2 (Figure 7, event 2) that could not be easily
312
grouped within the Lw- and Sw-types. The water-level inside the lagoon was relatively high 313
(around 4 m, Table 2). Yet, the water-head difference in this type was positive or negative but 314
lower than 1 m. Moreover, like in the Sw type, the days before the opening were characterized by 315
high SW waves, with high erosion potentials to erode the beach berm, inducing barrier breaching. 316
Under such conditions, it is expected that the weak barrier would not be able to store high water-317
volumes in the lagoon, maintaining the plateau phase only for less than 16 hours. For that type of 318
opening, the relation between the variables was Lwl ≈ Bhmin < or > Bwl.
319
Figure 7. Example of Mx type (event 2). (A) lagoon water-level and sea-level, (B) rainfall and (C, D,E) waves previous, at and after the opening.
320
If the water-levels in the lagoon or at the barrier do not reach the minimal barrier crest height the barrier is 321
not breached, even with high water head differences (event *, Table2). For this cases the situation is defined 322
by Lwl < Bhmin > Bwl.
323
Once open, the lagoon can maintain its direct connection with the open sea for a variable length of time, 324
ranging from 7 to 29 days. The duration of this phase does not show a clear relation with the lagoon water-325
level (Table 2). In turn, inlet longevity at Louro seems to be regulated by the rainfall regime and wave climate 326
after the opening. The identified closure events were coincident with a cessation of rain, which would explain 327
the reduction of the water input, and the incidence of constructive waves characterized by higher period values. 328
The latter would promote the onshore sediment transport and the development of high berms with the 329
subsequent barrier growth and widening. In some cases, barrier sealing was interrupted by high erosive waves, 330
and a slight amount of rainfall; this was observed clearly in opening 2 and 4 (Early-January 2010-Figure 7- 331
and Mid-April 2010- Figure 6). 332
5. DISCUSSION 333
The ultimate objective of this work was to monitor water-level oscillations within an intermittently open 334
coastal lagoon and the adjacent nearshore, providing a continuous medium-term (> 2 years), high temporal 335
resolution record of water-level oscillations to understand natural breaching processes and evaluate the role of 336
the major forcers (i.e. rainfall regime or wave climate) during these events. The methodology selected to 337
achieve this purpose allowed barrier breaching and closure identification through the occurrence of water-level 338
changes in the lagoon. 339
One or other of the identified opening types (Lw-, Sw- and Mx-types) have been previously described at 340
other case studies. Yet, in most of the cases, references to breaching processes at lagoons usually focus on one 341
of these types, suggesting a persistent relation between sites and types of opening; i.e. openings from the lagoon 342
side (Joseph, 1958; Kraus et al., 2008; Rich and Keller, 2013; Rijkenberg, 2015), which are comparable to our 343
Lw-type, versus breaching induced by high waves (Penland and Suter, 2011; Pierce, 1970; Vidal-Juárez et al.,
344
2014), comparable to our Sw-type. All examples found in the literature suggest common processes to explain 345
barrier breaching with independence of site-specific features such as catchment area or lagoon basin 346
dimensions. 347
At Louro, barrier breaching induced from the land side (lagoon) results from water-level rise in the lagoon 348
as a consequence of intense rainfall and river discharges, in this case under torrential regime. The natural 349
breaching occurs when Lwl ≥ Bhmin > Bwl and after the high lagoon water-levels are maintained for a long period
350
of time, and the water-head value is above 1 m. Under these circumstances we may expect two processes 351
leading barrier breaching as described by Kraus and Wamsley (2003): (i) overflow from the lagoon side, and 352
(ii) seaward seepage generated by the groundwater gradient associated to the difference in water elevation 353
between the both sides of the barrier, contributing to liquefaction and removal of the barrier sand. The 354
estimated berm elevations suggest that a combination of both processes should lead to barrier breaching in 355
Louro. In fact, we have found that barrier breaching in Lw- and Mx-types, only occurs when the water-level in 356
the lagoon equals or exceeds the minimum estimated barrier elevation, which in turn maximizes the potential 357
seepage to compensate the generated gradient of water elevation between the lagoon and the sea side of the 358
barrier. Indeed, the event observed in February 2011 (event *, Figure 2), despite a clear positive and large 359
water head difference, did not lead to an opening because recorded Lwl were below Bhmin and therefore did not
360
triggered a lagoon overflow. 361
Breaching processes generated by overflow from the lagoon have been previously documented along the 362
Californian coast (Joseph, 1958; Kraus et al., 2002), the southeast coast of Australia (Gordon, 1990; 363
Rijkenberg, 2015), the south of Brazil (Figueiredo et al., 2007) and along the southeast African coast (Smith 364
et al., 2014; Zietsman, 2004). For all those cases, high and wide barriers were described, usually backed by 365
lagoons of variable sizes, with the exception of the examples at the southeast African coast, which correspond 366
to narrow estuarine beaches, developed at the mouth of small rivers. Alternatively, breaching processes 367
generated by sediment liquefaction have been usually observed at low and narrow barriers due to the high 368
water-level of the groundwater (Kraus and Wamsley, 2003; Pierce, 1970). 369
Conversely, openings induced from the sea side of the barrier (Sw-Type) were linked to high values of wave 370
setup and runup, which in turn contributed to the inundation of the weaker or lower areas of the barrier and 371
subsequent barrier breaching. This type of breaching is more frequently observed and is associated to low 372
barrier islands and low lying barrier spits (Gordon, 1990; Kraus et al., 2002; Kraus and Wamsley, 2003; 373
Penland and Suter, 2011; Pierce, 1970; Vidal-Juárez et al., 2014). In fact, Sw-type have been identified when 374
Bwl ≥ Bhmax > Lwl and overwash appears to trigger the breaching through the inundation of a barrier section
375
with lower topography, while the impact of the waves increased sediment mobilization and barrier erosion. 376
The recorded SW waves in this type of opening can generate high runup values, which in turn suggest the 377
onset of inundation regimes during the openings as suggested by the application of the storm impact scale 378
classification proposed by Sallenger (2000). A similar situation occurs when Lwl ≈ Bhmin < Bwl (Mx-type
379
breaching, opening 1). However, the values of runup for this case did not exceed the estimated Bhmax and thus,
380
cannot explain barrier breaching by itself, suggesting the combined effect of waves weakening the barrier and 381
the similar values of water-level in the lagoon side and the Bhmin. In addition we can expect that the seaward
382
seepage could contribute to a great extent to barrier breaching also to the latter breaching type, if generated 383
groundwater gradients are considered for all cases. Indeed, a recent experimental work by Turner et al. (2016) 384
had proved how seaward seepage fluxes can be generated under different circumstances, which in turn are 385
coincident with the ones exemplified by Lw-, Sw- and Mx- breaching types. 386
The above suggests that Louro lagoon mimics breaching processes identified worldwide. However, we 387
have also found specific differences that should be highlighted. Revised literature, dealing with openings 388
driven from the lagoon side of the barrier, relate the timing of barrier breaching to low tides, when the water-389
head difference is largest (Kraus et al., 2008; Rich and Keller, 2013; Rijkenberg, 2015). However, at Louro 390
this type of breaching seems to occur when the hydraulic gradient lagoon-sea is positive, independently of the 391
tidal elevation; Lw-type openings occurred close to the high, close to low or in low tide. In addition, it is worth 392
noticing that our case is one of the few showing natural, instead of human-induced, breaching. The latter is 393
usually provoked at low tides to maximize lagoon drainage and avoid hinterland flooding. Other point to 394
highlight is the fact that our records indicate that Lw-type only happens when the high water-level inside the 395
lagoon is maintained over time (long plateau phase), yet the actual breaching occurs only if the values of water-396
head difference are above1 m. Other examples described in the literature stated that the influence of the water-397
head difference is more important than the forcing for the actual rain (Rijkenberg, 2015), but in our case the 398
torrential nature of the river provokes that the water-head is directly due to the persistence of rainfall. Indeed, 399
the water-level records at Louro suggest that the greatest water-head differences only provoke barrier 400
breaching if the rain extends time enough to ensure barrier overflow from the lagoon. Per contra, if rainfall 401
stops the barrier might not be saturated and therefore breaching might be prevented (see event *, Figure 2 and 402
Table 2). 403
As stated in the results, the lagoon can maintain its connection with the open sea for a variable period of 404
time. However, this study contrast with previous works concluding that growing and stability of the channel 405
from the lagoon side mainly depends on the strength of the ebb-flow created by the volume of water stored 406
within the lagoon prior to openings (Cruces et al., 2009; Fortunato et al., 2014; Stretch and Parkinson, 2006). 407
This response is not observed in Louro, where the lifespan of the inlet seems to depend on the rainfall regime 408
and the wave climate. Sealing processes dominated by wave climate have been reported at other sites (Costas 409
et al., 2005; Dodet et al., 2013; Fortunato et al., 2014; Kraus et al., 2008). However, in those examples the 410
actual conditions promoting the closure are not clearly explained; it is simplified as a natural trend to close by 411
wave driven sediment transport when the outflow is sufficiently reduced. In this regard, it has been suggested 412
that inlet closure is at a great extent promoted by the onshore or longshore transport of the sediment originally 413
ejected by the breaching. The role of the onshore transport was also described in the closure of seasonally open 414
small tidal inlets by Ranasinghe and Pattiaratchi (2003) who demonstrated that onshore transport of material 415
can induce closure if the longshore sediment transport rate is small or inadequate. 416
Finally, we have explored the relation between the number of openings per year and the corresponding 417
local climate (Figure 2), finding that the number of openings decreased (increased) with the decreased 418
(increase) of the annual rainfall and with the decreased (increased) occurrence of erosive high and SW waves. 419
Climate projections for the Western Iberian region predict an upward trend of the NAO towards more positive 420
values and a greater frequency of warm and dry winters in the future (López-Moreno et al., 2011), leading to 421
a significant decline of the annual precipitation (Sáez de Cámara et al., 2015; Trigo et al., 2004; Trigo et al., 422
2008). Water-level monitoring at Louro provides supporting evidences that the lagoon waters may not be 423
renewed if rainfall is low or highly intermittent. If so, the system functionality may be negatively affected due 424
to the eutrophication, as water renewal can be dramatically reduced. Previous works documented that artificial 425
actions (barrier breaching) avoid or mitigate this situation enhancing system functionality (del Barrio 426
Fernández et al., 2012; Smith, 2003). However, if these actions are not well addressed the consequences for 427
the lagoons can be negative instead (De Decker, 1987; Dye and Barros, 2005; Netto et al., 2012). The present 428
work shows an example on how a monitoring program may contribute to the implementation of appropriate 429
management practices, through the definition of the relation between the principal variables governing barrier-430
breaching processes under changing environmental conditions. 431
432
6. CONCLUSIONS 433
In this work we present a monitoring program of water-level oscillations within Louro lagoon, a small 434
coastal lagoon, included in the Natura 2000 network of the EU, based on the analysis of a dataset expanding 435
more than 2 years. The monitoring included water-level observations in the lagoon and seaward. These datasets 436
are useful to locate accurately the opening timing and to establish the variables playing at breaching time with 437
climatic, wave and topographic data. The methodology proposed in this paper allows us to understand this 438
process at medium-term time scales. However, the co-occurrence of climate related processes (such as heavy 439
rainfall or sea storms) adds uncertainty in the identification of drivers during breaching. To account for those 440
uncertainties, we have first identified the events and then used additional data; i.e. topography, wave 441
parameters and rainfall to parametrize the variables responsible for lagoon opening. 442
We can parametrize three principal variables responsible for triggering the natural openings: Lwl, lagoon
443
water-level; Bh, barrier height and Bwl, beach water-level.
444
We found that each variable is dependent of other processes, in that way, the Lwl is highly modulated by the
445
rainfall regime, Bh is dependent of the wave climate (runup) and the Bwl depends on the tidal regime (tidal
446
height) and wave climate (runup). 447
Three types of openings were identified in function of the relation between these three variables: 448
• Lw-type, when Lwl ≥ Bhmin > Bwl; opening from the lagoon side, by lagoon water overflow.
449
• Sw-type; when Bwl ≥ Bhmax > Lwl; opening from the sea side, by wave overwash or lagoon
450
inundation 451
• Mx-type; when Lwl ≈ Bhmin < or > Bwl; the opening is triggered by a combination of processes from
452
both sides. 453
However, when Lwl < Bhmin > Bwl; there is no opening.
454
The natural openings are climate modulated, indeed the occurrence of the natural openings are linked to 455
rainfall regimes. The results suggest that if the projections are right, the study area will tend to register more 456
frequent warm and dry winters, which in turn will lead to a decrease on the annual precipitation and thus a 457
reduction on the communication of the lagoon with the open sea. The latter has negative consequences over 458
the lagoon ecosystem due to the reduction of its functionality. 459
With this work we prove that understanding how and when a lagoon opens naturally is possible and that it 460
can support and improve management practices. On the other hand, the quality and temporal extent of the 461
dataset provides a perfect framework for future work, which should include model calibration of opening and 462
closure processes. 463
7. ACKNOWDLEMENTS 464
Financial support was provided by grants from the Xunta de Galicia (08MDS036000PR) and MICINN 465
(CTM2012-39599-C03‐01). The authors would like to thank Puertos del Estado (Ministerio de Fomento) for 466
the SIMAR-44 database provided for this study and to the IGN (© Instituto Geográfico Nacional de España), 467
for providing the LiDAR data and aerial imagery. We thank the Regional Weather Forecast Agency 468
(MeteoGalicia) for kindly providing the climatic data. We also thank the members of the XM-1 group (U. 469
Vigo) for field assistance. R. González-Villanueva was funded by the Xunta de Galicia Post-Doc Fellowship 470
(PlanI2C-ED481B 2014/132-0). Susana Costas was founded by the Portuguese Science Foundation through 471
the “FCT Investigator” program (ref. IF/01047/2014). 472
8. REFERENCES 473
Almécija, C., 2009. Morfodinámica e hidrodinámica de una playa expuesta. Ejemplo de la playa de louro 474
(muros, nw península ibérica). Master Thesis Thesis, Universidad de Vigo, Vigo, 54 pp. 475
Almécija, C., Villacieros-Robineau, N., Alejo, I. and Pérez-Arlucea, M., 2009. Morphodynamic conceptual 476
model of an exposed beach: The case of louro beach (galicia, nw, iberia). Journal of Coastal Research, 477
SI 56: 1711-1715. 478
Battjes, J.A., 1974. Surf similarity. 14th Conference of Coastal Engineering, p.^pp. 466-480. 479
Bird, E.C.F., 1993. Physical setting and geomorphology of coastal lagoons. In: B. Kjerfve (Editor), Coastal 480
lagoon processes. Elsevier, Amsterdam, pp. 9–39. 481
Booij, N., Ris, R.C. and Holthuijsen, L.H., 1999. A third-generation wave model for coastal regions: 1. Model 482
description and validation. Journal of Geophysical Research: Oceans, 104(C4): 7649-7666. 483
Boon, J.D., 2004. Secrets of the tide : Tide and tidal current analysis and applications, storm surges and sea 484
level trends. Horwood Pub., Chichester, U.K. 485
Boothroyd, J., 1985. Tidal inlets and tidal deltas. In: R. Davis, Jr. (Editor), Coastal sedimentary environments. 486
Springer New York, pp. 445-532. 487
Castelle, B. et al., 2007. Dynamics of a wave-dominated tidal inlet and influence on adjacent beaches, 488
currumbin creek, gold coast, australia. Coastal Engineering, 54(1): 77-90. 489
Cayocca, F., 2001. Long-term morphological modeling of a tidal inlet: The arcachon basin, france. Coastal 490
Engineering, 42(2): 115-142. 491
Cobelo-García, A. et al., 2012. Temporal and diel cycling of nutrients in a barrier–lagoon complex: 492
Implications for phytoplankton abundance and composition. Estuarine, Coastal and Shelf Science, 493
110(0): 69-76. 494
Costas, S., Alejo, I., Vila-Concejo, A. and Nombela, M.A., 2005. Persistence of storm-induced morphology 495
on a modal low-energy beach: A case study from nw-iberian peninsula. Marine Geology, 224: 43-56. 496
Cruces, A., Freitas, M.C. and Andrade, C., 2009. Morphodynamics of the artificial inlet of santo andré coastal 497
lagoon (sw portugal) - tweleve years of monitoring. In: G. Flor Rodríguez, J. Gallastegui, G. Flor 498
Blanco and J. Martín LLaneza (Editors), 6º Simposio sobre el Margen Ibérico Atlántico MIA09, 499
Oviedo, pp. 233-236. 500
De Decker, H.P., 1987. Breaching the mouth of the bot river estuary, south africa: Impact on its bentthic 501
macrofaunal communities. Transactions of the Royal Society of South Africa, 46(3): 231-250. 502
del Barrio Fernández, P., Gómez, A.G., Alba, J.G., Díaz, C.Á. and Revilla Cortezón, J.A., 2012. A model for 503
describing the eutrophication in a heavily regulated coastal lagoon. Application to the albufera of 504
valencia (spain). Journal of Environmental Management, 112(0): 340-352. 505
Dodet, G. et al., 2013. Wave-current interactions in a wave-dominated tidal inlet. Journal of Geophysical 506
Research: Oceans, 118(3): 1587-1605. 507
Dussaillant, A., Galdames, P. and Sun, C.-L., 2009. Water level fluctuations in a coastal lagoon: El yali ramsar 508
wetland, chile. Desalination, 246(1-3): 202-214. 509
Dye, A. and Barros, F., 2005. Spatial patterns of macrofaunal assemblages in intermittently closed/open coastal 510
lakes in new south wales, australia. Estuarine, Coastal and Shelf Science, 64(2–3): 357-371. 511
Fagherazzi, S. and Priestas, A.M., 2012. Back-barrier flooding by storm surges and overland flow. Earth 512
Surface Processes and Landforms, 37(4): 400-410. 513
Figueiredo, S.A., Cowell, P. and Short, A., 2007. Intermittent backbeach discharge to the surfzone: Modes and 514
geomorphologic implications. Journal of Coastal Research, SI 50: 4. 515
FitzGerald, D.M., Kraus, N.C. and Hands, E.B., 2000. Natural mechanisms of sediment bypassing at tidal 516
inlets, US Army Corps of Engineers. 517
Fitzgerald, D.M., Penland, S. and Nummedal, D., 1984. Control of barrier island shape by inlet sediment 518
bypassing: East frisian islands, west germany. In: B. Greenwood and R.A. Davis (Editors), 519
Developments in sedimentology. Elsevier, pp. 355-376. 520
Fortunato, A.B. et al., 2014. Morphological evolution of an ephemeral tidal inlet from opening to closure: The 521
albufeira inlet, portugal. Continental Shelf Research, 73(0): 49-63. 522
Gale, E., Pattiaratchi, C. and Ranasinghe, R., 2006. Vertical mixing processes in intermittently closed and open 523
lakes and lagoons, and the dissolved oxygen response. Estuarine, Coastal and Shelf Science, 69(1–2): 524
205-216. 525
González-Villanueva, R., 2013. Origin, evolution and processes controlling holocene barrier-lagoon systems 526
(nw spain), Universidad de Vigo, 199 pp. 527
Goodess, C.M. and Jones, P.D., 2002. Links between circulation and changes in the characteristics of iberian 528
rainfall. International Journal of Climatology, 22(13): 1593-1615. 529
Gordon, A.D., 1981. Behaviour of lagoon inlets. National Conference Publication - Institution of Engineers, 530
Australia, p.^pp. 54-58. 531
Gordon, A.D., 1990. Coastal lagoon entrance dynamics. Coastal Engineering Proceedings(22). 532
Green, A., Cooper, J.A.G. and LeVieux, A., 2013. Unusual barrier/inlet behaviour associated with active 533
coastal progradation and river-dominated estuaries. Journal of Coastal Research: 35-45. 534
Hayes, M.O., 1979. Barrier islands morphology as a function of tidal and wave regime. In: S.P. Leatherman 535
(Editor), Barrier islands from the gulf of st. Lawrence to the gulf od mexico. Academic Press, New 536
York, pp. 1- 27. 537
Joseph, J., 1958. Studies of big lagoon, humboldt county, california 1956-1958. Master Thesis Thesis, 538
Humblodt State University, Humboldt, California, 137 pp. 539
Kraus, N.C., Militello, A. and Todoroff, G., 2002. Barrier breaching processes and barrier spit breach, stone 540
lagoon california. Shore & Beach, 70(4): 8. 541
Kraus, N.C., Munger, S. and Patsch, K., 2008. Barrier beach breaching from the lagoon side, with reference to 542
northern california. Shore & Beach, 2(76): 10. 543
Kraus, N.C. and Wamsley, T.V., 2003. Coastal barrier breaching. Part 1: Overview of breaching processes, 544
U.S. Army Engineer Research and Development Center, Vicksburg, MS. 545
López-Moreno, J.I. et al., 2011. Effects of the north atlantic oscillation (nao) on combined temperature and 546
precipitation winter modes in the mediterranean mountains: Observed relationships and projections 547
for the 21st century. Global and Planetary Change, 77(1–2): 62-76. 548
Martínez Cortizas, A. and Pérez Alberti, A., 1999. Atlas climático de galicia, Xunta de Galicia, 207 pp. 549
Moreno, I.M., Ávila, A. and Losada, M.Á., 2010. Morphodynamics of intermittent coastal lagoons in southern 550
spain: Zahara de los atunes. Geomorphology, 121(3–4): 305-316. 551
Morris, B.D. and Turner, I.L., 2010. Morphodynamics of intermittently open–closed coastal lagoon entrances: 552
New insights and a conceptual model. Marine Geology, 271(1–2): 55-66. 553
Netto, S.A., Domingos, A.M. and Kurtz, M.N., 2012. Effects of artificial breaching of a temporarily 554
open/closed estuary on benthic macroinvertebrates (camacho lagoon, southern brazil). Estuaries and 555
Coasts, 35(4): 1069-1081. 556
Osborn, T.J., Briffa, K.R., Tett, S.F.B., Jones, P.D. and Trigo, R.M., 1999. Evaluation of the north atlantic 557
oscillation as simulated by a coupled climate model. Climate Dynamics, 15(9): 685-702. 558
Pacheco, A., Ferreira, Ó. and Williams, J.J., 2011. Long-term morphological impacts of the opening of a new 559
inlet on a multiple inlet system. Earth Surface Processes and Landforms, 36(13): 1726-1735. 560
Penland, S. and Suter, J.R., 2011. Low-profile barrier islands overwash and breaching in the gulf of mexico. 561
Coastal Engineering Proceedings(19). 562
Pérez-Arlucea, M., Almécija, C., González-Villanueva, R. and Alejo, I., 2011. Water dynamics in a barrier-563
lagoon system: Controlling factors. Journal of Coastal Research(SI 64): 15-19. 564
Pierce, J.W., 1970. Tidal inlets and washover fans. The Journal of Geology, 78(2): 230-234. 565
Ranasinghe, R. and Pattiaratchi, C., 2003. The seasonal closure of tidal inlets: Causes and effects. Coastal 566
Engineering Journal, 45(04): 601-627. 567
Ranasinghe, R., Pattiaratchi, C. and Masselink, G., 1999. A morphodynamic model to simulate the seasonal 568
closure of tidal inlets. Coastal Engineering, 37(1): 1-36. 569
Rich, A. and Keller, E.A., 2013. A hydrologic and geomorphic model of estuary breaching and closure. 570
Geomorphology, 191: 64-74. 571
Rijkenberg, L., 2015. Wave-dominated tidal inlet systems: Processes which force opening and clossure of 572
intermittently open natural inlets. Master Thesis, Delft University of Technology, 152 pp. 573
Rodriguez-Fonseca, B. and de Castro, M., 2002. On the connection between winter anomalous precipitation 574
in the iberian peninsula and north west africa and the summer subtropical atlantic sea surface 575
temperature. Geophysical Research Letters, 29(18): 1863. 576
Roy, P.S. et al., 2001. Structure and function of south-east australian estuaries. Estuarine, Coastal and Shelf 577
Science, 53(3): 351-384. 578
Sáez de Cámara, E., Gangoiti, G., Alonso, L. and Iza, J., 2015. Daily precipitation in northern iberia: 579
Understanding the recent changes after the circulation variability in the north atlantic sector. Journal 580
of Geophysical Research: Atmospheres, 120(19): 9981-10,005. 581
Sallenger, A.H., Jr., 2000. Storm impact scale for barrier islands. Journal of Coastal Research, 16(3): 890-895. 582
Schallenberg, M., Larned, S.T., Hayward, S. and Arbuckle, C., 2010. Contrasting effects of managed opening 583
regimes on water quality in two intermittently closed and open coastal lakes. Estuarine, Coastal and 584
Shelf Science, 86(4): 587-597. 585
Smith, A.M., Guastella, L.A. and Goble, B.J., 2014. Forecasting lagoon outlet erosion: Kwazulu-natal, 586
southeast africa. Journal of Coastal Research: 151-155. 587
Smith, V., 2003. Eutrophication of freshwater and coastal marine ecosystems a global problem. Environ Sci 588
& Pollut Res, 10(2): 126-139. 589
Stockdon, H.F., Holman, R.A., Howd, P.A. and Sallenger Jr, A.H., 2006. Empirical parameterization of setup, 590
swash, and runup. Coastal Engineering, 53(7): 573-588. 591
Stretch, D. and Parkinson, M., 2006. The breaching of sand barriers at perched, temporary openclosed estuaries 592
- a model study. Coastal Engineering Journal, 48(01): 13-30. 593
Trigo, R.M. et al., 2004. North atlantic oscillation influence on precipitation, river flow and water resources in 594
the iberian peninsula. International Journal of Climatology, 24(8): 925-944. 595
Trigo, R.M. et al., 2008. The impact of north atlantic wind and cyclone trends on european precipitation and 596
significant wave height in the atlantic. Annals of the New York Academy of Sciences, 1146(1): 212-597
234. 598
Turner, I.L., Rau, G.C., Austin, M.J. and Andersen, M.S., 2016. Groundwater fluxes and flow paths within 599
coastal barriers: Observations from a large-scale laboratory experiment (bardex ii). Coastal 600
Engineering, 113: 104-116. 601
Vidal-Juárez, T., Ruiz de Alegría-Arzaburu, A., Mejía-Trejo, A., García-Nava, H. and Enríquez, C., 2014. 602
Predicting barrier beach breaching due to extreme water levels at san quntín, baja california, mexico. 603
Journal of Coastal Research: 100-106. 604
Wainwright, D.J. and Baldock, T.E., 2015. Measurement and modelling of an artificial coastal lagoon breach. 605
Coastal Engineering, 101: 1-16. 606
Weidman, C.R. and Ebert, J.R., 2013. Cyclic spit morphology in a developing inlet system, Formation and 607
evolution of multiple tidal inlets. American Geophysical Union, pp. 186-212. 608
Zietsman, I., 2004. Hydrodynamics of temporary open estuaries, with case studies of mhlanga ans mdloti. 609
Master Thesis Thesis, University of Kwa-Zula Natal, South Africa, 131 pp. 610
611 612