jy^^epsidade do Algarve
FACULDADE DE ENGENHARIA DE RECURSOS NATURAIS ENGENHARIA BIOTECNOLÓGICA
Cranfield / l Sl\ I KSII ^ Silsoe
Cranfield Health
Master of Science in Molecular Medicine
Ana Rita Diogo Martins Vaz N0 20363
INVESTIGATION OF THE PRESENCE AND EXPRESSION OF THE CYCLOPHILIN A PSEUDOGENE IN NCI-H596 LUNG CELL UNE
Universidade do Algarve
Faculdade de Engenharia de Recursos Naturais Engenharia Biotecnológica
&
Cranfield University Cranfield Health MSc in Molecular Medicine
Ana Rita Diogo Martins Vaz N020363
INVESTIGA TION OF THE PRESENCE AND EXPRESSION OE THE CYCLOPHILIN A PSEUDOGENE IN NCI-H596 LUNG CELL LINE
AND ITS EXPRESSION IN OTHER CELL LINES
Supervisors: Dr Tracey Bailey Dr José António Belo
August 2006
This thesis is submitted in partial fulfílment of the requirements for the degree of Master of Science
O Cranfield University, 2005. Ali rights reserved. No part of this publication may be reproduced without the written permission of the copyright holder
UflIVuRSlCADt DO Al-OAR-ZE SERVtÇO CE OOCUMiWTAÇAO hhcZclr é"q3t ;5
CH 1
Abstract
Lung câncer is one of the most studied cancers and it is the number one cause of câncer deaths in Europe and United States. Prostate câncer is the most common malignancy among the males in the Western world and both of them are associated with several risk conditions.
Cyclophilin A pseudogene is a sequence present on the human chromosome 1 and when investigated by Inter-SSR PCR, showed an increase of intensity in the lung NCI-H596 cell line. After sequencing, a single nucleotide polymorphism was identified in that sequence.
In order to examine the relation between the single nucleotide polymorphism and câncer, the presence and expression of the PPIA pseudogene was studied in that lung câncer cell line and also in other cell lines from lung and prostate.
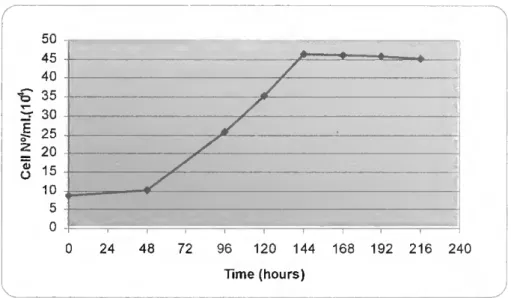
The cellular proliferation and morphology were also assessed showing that câncer cells and "normal" cells exhibited a certain number of differences. Câncer cells achieved higher leveis of cellular proliferation compared with normal cells, probably due to the contact inhibition effect and anchorage dependent growth of normal cells. Morphologically, câncer cells did not exhibit constant characteristics compared to "normal" cell that grew as a uniform monolayer.
In order to test the viability of the genomic specific primers to anneal with the template DNA, three different annealing temperatures were tested during the optimization process of the PCR.
During the performance of the RT-PCR no results were obtained with the conditions that were applied to technique. It would be necessary perform further studies in order to know whether or not the PPIA pseudogene is being expressed in that particular lung cell line.
Acknowledgments
Firstly I would like to tank my mother and father for always supporting me in ali my decisions and for giving me this great opportunity. Amo-vos muito.
Very special thanks to my uncle for always encourage me to go further.
Thanks to my very special friend Stephen who is always supporting me.
I would like to tank also Dr. Tracey Bailey who was my supervisor, Dr. Sarah Morgan and Jo for helping me in the lab, and Aurore, Ana, Natasha, Sarah, Namita and Emanuel for sharing some nice moments in the lab.
A very big thank you to Natasha, who helped me formatting my thesis.
Contents ABSTRACT ACKNOWLEDGMENTS CONTENTS 1 LIST OF FIGURES ABBREVIATIONS '' CHARTER 1 - INTRODUCTION 1.1 -Câncer ^ 1.1.1. Lung Câncer ' 1.1.2. Prostate Câncer. 3
1.2 - Cell Cycle and Alteration in Câncer 4
1.2.1. The p53 tumour suppressor gene 6
1.2.2. The pRb tumour suppressor gene 7
1.2.3. Cyclins ^
1.3 - Progression of Câncer 9
1.4 - GENETIC CHANGES IN LUNG CÂNCER 10
1.4.1. The p53 tumour suppressor gene 11
1.4.2. The pRb tumour suppressor gene 11
1.4.3. The p16INK4 gene 12
1.4.4. Microsatellites 13
1.5- Genome analysis techniques 13
1.5.1. Comparativa genomic hybridization 14
1.5.2. Inter-simple sequence repeats polymerase chain reaction 15 1.5.3. Techniques Required to Identify Genome Changes 18
1.6 - PSEUDOGENES 19
1.7 - Objectives 20
1.7.1. Cell Cultura 20
1.7.2. Reverse Transcriptase - Polymerase Chain Reaction 21 CHARTER 2 - MATERIALS AND METHODS
2.1 -Cellgrowth INVITRO 22
2.1.1. Cell Unes and media requirements 22
2.1.2. Cell culture techniques 23
2.2 - Nucleic acids extraction 27
2.2.1. Extraction ofDNA 27
2.2.2. Extraction of total RNA 23
2.2.3. Nucleic acids quantification 29
2.3 - Nucleic acids amplification 31
2.3.1. Reverse transcriptase (RT) 31
2.3.2. Polymerase chain reaction (PCR) 31
2.3.3. Electrophoresis 32
CHARTER 3 - RESULTS
3.1 - Cellular proliferation 34
3.1.1. Lung cell Unes 34
3.1.2. Prostate cell Unes 35
3.2 - Cellular morphology 37
3.2.2. Prostate cell Unes 39
3.3 - NUCLEIC ACIDS AMPLIFICATION 41
3.3.1. PCR optimization 41
3.4- PPIA PSEUDOGENE MRNA EXPRESSION 44
CHAPTER 4 - DISCUSSION 47
4.1 - Cellular proliferation 47
4.2 - Cellular morphology 48
4.3 - NUCLEIC ACIDS AMPLIFICATION 49
4.3.1. PCR optimization 49
4.3.2. PPIA pseudogene mRNA expression 50
CHAPTER 5 - CONCLUSION 54
REFERENCES 55
List of Figures
Figure 1.1 - The cell division cycle and its control [19] 5 Figure 1.2 - The sequential steps during tumour angiogenesis [16] 10 Figure 1.3 - Diagram illustrating the principies of comparative genomic
hybridization (CGH). CGH; Tumour and reference DNA are labelled with green AND RED FLUOROPHORES, RESPECTIVELY, AND HYBRIDIZED TO NORMAL LYMPHOCYTE METAPHASE SPREADS. FlFTEEN-20 METAPHASES ARE CAPTURED USING A FLUORESCENCE MICROSCOPE COUPLED WITH A DIGITAL CAMERA. GREEN TO RED SIGNAL RATIOS ARE QUANTIFIED DIGITALLY FOR EACH CHROMOSOMAL REGION ALONG THE CHROMOSOMAL AXIS
[28] 15
Figure 1.4 - Inter-simple sequence repeat (inter-SSR) PGR principle [21 ] 16 Figure 1.5 - Band altering events detected by Inter-SSR PCR [29] 16 Figure 1.6 - Part of the cyclophilin A pseudogene sequence where the genomic
alteration was identified. Where is a thymine (t) in red should be a cytosine (c) 18 Figure 2.1 - A cover slip is moistened and placed on the haemocytometer covering
THE 2 CENTRAL CHANNELS [40] 25
Figure 2.2 - Diagram of the grid on the haemocytometer each of the 9 squares is 1 MM AND THE DEPTH BETWEEN THE COVERSLIP AND GRID IS 0.1 MM [40] 26 Figure 3.1 - Cellular proliferation of the NCI-H596 (lung adenosquamous
CARCINOMA) CELL LINE 35
Figure 3.2 - Cellular proliferation of the HBE135-E6E7 ("normal" lung) cell line 34 Figure 3.3 - Cellular proliferation of the PC-3 (prostate adenocarcinoma) cell
LINE 36
Figure 3.4 - Cellular proliferation of the PNT-1A ("normal" prostate) cell line 36 Figure 3.5 - Cellular morphology of NC1-H596 cells. These cells represent the
SEVENTH PASSAGE OF CELLULAR GROWTH. A) IMAGE OBTAINED USING THE 10X PHASE OBJECTIVE AND REPRESENTING A CELLULAR CONFLUENCE OF 100%. B) IMAGE OBTAINED USING THE 20X PHASE OBJECTIVE AND REPRESENTING A CELLULAR CONFLUENCE OF 1 00% 38 Figure 3.6 - Cellular morphology of HBE135-E6E7 cells. These cells represent the
FIFTH PASSAGE OF CELLULAR GROWTH. A) IMAGE OBTAINED USING THE 20X PHASE OBJECTIVE AND REPRESENTING A CELLULAR CONFLUENCE OF APPROXIMATELY 50%. B) IMAGE OBTAINED USING THE 10X PHASE OBJECTIVE AND REPRESENTING A CELLULAR
CONFLUENCE OF 100% 37
Figure 3.7 - Cellular morphology of apoptotic HBE135-E6E7 cells. These cells REPRESENT THE FIFTH PASSAGE OF CELLULAR GROWTH AND THIS IMAGE WAS OBTAINED
AND REPRESENTING A CELLULAR CONFLUENCE OF 30%. B) IMAGE OBTAINED USING THE 20X PHASE OBJECTIVE AND REPRESENTING A CELLULAR CONFLUENCE OF 50% 39 Figure 3.9 - Cellular morphology of PC-3 cells. a) These cells illustrate the
TWENTY SECOND PASSAGE OF CELLULAR GROWTH WITH A CONFLUENCE OF ALMOST 100%. THE IMAGE WAS OBTAINED USING THE 20X PHASE OBJECTIVE. B) IMAGE OBTAINED FROM THE ATCC CATALOGUE SHOWING A LOW DENSITY OF CELLS. C) IMAGE OBTAINED FROM THE ATCC CATALOGUE SHOWING A HIGH DENSITY OF CELLS 40 Figure 3.10 - Cellular morphology of PNT-1A cells. These cells represent the
EIGHTH PASSAGE OF CELLULAR GROWTH. A) IMAGE OBTAINED USING THE 10X PHASE OBJECTIVE AND REPRESENTING A CELLULAR CONFLUENCE OF 70%. B) IMAGE OBTAINED USING THE 20X PHASE OBJECTIVE AND REPRESENTING A CELLULAR CONFLUENCE OF 70% 41 Figure 3.11 - PCR products in 1% (w/v) agarose gel stained in ethidium bromide
SHOWING SEVERAL UNWANTED SIDE REACTIONS. THE AMPLIFICATION WAS PERFORMED USING AN ANNEALING TEMPERATURE OF 520C. LANES 1,2,7 AND 8 REPRESENT DNA FROM
PC-3 CELLS AND LANES 3, 4, 9 AND 10 REPRESENT DNA FROM PNT-1 A CELLS. LANES 1 TO 5 ARE THE PRODUCTS OF REACTIONS PERFORMED WITH 10XPCR BUFFER. LANES 7 TO 11 ARE THE PRODUCTS OF REACTIONS PERFORMED WITH 10X CORALLOAD PCR BUFFER. Lanes 5 and 11 are negative controls and lane 6 is a 100bp DNA ladder 42 Figure 3.12 - PCR products in 1% (w/v) agarose gel stained in ethidium bromide. The
AMPLIFICATION WAS PERFORMED USING AN ANNEALING TEMPERATURE OF 580C. LANE 1 IS A
100BP DNA LADDER. LANES 2 AND 3 REPRESENT DNA FROM PC-3 CELLS AND LANES 4 AND 5 REPRESENT DNA FROM PNT-1 A CELLS. LANES 6 IS THE NEGATIVE CONTROL 43 Figure 3.13 - PCR products in 1% (w/v) agarose gel stained in ethidium bromide. The
AMPLIFICATION WAS PERFORMED USING AN ANNEALING TEMPERATURE OF 550C. LANE 1 IS A
100BP DNA LADDER. LANES 2 AND 3 REPRESENT DNA FROM PC-3 CELLS AND LANES 4 AND 5 REPRESENT DNA FROM PNT-1 A CELLS. LANES 6 IS THE NEGATIVE CONTROL 43 Figure 3.14 - RT-PCR products in 1% (w/v) agarose gel stained in ethidium bromide.
Lane 1 is a 100bp DNA ladder. Lanes 2 and 3 represent mRNA from NCI-H596 CELLS REVERSE TRANSCRIBED INTO CDNA WITH OLIGO(DT)20 AND RANDOM-HEXAMER PRIMERS RESPECTIVELY. LANES 4 AND 5 REPRESENT CDNA FROM HBE135-E6E7 CELLS REVERSE TRANSCRIBED WITH OLIGO(DT)20 AND RANDOM-HEXAMER PRIMERS RESPECTIVELY. LANES 6 AND 7 REPRESENT CDNA FROM PC-3 CELLS REVERSE TRANSCRIBED AND AMPLIFIED WITH B-ACTIN PRIMERS RESPECTIVELY. LANE 8 IS THE NEGATIVE CONTROL AND LANE 9 REPRESENT NCI-H596 DNA AMPLIFIED WITH B-ACTIN PRIMERS 45 Figure 3.15 - RT-PCR products in 1% (w/v) agarose gel stained in ethidium bromide.
Lanes 1 and 13 are the 100bp DNA ladder. Lanes 2 and 3 represent mRNA from NCI-H596 CELLS REVERSE TRANSCRIBED INTO CDNA WITH RANDOM-HEXAMER AND GENE
SPECIFIC PRIMERS RESPECTIVELY. LANE 4 REPRESENTS THE POSITIVE CONTROL WITH B- ACTIN PRIMERS AND NCI-H596 MRNA. LANES 5 AND 6 REPRESENT MRNA FROM HBE135- E6E7 CELLS REVERSE TRANSCRIBED INTO CDNA WITH RANDOM-HEXAMER AND GENE SPECIFIC PRIMERS RESPECTIVELY. LANES 7 AND 8 REPRESENT MRNA FROM PC-3 CELLS REVERSE TRANSCRIBED INTO CDNA WITH RANDOM-HEXAMER AND GENE SPECIFIC PRIMERS RESPECTIVELY. LANE 9 AND 10 REPRESENT MRNA FROM PNT-1A CELLS REVERSE TRANSCRIBED INTO CDNA WITH RANDOM-HEXAMER AND GENE SPECIFIC PRIMERS RESPECTIVELY. LANE 11 IS THE NEGATIVE CONTROL AND LANE 12 REPRESENT NCI-H596 DNA AMPLIFIED WITH B-ACTIN PRIMERS 46 Figure 4.1 - Optimization of RT-PCR conditions. An image of PGR products amplified
WITH INCREASING NUMBERS OF PCR CYCLES IS SHOWN AT TOP OF THE PANEL. PCR PRODUCTS WERE SEPARATED BY ELECTROPHORESIS IN 2% AGAROSE GELS AND STAINED WITH ETHIDIUM BROMIDE. THE AMOUNT OF MRNA AMPLIFIED IN EACH SAMPLE WAS QUANTIFIED BY DENSITOMETRY AND PLOTTED AGAINST THE CYCLE NUMBER [49] 51
List of Tables
TABLE 2.1- DNA SEQUENCES OF THE FORWARD AND REVERSE PRIMERS USED TO ACCOMPLISH THE PGR REACTION DESIGNED BY DAVID BROOMHEAD [31] 31 TABLE 2.2- DNA SEQUENCES OF THE B-ACTIN FORWARD AND REVERSE PRIMERS USED TO PERFORM THE POSITIVE CONTROL DURING THE RT-PCR AND WHICH WERE DESIGNED
Abbrevíations
CDK - Cyclin Dependent Kinase
CGH - Comparative Genomic Hybridisation DNA - Deoxyhbonucleic acid
ECM - Extracellular Matrix EGF - Epidermal Growth Factor
EGFR - Epidermal Growth Factor Receptor GF - Growth Factors
Inter - SSR PGR - Inter-Simple Sequence Repeats Polymerase Chain Reaction NSCLC - Non-Small Celi Lung Carcinoma
PCR - Polymerase Chain Reaction PPIA - Peptidylpropyl Isomerase A pRb - Retinoblastoma Protein PSA - Prostate Specific antigen Rb - Retinoblastoma
RNA - Ribonucleic Acid
RT-PCR - Reverse transcriptase - Polymerase Chain Reaction SCLC - Small Celi Lung Carcinoma
Chapter 1 - Introduction
1.1 -Câncer
Câncer is the result of uncontrolled duplication of abnormal cells, and presents an enormous public heath problem in the developed countries. Currently, it is the major cause of mortality in the UK and is diagnosed each year in one in every 250 men and one in every 300 women. In the United States one in four deaths is due to câncer. Usually, it is a costly disease to diagnose and investigate, and treatment is time consuming, labour intensive and normally requires hospital care. The most common cancers in the western world are the lung, breast, skin, gut and prostate [1], [2], [3].
This study will focus only on lung and prostate cancers.
1.1.1. Lung Câncer
1.1.1.a. Incidence
Lung câncer is one of the most studied cancers and it is the number one cause of câncer deaths in Europe and United States, and is a serious world health problem [4], [5],
The incidence of lung câncer is high in individuais around 65 years who started smoking before the age of 20 years old, allowing for the required induction time of the habit. However, after the age of 80 years the incidence declines because the habit of smoking between elder individuais is low and because people who reach such ages are thought to be genetically resistant to certain risk factors [4],
The disease kills nearly 160,000 people per year in North America, exceeding the deaths from colorectal, breast and prostate câncer combined. Until recently, lung câncer was the most frequently occurhng câncer in the UK, however, it has been overtaken by breast câncer. It accounts for approximately 1 in 7 new câncer cases, corresponding to 37,700 new patients annually [4], [6], [7].
In terms of gender, there are more cases of lung câncer in men in Bastem Europe however the numbers of women being diagnosed has increased. In the other hand. in North America the incidence is higher in women [4], [5],
1.1.1.b Symptoms, Risk Factors, Classiflcation and Díagnosis
The symptoms and signs of lung câncer are highly non-specific leading to a high lethality levei. However the most common symptoms of this disease are cough most of the time, shortness of breath, coughing up phlegm (sputum) with signs of blood in it, ache or pain when breathing or coughing, loss of appetite, fatigue and lost of weight [4], [8].
There are several risk factors associated with this type of câncer. Some are intrinsic because they are inherent to the individual, such as genetic susceptibility, family history of câncer, sex, race, age and previous respiratory diseases, and others are extrinsic or environmental and are related with factors extraneous to the individual, such as tobacco use, diet, occupation and environmental pollution [4].
According to Barros-Dios et al (2003) the major causative factors in the development of lung câncer are the extrinsic ones, and the tobacco use is the main risk factor between them. It is estimated that approximately 85-90% of ali pulmonary neoplasias derive from the habit of smoking [4].
Normal lung cells are transformed into câncer cells due to the carcinogenic substances contained into the cigarette smoke, and this risk of developing smoking- related lung câncer can be dependent on the duration and intensity of habit, age at initiation and type of tobacco [4], [6],
Occupation is also a strong extrinsic factor causative of lung câncer when workers are exposed to carcinogens in their place of work. In the European Union this scenario is real for 23% of the workers because they are engaged in occupations in which chemical compounds are handled or when their works involve the contact with dust or microscopic particles [4].
The family history is the major causative factor between the intrinsic risk factors and the second one after tobacco use. The risk is higher in individuais under the age of 59 years with a history of lung câncer among first-degree blood relatives. In the same way, first-degree blood relatives of any câncer sufferer have twice the probability of developing lung câncer, which is more common in families with a record of breast and ovarian câncer [4].
Lung câncer arises from transformed lung epithelial cells, progresses into a tumour mass which then may metastasize through lymph node channels and/or through direct invasion into blood vessels, and finally spread throughout the entire body [6].
The lung câncer diagnosis is based on several techniques such as chest x- ray which is the most common first diagnostic step when any new symptoms of lung câncer are present, computerized axial tomography scan that may be performed on the chest, abdómen, and/or brain to examine for both metastatic and primary tumour, Magnetic resonance imaging in order to indicate with precise detail about the location of the tumour, positron emission tomography used to determine whether a tumour tissue is actively growing and the type of cells within a particular tumour, several types of biopsy, etc.[9]
AH biopsy samples are examined under a microscope by a pathologist in order to discover the origin of the câncer but if this procedure does not help further testing such as immunohistochemistry, electron microscopy, flow cytometry, cytogenetics and molecular genetic testing must be done [10].
The most widely accepted histologic classification for lung câncer tumours was proposed by the World Health Organization (WHO) in 1981, and the four major histologic types of lung câncer are sauamous cell carcinoma, adenocarcinoma. small cell lung carcinoma (SCLC), and laroe lung carcinoma. These four different types of tumour can be subclassified into specific subtypes [11]. Squamous cell carcinoma, adenocarcinoma and large cell carcinoma are collectively referred to as non-small lung cancers (NSCLC) because their clinicai behaviour and therapeutic approaches are similar [6].
1.1.2. Prostate Câncer
Prostate câncer is the most common malignancy in European males. In 2002 in Europe, an estimated 225,000 men were newly diagnosed with prostate câncer and about 83,000 died from this disease. In the United States of America between 2000 and 2005 more than 1 million men were newly diagnosed with this disease [12], [13].
Aging is the single most significant risk factor for prostate câncer however preneoplastic lesions named prostatic intraepithelial neoplasia can be found in men in their twenties and are fairly common in men by their fifties. Normally this disease
is not manifested until the age of 60 or 70 and the occurrence of precancerous lesions is significantly more prevalent (1 in 3 men) than the incidence of carcinoma (1 in 9 men) [14].
Prostate câncer is diagnosed by histological examination of prostate tissue which is obtained by ultrasound guided transrectal biopsy [12]. Currently there is no unequivocal serum or urine marker indicating the presence of prostate câncer, at least in its earlier stages [15]. Indications for biopsy are predominantly an aberrant digital rectal examination and/or an increased serum prostate specific antigen (PSA) which is not a prostate câncer marker [12], [13].
PSA is an enzyme synthesized by normal prostate cells and secreted in the prostatic fluid, a tiny amount of PSA is also released in the blood. Any acute or chronic, benign or malignant, prostatic disease will increase the "leak" into the bloodstream and increase the amount of detectable PSA [13]. The use of PSA testing has led to a lower tumour stage and grade at the time of diagnosis [12],
As in lung câncer, the stage of prostate câncer tells the doctor how far the câncer has spread and also provides the doctor with Information about the best treatment to prescribe [16]. In its initial stages, when confined to the prostatic capsule, prostate carcinoma is essentially curable by surgical intervention and/or radiation therapy [14].
Prostate câncer arises from transformed prostate epithelial cells and progresses inside the prostate gland. It may then grow into the neck of the bladder or the seminal vesicle after breaking the covering of the prostate, and finally
metastasize to another part of the body, most probably to the bonés [16], [14].
1.2 - Celi Cycle and Alteration in Câncer
Like ali eukaryotic cells, mammalian cells are bound to follow the cell cycle, during which DNA replication occurs followed by segregation of replicated chromosomes into two separated cells. The cell division is divided into two stages; mitosis (M), the process of nuclear division, and interphase which occurs between two M phases, as illustrated in figure 1.1 [17].
Mitosis includes four stages: prophase, metaphase, anaphase and telophase; and interphase includes three: G1, S and G2 phases. The replication of DNA occurs in phase S, then during phase G1, which precedes phase S, the cell is preparing for
DNA synthesis. Phase S is preceded by phase G2 where the cell prepares for mitosis [17].
Celis in G1 can, before commitment to DNA replication, enter a resting state called GO. In this stage, cells account for the major part of the non-growing, non- proliferating cells in the human body [17].
If the conditions are unsuitable for growth the cells may respond with cell death through a mechanism named apoptosis, the programmed cell death. AH mammalian cells contain the genetic programme for apoptosis which results in the packaging of the whole cell into small membrane-bounded named apoptotic bodies. Conditions that provoke apoptosis include the lack of growth factors or serum, nutrient limitation and mechanical stress [18].
In câncer, there are fundamental alterations in the genetic control of cell division, resulting in an unrestrained cell proliferation [17].
Mutations mainly occur in two classes of genes, the proto-oncogenes and the tumour suppressor genes. In normal cells, the products of proto-oncogenes act at different leveis along the pathways that stimulate cell proliferation. Mutated versions of proto-oncogenes or oncogenes can promote tumour growth [17].
Inactivation of tumour suppressor genes like p53 and pRb results in dysfunction of proteins which usually inhibit cell cycle progression. Cell cycle deregulation associated with câncer occurs through mutation of proteins important
at different leveis of the cell cycle. In câncer, mutations have been observed in genes encoding CDK, cyclins, CDK-activating enzymes, CKI, CDK substrates, and checkpoint proteins [17].
1.2.1. The p53 tumour suppressor gene
The checkpoint or tumour-suppressor protein p53 is one of the important proteins encoded by checkpoint gene and mutations in that gene are present in over 50% of carcinomas of lung and bowel [19], [20], It is a recessive gene and so a malignant transformation requires the functional loss of both copies of the gene, either two somatic mutational events or, in the presence of one mutated germline gene, with a single somatic mutation in its allele [20].
Both G1/S and G2/M check points are regulated by the p53 gene product however it does not appear to play an important role in the mitotic spindle check point since the gene knockout of p53 does not alter mitosis [19].
The p53 tumour-suppressor gene is the most frequently mutated gene in human câncer, indicating its important role in conservation of normal cell cycle progression. The amino-terminal sequences of p53 function as a transcriptional activation domain and the carboxy-terminal sequences appear to be required for p53 to form dimers and tetramers with itself [19].
It has been shown that the transcription of genes with roles in the control of the cell cycle, including WAF1/CIP1/p21 (encodes a regulator of Cdk activity), GADD45 (a growth arrest DNA damageinducible gene), MDM2 (encodes a protein that is a known negative regulator of p53), is activated by p53 [19].
One of the essential roles of p53 is to arrest cells in G1 phase after genotoxic damage, to allow for DNA repair prior to DNA replication and cell division. In response to massive DNA damage, p53 triggers the apoptotic cell death pathway. However tumour cells lacking normal p53 function do not arrest in G1 and are more likely to progress into S or G2/M and die [19].
The antiproliferative effect of the wild type p53 is mediated by stimulation of a 21 kDa protein (p21cip/waf1 ),a CKI. that inhibits cyclin-dependent kinase activity, including cyclin D/CDK4 or 6 as well as cyclin E/CDK2 and thereby cell division. So, the damaged DNA ohginates a signal that may activate p53 by post-translational modification. High p53 activity up-regulates p21CIP1, preventing the activation of
CDKs, required for the G1 to S transition. This negativo cell cycle controller effect can be a reason to explain why the wild type p53 gene can suppress the transformation of cells by activated oncogenes, thus inhibiting the growth of malignant cells in vitro and suppressing the tumourigenic phenotype in vivo [19].
1.2.2. The pRb tumour suppressor gene
The pRb tumour suppressor gene is another fundamental cell cycle regulator and is located on chromosome ISqU, encoding the retinoblastoma protein (pRb). Gross DNA abnormalities in the Rb gene were found in approximately 20% of SCLC cell lines, while mRNA expression was absent 60% of cell lines [19].
Rb is a recessivo gene and, in the same way as p53, malignant transformation requires loss of function of both copies on the gene. A germline mutation in hereditary retinoblastoma is characterized by early onset. In the other hand, loss of Rb function later in life is associated with SCLC and osteogenic sarcoma [20].
It is known that pRb is a master regulator for transcription. The presence of the Rb protein is essential for G1 to S phase transition in the cell cycle. This protein interacts with the E2F family of cell cycle transcription factors in order to repress gene transcription which is required for this transition, as illustrated in figure 1.1. pRb, through its interaction with E2F, also regulates genes that control apoptosis. The protein product of the retinoblastoma susceptibility gene is also able to form
heteromeric complexes with cyclin D [19].
pRb not only regulates the activity of certain protein-encoding genes, but also the activity of RNA polymerase pol l and pol II transcription. It appears to be the most important factor in the regulatory circuit named restriction point which occurs in the late G1 phase [19].
The Rb pathway with 97 genes as physiological targets is a signal transduction pathway which is formed by the members of the Rb family. This pathway has an important role in cell cycle regulation and is involved in growth progression, differentiation and apoptosis in different organisms and cell types [19],
The checks and balances that exist between pRb and p53 involve the regulation of the G1/S transition and its checkpoints which are controlled by the E2F transcription family. It is also know that proliferation, cell death and differentiation of
distinct tissues are also intimately linked through entrance and exist from the cell cycle and thus through pRb and p53 pathways [19].
The cell is maintained by phosphorylation and dephosphorylation of the cell cycle gene products by cyclin/Cdk complexes, the last being a group of proteins present at the interphase cell [19].
1.2.3. Cyclins
Cyclins are a family of proteins which were firstly discovered in rapidly dividing cells and are implicated in the mitosis of ali eukaryotes. They are 56 kDa proteins centrally involved in cell cycle regulation and they also are regulatory subunits of holoenzymecyclin through cell cycle checkpoints by phosphorylating and inactivating target substrates, as illustrated in figure 1.1 [19].
According to immunohistochemistry studies on hepatocellular carcinomas performed by Zhu M. H. et al. (2003), cyclins in different cell cycles were overexpressed at varied leveis in that type of câncer. This may shorten the tumour cell cycle, accelerate cell proliferation, and have a close relationship with hepatocellular carcinomas aggressiveness [21].
Many hormones and growth factors that influence in turn cellular growth through signal transduction pathways, modify cyclin activity which, when de- regulated, provokes the acceleration of the cell cycle progression in transformed cells [19].
Cyclin A has some interesting roles among the cyclin family because it can activate two different cyclin-dependent kinases (Cdks) and function in both S phase and mitosis. Phosphorylation of components of the DNA replication machinery in S phase such as CDC6 by cyclin A-Cdk is believed to be important for initiation of DNA replication and to restrict the initiation to only once per cell cycle. In mitoses, the precise role of Cyclin A is not completely known, but it may play a role in the control of Cyclin B stability. During S phase cyclin A starts to accumulate and is destroyed before metaphase in advance of cyclin B which persists until metaphase. The overexpression of both cyclins A and E, especially the first one, was demonstrated by Li-Jian Liang (2003) in hepatocellular carcinomas lesions [19], [22]. Progression through each phase of cell cycle is controlled by the activity of different cyclin-dependent kinases (Cdks) and their regulatory subunits. The Cdks control the G1 to 8 phase transition whereas complexes such as Cdk2, cyclin E are
important for initiation of the S phase. Cdkcyclin complexes act on specific targets which belong to at least two major regulatory networks: the Rb-related/E2F pathway and complexes that are responsible for the initiation of DNA replication [19].
1.3 - Progresslon of Câncer
Progression of câncer is, in part, based on the multi-step process of carcinogenesis through progressiva changes in both tumour suppressor genes and oncogenes which are responsible for the transformation of normal cells into malignant ones [6].
The multi-step process is caused by series of abnormalities which provoke the activation of distinct pathways named the "hallmarks of câncer" [6]. Hanahan et al. (2000) suggested that the câncer is a manifestation of six essential alterations, the hallmarks, in cell physiology that collectively lead to malignant growth, and which are self-sufficienty in growth signals, insensitivity to growth-inhibitory (antigrowth) signals, evasion of pro-grammed cell death (apoptosis), limitless replicative potential, sustained angiogenesis, and tissue invasion and metastasis [23].
Câncer cells have defects in regulatory circuits that govern normal cell proliferation and homeostasis. There are more than 100 distinct types of câncer, and subtypes of tumours can be found within specific organs [6].
In order to grow and metastasize hematogenically those tumours need to be supplied with oxygen and essential nutrients which happen through angiogenesis, the formation of new blood vessels [24].
The angiogenic factors are secreted when a growing tumour activates surrounding vessels provoking the "angiogenic switch" by changing the dormant tumour phenotype into an angiogenic one. Activated endothelial cells have to migrate toward the tumour along a newly formed matrix and the matrix components are synthesized by tumour cells and other cells such as macrophages and fibroblasts. The process of tumour angiogenesis is illustrated in figure 1.2 and can be divided into four stages:
Stage 1 - A small and dormant tumour can, depending on the nature of the tumour and its microenvironment, make the angiogenic switch to ensure exponential growth.
Stage 2 - The tumour secretes growth factors (GF) to activate endothelial cells of surrounding vessels.
Stage 3 - After activation, these endothelial cells start to migrate and proliferate toward the tumour. Only one endothelial cell starts an angiogenic sprout and develops into an endothelial tip cell migrating along the extracellular matrix (ECM) and guiding the following so-called stalk endothelial cells.
Stage 4 - Finally, the growing tumour is connected to the vasculature and later can metastasize [24].
Tumor ECM Endothelium . • •V^Vvv. -GF TC - - m « v _ Vessel lúmen
Figure 1.2 - The sequential steps during tumour angiogenesis [16].
After growth and proliferation, the tumour can metastasize. Malignant tumour cells, by invasion of the vessels, ECM degradation, attachment, and homing to target sites can form distai metástases [24].
The process of tumour angiogenesis results in a tumour-associated vasculature which is rather chaotic, both in structure and function. Tumour vessels have a non-continuous endothelium, an enlarged basal membrane, and an aberrant pericyte coverage, when compared with normal vessels [24],
1.4 - Genetic changes in lung câncer
Multiple genetic changes are involved in the development and progression of lung câncer, and have been identified as being inactivating mutations of tumour suppressor genes, activating mutations of oncogenes, amplifications of specific chromosomal regions and loss of heterozygosity which in other words means deletion of one of two copies of allelic DNA sequences in particular chromosomal regions. These molecular changes may be used as molecular markers for
differential diagnosis, assessment of the prognosis, and for lung câncer screening [25].
The genetic alterations leading to changes at the DNA levei include point mutations, deletions, microsatellite instability and modifications of the prometer sites of the genes. Those changes in DNA lead to the cellular changes of RNA and protein leveis which may originate an antibody response [25].
A large number of genetic changes have been identified in lung câncer however only few are described in the following sub-sections.
1.4.1. The p53 tumour suppressor gene
The p53 gene has an important role in lung câncer and mutations in this gene are most common in the evolutionarily conserved exons 5-8. There are several types of p53 mutations, including missense and nonsense mutations, splicing abnormalities as well as larger deletions [26].
One copy of the chromosomal region 17p13 which houses p53 is normally deleted in both SCLC and NSCLC, and mutational inactivation of the remaining allele occurs in 75-100% of SCLC and approximately in 50% of NSCLC. Most of the gene somatic mutations in p53 gene are missense and prolong the half-life of the p53 protein to several hours, increasing the protein leveis which can be detected by immunohistochemistry. Immunohistochemical studies demonstrated that abnormal p53 expression in 40-70% of SCLC and 40-60% of NSCLC [26].
The majority of the p53 mutations in lung tumours are correlated with cigarette smoking. The most common p53 mutations in this organ are the G-T transversions which are expected from tobacco smoke carcinogens, such as benzo[a]pyrene. This carcinogen form adduets selectively along the p53 gene of bronchial epithelial cells, at the nucleotide positions [26].
1.4.2. The pRb tumour suppressor gene
RB mutations, together with loss of the wild-type allele, have been demonstrated in lung cancers. The RB protein is abnormal in more than 90% of SCLC and 15-30% of NSCLC. In lung cancers RB mutations include truncation by deletions, nonsense mutations, or splicing abnormalities and the majority of the
studies demonstrate that most of the mutations result in RB truncation. However, it is of great interest that a rare missense mutation in the RB 'pockef domain has been shown to cause detective RB phosphorylation and detective binding to oncoproteins [26].
The sensitivity for detecting RB abnormalities in SCLC varies methodologically: 20% by Southern blot analysis detecting band loss; approximately 60% by Northern blot analysis detecting absent or abnormal RNA; and approximately 90% by protein or immunohistochemical analysis. [26].
1.4.3. The pi6INK4 gene
The p16INK4 gene is situated on chromosome 9p21 and frequently undergoes
allele loss and mutation in a variety of human cancers including lung câncer. There were identified more than 120 point mutations and 50 other mutations including deletions, insertions, and splice mutations from a wide variety of cancers, indicating that there are several hot spots, some of which occur at conserved residues within the ankyrin domains of p16INK4 [26].
The p16INK4 protein is a cell cycle modulator which regulates the RB function
by inhibiting CDK4:cyclin D1 kinase activity and is the third genetic target for mutations in the p16-cyclin D1-CDK4-RB pathway in lung câncer [26],
Homozygous deletion or point mutations in p16INK4 have been observed in 10-
40% of NSCLC. Those abnormalities are more often in NSCLC than SCLC [26]. p16INK4 abnormalities are the most common mechanism for inactivating the
p16-cyclin D1-CDK4-RB cell cycle control pathway in NSCLC, whereas RB inactivation is the preferential mechanism in SCLC. Thereby, lung cancers are characterized by either RB or p16INK4 inactivation. Ten to thirty percent of NSCLC,
appearto be normal for both RB and p16INK4. again stressing the likely contribution from abnormalities of cyclin D1, CDK4 and other members of this growth suppressor pathway. The majohty, if not ali, lung cancers have acquired genetic or epigenetic abnormalities in this p16/cyclinD1/CDK4/RB pathway [26].
1.4.4. Microsatellítes
Microsatellite repeats are highly polymorphic, widely distributed throughout the genome and have been very useful markers for genetic mapping and analyzing small amounts of tumour samples for loss of heterozygosity [26].
Microsatellite instability, representing changes in the number of the short- tandem DNA repeats was initially reported in sporadic colorectal cancers and hereditary non-polyposis colon câncer where it reflects mutations of DNA mismatch repair genes, such as hMSH2, hMLH1, PMS1 and PMS2. Resulting in a distinctive Maddering' of short tandem repeat DNA sequences, such as dinucleotide repeats which are often called the replication error repair or RERá phenotype. Contrasting to the "laddering" of the RERá phenotype, a different and distinct "shift" of individual allelic bands which particularly affects tetra- or penta-nucleotide repeat markers, occurs in lung câncer. Thus, there appears to be only a single occurrence of unfaithful replication of an individual microsatellite marker which is then clonally preserved as the tumour develops [26].
Another difference from cancers such as colon and endometrial tumours, in which microsatellite instability usually affect multiple genetic loci concurrently, lung câncer frequently shows instability at only a few loci. These features together with the lack of reported mutations in the DNA mismatch repair genes in lung cancers have prompted suggestions that this is a distinct phenomenon and probably should be more accurately called "microsatellite alteration" (MA) or "genomic alteration" [26].
Overall, 35% of SCLC and 22% of NSCLC have shown some cases of MA at individual loci, but only 1-10% of ali the samples show MA. Timing of genetic changes found in preneoplastic lesions of the respiratory epithelium accompanying primary NSLC [26].
1.5 - Genome analysis techniques
Genomic instability has been assessed by a wide range of techniques, such as comparative genomic hybhdization (CGH), inter-simple sequence repeats polymerase chain reaction (inter-SSR PCR), chip-based CGH, flow cytometry,
arbitrarily primed polymerase chain reaction (PCR) and restriction landmark genome scanning, etc [27]. The first two techniques are mentioned below in more detail.
1.5.1. Comparative genomic hybridízation
CGH is a molecular cytogenetic technique that provides an overview of changes in DNA copy number across the whole genome, analysing lesions of pure populations (90-100%) of morphologically defined cells from formalin-fixed, paraffin- embedded histological samples. However it is restricted to detecting nonreciprocal or unbalanced structural changes where there is a physical change in copy number of a region of the genome. Thereby, other structural rearrangements in the genome such as altered ploidy and balanced translocations cannot be identified through this method [27].
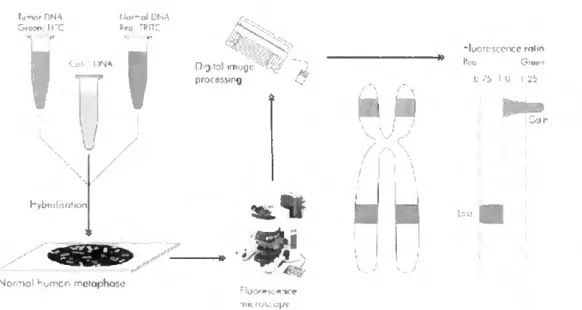
The methodology of CGH follows simple principies, but it is a labour-intensive and time-consuming method. The test (tumour sample) and reference (normal genomic sample) DNA are labelled with different fluorescent dyes, green and red respectively, and then mixed in a 1:1 ratio in the presence of human cot-1 DNA in orderto block repetitive sequences, and finally co-hybridized to a representation of a genome, traditionally metaphase chromosomes prepared from cultured normal lymphocytes [28].
Specialized image analysis software coupled with a fluorescence microscope is used in order to capture the images of chromosomes and convert hybridízation intensity data to a linear red-green ratio profile as illustrated in figure 1.3 [28].
Tuirxjr DNA Uor-nl DNA Sfooo; H'C Reo TRITC
v COM,3NA V
u
hybndijation
Nomal homcn n-,eiciphoçc
D j tnl imrgc procftssirg .01 nk fosc opv ■« j H -lyorescence "ilin Reo Giron L -'S I U I -Jb
Figure 1.3 - Diagram illustrating the principies of comparative genomic hybridization (CGH). CGH; Tumour and reference DNA are labelled with green and red fluorophores, respectively, and hybridized to normal lymphocyte metaphase spreads, Fifteen-20 metaphases are captured using a fluorescence microscope coupled with a digital camera. Green to red signal ratios are quantified digitally for each chromosomal region along the chromosomal axis [28].
Deviations from a 1:1 ratio are counted as an important alteration in DNA copy number when defined thresholds are crossed and statistical verification applied. The purity of the cell population, and the extent and size of the alterations are limitations of this technique and which affect its sensitivity [28],
New chromosomal regions affected by either deletions or increased DNA copy number in lung câncer were identified by using the CGH methodology which has been applied to DNAs from cell lines as well as primary or metastatic lung cancers and has detected increased copy number consistent with amplification of underlying dominant oncogenes [26],
1.5.2. Inter-simple sequence repeats polymerase chain reaction
Inter-SSR PCR is a fmgerphnting approach and has been proven to be a fast and reproducible methodology for quantification of deletions, insertions, and translocations in colorectal câncer. It has revealed a large number of changes and can be used to estimate the relative degree of genomic instability in tumours [21].
The methodology consists of the amplification of DNA segments between (CA)n dinucleotide repeats (microsatellites) using primers homologous to the repeats themselves but anchored at the 3' end by two nucleotides in order to prevent internai priming as illustrated in figure 1.4 [29],
Inter-SSR PCR
.CAíjRG
i tuD iji joiíj. j- -c -fx» yjjnjjjjfajggCTJrji "ll»0.HTÇTÇruilíT4T41<
Pt^R PíúC-jC.
Figure 1.4- Inter-simple sequence repeat (inter-SSR) PCR principie [21].
Closely adjacent repeat sequences arranged tail to tail are required for successful PCR amplification and since there are 50,000 to 100,000 (CA)n repeats in the human genome, such PCRs originates a high number of products which are resolved by polyacrylamide gel electrophoresis [29].
Specific alterations are detected as gains, losses, and intensity changes in electrophoretic bands and are likely to result from insertions, deletions, translocations, and amplifications, which are ali genomic lesions believed to initiate with DNA strand breakage as illustrated in figure 1.5 [29].
Band Altering Events Detected by Inter-SSR PCR
(il New Bands, Single Event vii) Band Loss Without New Bond Formation; Second Event Required ' i e LOH )
Normol Normal
Inlernol Deteiion Pnmer Si^e Loss
-vww-
Insertion
P Folol/ Parliol Ctiromosome Loss
Tronslocofion íiiil Increosed Band Intensity
n Amplification
These genomic alterations are not limited to insertions or deletions between or in the primer binding sites; larger scale processes such as deletions of portions of chromosomes or of entire chromosomes can also eliminate the corresponding bands [29].
This technique has four main advantages:
• Sequencing is not required to design the primers;
• Primers are anchored at the termini of the (CA)n repeats and extend into the flanking sequence by two nucleotide residues;
• Complex, species-specific patterns are obtained from a variety of eukaryotic taxa;
• Intraspecies polymorphism is observed, and it segregates as Mendelian markers [30].
David Broomhead (personal communication) Inter-SSR PCR to assess the occurrence and timing of DNA alterations in lung câncer progression via the in vitro model of carcinogenesis, studying the effect of a range of chemicals found within cigarettes by adding them to different lung cell lines [31].
Since this fingerprinting technique scans a vast range of the genome some of the Inter-SSR PCR products that were found by David Broomhead in his study code for proteins with a known or unknown function, or match non-coding regions of the genome. One of these products is the sequence of the peptidylprolyl isomerase A (cyclophilin A) (PPIA) pseudogene which showed an increase in intensity in the NCI- H596 cell line when compared to the other cell lines in study [31].
Cyclophilin A is an 18 KDa protein that belongs to the immunophilin family of proteins and with a wide variety of functions. Normally it is studied for thei binding of various immunosuppressive drugs, such as Cyclospohn A, and for its role in cellular signalling pathways. It also possesses peptidyl prolyl c/s-trans isomerase activity and thus may have a role in protein folding. Campa et al. (2003) suggest that it can be involved in an important aspect of oncogenesis because of its role in cellular growth and differentiation, transcriptional control, cell signalling and immunosuppression [32], [33].
According to Burfeind et al. (2004), cyclophilin A was found to be overexpressed in prostate carcinoma and in lung câncer, and highly expressed in human breast ductal carcinoma and in hepatocellular carcinoma [34].
1.5.3. Techniques Required to Identify Genome Changes
Inter-SSR PGR is a technique able to demonstrate that a genomic alteration has occurred, however it is still necessary to identify that alteration. This last step can be done by cloning and sequencing of the altered bands from the polyacrylamide gel [27], and finaliy by using the bioinformatics tools such as the BLAST search on the National Centre for Biotechnology Information (NCBI) website, to search for homology with other sequences in the human genome [31],
In order to accomplish the sequencing of the altered DNA bands, the corresponding bands are subjected to re-electrophoresis on a nondenaturing polyacrylamide gel. Then the DNA is extracted by boiling, and the products are re- amplified by PGR and cloned into a plasmid vector [27].
According to Broomhead, the recovered inter-SSR PGR sequence of 491 bp, shown in figure 1.6, was inserted into the BLAST search engine and the NCBI database was searched, supplying with precise identification of the abnormal band and as well with additional information about its chromosomal location and homology [31],
56461 atgcaatcac acacacacac acacacacac aatcacacac gggcaccttg caaattgctc 56521 tccccacccc tcttctggaa actacaattt taccctcata caagtccgca gtcccttatc 56581 taaaac|ctt ggggtcagat acatttcaga cttcagaatg tgtctgattt tagaagggga 56641 atttggtgca tataccatag atttcataat aacctctgta gggcctgagc agcactcagt 56701 aagcaaacgt gactatttct gcagtgaaat gtgtgaatat tcacagtaag tgggggaaaa 56761 taaaggccat aaatagcctc atgacatttc aagttgtgtt ttaccagact tatgagttaa 56821 tagaaaacac ggcctttgga gcttcttgga tttcaggatc gcaggtgagt gcctctcacg 56881 agtccctcag ccaggtgggc tgctcagccc tgatgtacac caacccacat atttgttcac 56941 ttgtaataaa tgtcaagagc catattcttg ccatgggagc agaagggacg gggctgtgtg 57001 tgtgcgtgcg tgtgcgtgtg cgtgtgcatg cgcacctaca tacacgtcca cataccagga Figure 1.6 - Part of the cyclophilin A pseudogene sequence where the genomic alteration was identified. Where is a thymine (t) in red should be a cytosine (c).
The sequence was found to have 98% of homology to a human DNA sequence from clone RP11-415K20 on chromosome 1 which is thought to contain a cyclophilin A pseudogene. There was a single base change between the test sequence and the altered base sequence. The normal sequence has a thymine (t) in that position but the mutated one has a cytosine (c), as illustrated in red in figure 1.6. There is no literature available mentioning this pseudogene and its possible relation with câncer or with other human biological systems [31],
1.6 - Pseudogenes
Originally, pseudogenes were defined by their possession of sequences that are related to those of the functional genes, but were thought not to be translated into a functional protein [35],
Some pseudogenes present the same general structure as functional genes, with sequences corresponding to exons and introns in the usual locations. They may have been turned inactive by mutations which prevent any or ali of the stages of expression. The changes can provoke the elimination of the signals for initiating transcription, can avoid splicing at the exon-intron junctions, or prematurely terminating translation [35].
Usually a pseudogene has several deleterious mutations. Once it was stopped being active active, there is no impediment to the accumulation of further mutations. Pseudogenes that represent inactive versions of currently active genes have been found in many systems, including globin, immunoglobulins, and histocompatibility antigens, where they are located in the vicinity of the gene cluster, often interspersed with the active genes [35],
Processed pseudogenes may arise from reverse-transcription of mRNA and re-integration into the genome. They are probably made as a by-product of LINE retrotransposition. In other words, the processed pseudogene is formed from reverse transchbing a spliced mRNA into a cDNA using the reverse transchptase from the LINE and re-integrating into the genome [36].
Duplicated pseudogenes tend to arise for organism-specific environmental response functions which may reflect genomic mechanisms that an organism uses to generate proteins that deal with alterations in its environment. Gerstein et al (2002) suggest that pseudogenes or pseudogenic parts for such classes of gene may occasionally be resurrected and used to enable larger random leaps in sequence space [36],
Non-functional as well functional transchpts of pseudogenes have been deschbed in many organisms. There are numerous human examples which include the interferon pseudogene, glucocerebrosidase pseudogene, dopamine D5 pseudogene, DNA topoisomerase 1 pseudogene, ect [37].
According to Broomhead (personal communication), the cyclophilin A pseudogene showed an increase in intensity in the NCI-H596 cell line when
compared, by Inter-SSR PCR, to the other cell lines in study [23]. This fact might suggest that this pseudogene expression is possible.
Pseudogenes might have a possible function in development as a source of intracellular inhibitors. Once there is a possibility of pseudogenes being the source of the antisense RNA by that hybridizes with the sense RNA from the determinator genes and blocking their expression. They may be transcribed from the opposite strand relative to their functional counterparts, making them a source of antisense RNA [36].
1.7 - Objectives
The main aim of this study was to investigate the presence and expression of the cyclophilin A (PPIA) pseudogene sequence which was thought to be altered in a particular lung câncer cell line (NCI-H596) and its expression in other cell lines.
1.7.1. Cell Culture
In an in vitro cell model, iike the one that was used during this study, it is necessary to recreate and control ali the physico-chemical parameters in order to give to the cells the same environment that they would have in the body. Such parameters include the pH, temperature, osmotic pressure, leveis of oxygen and carbon dioxide, and culture media supplements.
The culture media required for the propagation of animal cells are much more complex than the minimal media sufficient to support the growth of bactéria and yeasts. In addition to salts and glucose, the media used for animal cell cultures contain various amino acids and vitamins, which the cells cannot make for them selves. The growth media for most animal cells in culture also include serum, the major cost component, which serves as a source of polypeptide growth factors which are required to stimulate cell division [38],
By using those conditions and basic cell culture techniques the lung and prostate cell lines are grown in order to extract the DNA and total RNA which are then used to perform the polymerase chain reaction (PCR) and reverse transcriptase (RT) reactions in order to investigate whether or not the PPIA pseudogene is being expressed.
1.7.2. Reverse Transcriptase - Polymerase Chain Reactíon
Analysis of gene expression requires accurate determination of the mRNA leveis. However polymerase chain reaction (PCR) is based on amplification of DNA rather than RNA, so the solution is convert the mRNA into DNA using the reverse transcription process [39],
Reverse transcriptase - polymerase chain reaction (RT-PCR) is based on the capacity of the enzyme reverse transcriptase to generate a complementary strand of DNA (first-strand cDNA) using the mRNA as a template. This complementary strand is then amplified by PCR reaction by using forward and reverse primers which are specific to the target gene [39],
Finally the results are revealed by running the PCR products into an agarose gel.
By using this technique during this study should be possible to see whether or not the cyclophilin A pseudogene is being expressed or not. If it is being expressed, is then necessary find out if it is happening only in lung adenosquamous carcinoma cell line (NCI-H596) or also in the others cell lines.
Chapter 2 - Materials and Methods
2.1 - Celi growth in vitro
2.1.1. Celi lines and media requirements
The four cell lines cultured during the project are originated from human lung and prostate.
Lung adenosquamos carcinoma (NCI-H596) is the cell line in which the possible overexpression of the PPIA pseudogene is being investigated. This cell line is derived from a tumour mass in the chest wall of a 73-year-old male Caucasian patient with adenosquamous carcinoma (NSCLC) of the lung. It is a near triploid human cell line possessing a modal number of 71 chromosomes, expressing easily detectable leveis of p53 mRNA whilst not exhibiting gross structural DNA abnormalities [40],
The others cell lines being investigated are "normal" lung (HBE 135-E6E7), prostate adenocarcinoma (PC-3) and "normal" prostate (PNT-1A). The HBE135- E6E7 cell line was established from normal bronchus tissue taken at lobectomy for squamous cell carcinoma from a 54-year-old male. The cells from the primary explant in their first passage were infected and immortalized with the recombinant retrovirus LXSN16E6E7 containing the human papilloma virus (HPV) E6E7 gene. This cell line express high leveis of mRNA for epidermal growth factor receptor (EGFR), transforming growth factor-alpha (TGF-alpha), and amphiregulin (AR), however do not express epidermal growth factor (EGF) which has to be supplied with the growing media [41],
The PC-3 cell line was initiated from a bone metastasis of a grade IV prostatic adenocarcinoma from a 62-year-old male Caucasian. It is a near triploid cell line with a modal number of 62 chromosomes, exhibiting low acid phosphatase and testosterone-5-alpha reductase activities [42].
The PNT-1A cell line was established by immortalisation of normal adult prostatic epithelial cells by transfection with a plasmid containing SV40 genome with a detective replication ohgin. The primary culture was obtained from the prostate of a 35-year-old male at post mortem and the cells express cytokeratin 8 and 18, and vimentin [43],
The media requirements are different for different cell lines. The NCI-H596, PNT-1A cell lines grew in 500 ml RPMI-1640 media supplied with 10% (v/v) foetal calf serum (FCS), 1 ml penicillin/streptomycin solution, 1 ml amphotericin and 4 ml L-glutamine (media and supplements ali from Invitrogen, Paisley, UK).
The HBE135-E6E7 cell line grew in 500ml Keratinocyte-Serum Free (KSF) (Invitrogen, Paisley, UK) media supplied with 5 mg (ng/ml) human recombinant EGF (Invitrogen, Paisley, UK), 0.05 mg/ml bovine pituitary extract (BPE) (Invitrogen, Paisley, UK), 0.005 mg/ml insulin (Sigma, Steinheim, Germany) and 500 mg (ng/ml) hydrocortisone (Sigma, Steinheim, Germany).
The PC-3 cell line grew in 500 ml RPMI-1640 media supplied with 10% (v/v) foetal calf serum (FCS), 1 ml penicillin/streptomycin solution, 1 ml amphotericin and 2 ml L-glutamine (media and supplements ali from Invitrogen, Paisley, UK).
2.1.2. Cell culture techniques
2.1.2.a Thawing the cells
The vials were removed from bank to be thawed and silver foil was placed over the lid of the vials. One at a time was held in the water bath (Grant, Cambridge, UK) at 370C until the last crystal was thawed.
Each vial was then sprayed with 70% isopropanol (v/v) (Fisher Scientific, Loughborough, UK) and placed in the cell culture hood (Haraeus, Germany). Its contents were removed and placed in 15ml centrifuge tube (Fisher Scientific, Loughborough, UK). One drop of appropriate cell culture media was added using a plastic Pasteur pipette (Fisher Scientific, Loughborough, UK), then swirled, another added drop and swirled again. This was repeated until the total volume was 5 ml taking approximately 5 min. Over the next minute a further 5 ml of media were added with gentle swirling.
The tube was centrifuged (Jouan, Winchester, USA) at 1300 rpm (100g) for 5 min at 40C, then the supernatant was removed and the pellet was resuspended in
1ml of media. The suspension was placed into a T25 flask (Nunc, Rosklide, Denmark) and supplemented with a further 6ml of media. To ensure equal distribution of cells the flask was swirled gently and then placed in the incubator (Sanyo, Japan) at 370C. The flask was checked next day under the microscope and
When 75-80% of confluence was achieved, the cells were placed into a T75 flask (Nunc, Rosklide, Denmark) using the splitting procedure (See section 2.1.2.C).
2.1.2.b Feeding the cells
Once the cultures were established they were checked daily and the media replaced every 2 days. Normal cultures present a light pink, turning yellow colour. The media should always be clear. The appearance of turbidity means either the culture has become infected or the cells have detached.
The fresh media was warmed to 370C and the waste beaker was prepared as
explained in appendix A. The flasks were removed from the incubator (Sanyo, Japan) with only one cell line in the hood at a time. Then the media was removed and replaced from one flask at a time taking care to not touch the neck of flask.
2.1.2.C Splitting the cells
When the cells reached 75-80 % confluence in the flask, they were split. The simplest way to do this is to use trypsin/EDTA to detach the cells.
Trypsin/EDTA (10x) (Invitrogen, Paisley, UK) was thawed, sterile PBS and media were warmed to 37 0C and then placed into the hood. 1x trypsin/EDTA was
done by adding 9ml PBS (Invitrogen, Paisley, UK) to 1ml trypsin concentrate.
The media was removed from the flask and the residual media was rinsed away using sterile PBS. After this, 5 ml 1x trypsin solution was added and the flask was placed in the incubator for not longer than 5 min and then checked under the microscope to see if cells were detached.
Approximately 5ml of media was placed in a 15ml centrifuge tube (Fisher Scientific, Loughborough, UK) and the cell suspension was added to neutralise the trypsin activity. The tube was then centrifuged at 1300 rpm (100g) for 5 min at 40C,
and the pellet resuspended in 5 ml media for plating.
Finally 1ml cell suspension was added to a clean sterile T75 flask (Fisher Scientific, Loughborough, UK) followed by 9 ml media. The flask was gently swirled to ensure adequate dispersion of cells and then placed in the incubator (Sanyo, Japan).
2.1.2.d Celi countíng
The cell counting was accomplished in order to perform the growth curves of the different cell lines, and see if they had any inherent differences in growth charactehstics. The cells were trypsinised using the same procedure as to split cells (see section 2.1.2.c). Then the pellet was re-suspended in 2 ml PBS and 100pl were transferred to a O.õml tube. lOOpI trypan blue (Sigma, Steinheim, Germany) was added and these solutions were then mixed together giving a final volume of 200pl and left to stand for 1 minute. While the mixture was resting, the Neubauer haemocytometer (Assistant, Germany) was prepared as illustrated in figure 2.1.
Sample mtroduction poirct 4 Cover glass Counting chambers Cover glass mouirting support 0.1 mm sample depth u—U
Figure 2.1 - A cover slip is moistened with a solution containing a mixture of the re-suspended pellet in PBS and trypan blue, and then placed on the haemocytometer covering the 2 central channels [44].
Approximately 20pl of the mixture was dispensed underneath the cover slip at the sample introduction point until the whole counting chamber was filled by capillary action.
The cell count was then performed according to the following rules: the haemocytometer contains 2 identical grids, one on the upper counting chamber and one on the lower counting chamber as illustrated in figure 2.2. Bach counting grid consists of four corner squares containing 16 smaller squares and one central square containing 25 squares. When viewed under a microscope, if the cell number exceeded 200 when counting the central square alone, then only the 2 central squares on both grids were counted and an average was calculated. However if the cellular number does not exceeded 200, then ali 4 corner squares were counted on each counting grid plus the central square and an average was calculated.
Small squaae = 1/400 sq. mm. 1/25 sq mm
Comuing gnd (cerural aia»)
Figure 2.2 - Diagram of the grid on the haemocytometer each of the 9 squares is 1 mm and the depth between the coverslip and grid is 0.1 mm [44],
For cells that overlap a grid line, count a cell as "in" if it overlaps the top or right ruling, and "out" if it overlaps the bottom or left ruling. Once the cellular average was calculated the total number of cells in the 2ml suspension was also calculated:
Total number of cells = Average x 10000a x 2 (dilution factor) aConversion factor 1 mm to 1 ml 0.1 pl = 1 mm
Finally the number of cells per ml was calculated simply by dividing by 2.
2.1.2.e Scraping the cells
The media was removed from the flask and the residual media was rinsed away using sterile PBS (Invitrogen, Paisley, UK). Then 10 ml PBS were added and, using a scraper (Nunc, Rosklide, Denmark), the cells were detached from the flask surface.
The resulting suspension was transferred to a 15 ml centrifuge tube (Fisher Scientific, Loughborough, UK) which was placed into the centrifuge at 3000 rpm (230g) for 10 min at 4 0C. The supernatant was removed and 1 ml PBS was then
This new suspension was transferred to a 2 ml gamma irradiated tube (Fisher Scientific, Loughborough, UK) and centrifuged (ALC, Italy) at 11500 rpm for 15 min. The supernatant was removed and the cells were frozen with liquid nitrogen and finally the tubes were placed into the freezer (Revoo).
2.2 - Nucleic acids extraction
The nucleic acids, DNA and total RNA, were extracted from the pelleted cells using Qiagen extraction kits in order to test the viability of the primers and study the mRNA expression of the PRIA pseudogene, respectively. To extract DNA, the QIAamp® DNA mini kit (Qiagen, Crawley, UK) was used and to extract the total RNA the RNeasy® Mini Kit (Qiagen, Crawley, UK) was used. Those kits were used because they ensure a fast and easy extraction and a final product with high purity and good yields.
2.2.1. Extraction of DNA
The frozen cell pellet was re-suspended in 200|.il of PBS (Invitrogen, Paisley, UK) and transferred to a 1.5 ml microcentrifuge tube (Fisher Scientific, Loughborough, UK) and then 20pl QIAGEN Proteinase K (Qiagen, Crawley. UK) were added, followed by 200pl buffer AL (supplied in the kit). The mixture was mixed by pulse-vortexing (Flook & Tucker, Croydon, England) for 15 seconds and incubated at 560C for 10 minutes in a water bath (Grant, Cambridge, UK).
Then, the mixture was briefly centrifuged (Beckman, Germany) to remove drops from the inside of the lid and 200pl ethanol (96-100% v/v) (Fisher Scientific, Loughborough, UK) was added. The mixture was mixed again by pulse-vortexing (Hook & Tucker, Croydon, England) for 15 seconds and then briefly centrifuged to remove drops from the lid.
Carefully the mixture was applied into the QIAamp Spin Column (in a 2ml collection tube supplied in the kit) without wetting the rim. The cap was closed and the mixture was centrifuged at 8000 rpm (6000g) for 1 minute. Then the QIAamp Spin Column was placed in a clean 2ml collection tube and the tube containing the filtrate was discarded.
The QIAamp Spin Column was opened carefully and 500f.il buffer AW1 (supplied in the kit) was added without wetting the rim. The cap was closed and the mixture was centrifuged again at 8000 rpm (6000g) for 1 minute. Then the QIAamp Spin Column was placed in a clean 2ml collection tube (supplied in the kit) and the tube containing the filtrate was discarded.
Carefully the QIAamp Spin Column was opened and 500pl buffer AW2 (supplied in the kit) was added without wetting the rim. The cap was closed and the mixture was centrifuged at full speed (14000 rpm; 20,000 g) for 3 minutes.
The QIAamp Spin Column was placed in a clean 1.5ml microcentrifuge tube and the tube containing the filtrate was discarded. Carefully the QIAamp Spin Column was opened and 200pl buffer AE (supplied in the kit) was added. The mixture was incubated at room temperatura (15-250C) for 1 minute, and then
centrifuged at 8000 rpm (6000g) for 1 minute. The resulting filtrate contained the extracted DNA.
Finally, the DNA was quantified (See section 2.2.3.a).
2.2.2. Extraction of total RNA
The tube was flicked after the cells were thawed and, to disrupt the cells, 600 pl RLT buffer (supplied in the kit) (Qiagen, Crawley, UK) was added to the pellet. Then the vortex (Hook & Tucker, Croydon, England) was used to mix.
To homogenize the sample, the lysate was passed at least 5 times through a 20-gauge needle (0.9 mm diameter) fitted to an RNase-free syringe (BD Discardit™ll, Huesca, Spain).
600 pl 70% (v/v) ethanol (Fisher Scientific, Loughborough, UK) was added to the homogenized lysate, and the sample was mixed well by pipetting and applied (600 pl at a time) to an RNeasy® mini column placed in a 2 ml collection tube (supplied in the kit). The tube was gently closed and the mixture was centrifuged for 1 min at 10,000 rpm (8000g). The flowthrough was discarded and the collection tube reused.
700 pl of Buffer RW1 (350 pl at a time) was added to the RNeasy® column. The tube was gently closed, and the sample was centrifuged forl min at 10000 rpm (8000g) to wash the column. The flow-through and collection tube were discarded.
The RNeasy® column was transferred into a new 2 ml collection tube and 500 |jl of buffer RPE (supplied in the kit) was added onto the RNeasy® column. The tube was gently closed and the sample was centhfuged for 1 min at 10000 rpm (8000g) to wash the column. The flow-through was discarded and the collection tube reused.
Another 500 pi Buffer RPE (supplied in the kit) was added to the RNeasy column. The tube was closed gently, and the sample was centhfuged for 2 min at 10000 rpm (8000g) to dry the RNeasy® silica-gel membrane.
To elute the RNA, the RNeasy® column was transferred to a new 1.5 ml collection tube and then 50pl RNase-free water was added directly onto the RNeasy® silica-gel membrane. The tube was gently closed, and the sample was centhfuged for 1 min at 10000 rpm (8000g) to elute.
Finally, the total RNA was quantified (See section 2.2.3.b).
2.2.3. Nucleic acids quantification
2.2.3.a DNA quantification
The quantity and purity of the DNA were determined by diluting the DNA sample 1 in 25 in distilled water in a quartz cuvette (Sigma, Steinheim, Germany) and measuring the absorbance at 260 and 280nm against distilled water.
The quantity of DNA was determined through the following formula:
Qdna - A260 x DF x 50
Where:
Qdna - Quantity of DNA (ng/pl),
A260 - Absorbance of the sample at 260 nm, DF - Dilution Factor which is 25,
50 - Quantity (ng/pl) of double stranded DNA corresponding to 1 unit of absorbance at 260nm.
The purity of DNA was determined through the foilowing ratio:
Purity = A260 / A280
A value between 1.7-1.9 was considered to be puré.
2.2.3.b Total RNA quantification
The quantity and purity of the total RNA were determined by diluting the DNA sample 1 in 100 in distilled water in a quartz cuvette and measuring the absorbance at 260 and 280nm against distilled water.
The quantity of total RNA was determined through the foilowing formula:
Qtotal RNA - A26O X DF X 40
Where:
Qtotai rna - Quantity of RNA (ng/pl),
A260 - Absorbance of the sample at 260 nm, DF - Dilution Factor which is 100,
40 - Quantity (ng/pl) of RNA corresponding to 1 unit of absorbance at 260nm.
The purity of RNA was determined through the foilowing ratio:
Purity = A260 / A280
![Figure 1.1 -The cell division cycle and its control [19].](https://thumb-eu.123doks.com/thumbv2/123dok_br/18731848.919802/17.892.276.713.461.769/figure-cell-division-cycle-control.webp)
![Figure 1.2 - The sequential steps during tumour angiogenesis [16].](https://thumb-eu.123doks.com/thumbv2/123dok_br/18731848.919802/22.892.108.795.318.609/figure-sequential-steps-tumour-angiogenesis.webp)
![Figure 1.5- Band altering events detected by Inter-SSR PCR [29].](https://thumb-eu.123doks.com/thumbv2/123dok_br/18731848.919802/28.892.155.758.768.1115/figure-band-altering-events-detected-inter-ssr-pcr.webp)
![Figure 2.1 - A cover slip is moistened with a solution containing a mixture of the re-suspended pellet in PBS and trypan blue, and then placed on the haemocytometer covering the 2 central channels [44]](https://thumb-eu.123doks.com/thumbv2/123dok_br/18731848.919802/37.892.196.697.448.583/figure-moistened-solution-containing-suspended-haemocytometer-covering-channels.webp)
![Figure 2.2 - Diagram of the grid on the haemocytometer each of the 9 squares is 1 mm and the depth between the coverslip and grid is 0.1 mm [44],](https://thumb-eu.123doks.com/thumbv2/123dok_br/18731848.919802/38.892.274.607.114.430/figure-diagram-grid-haemocytometer-squares-depth-coverslip-grid.webp)