peach nectars with higher and lower
sugar contents
Aplicações de FTIR-ATR para discriminar néctares de pêssego
com elevada e baixa quantidade de açúcares
Maria Teresa Coelho1,2,3, Fátima Alexandra Valério1, Soraia Inês Pedro1, Ofélia Maria Serralha dos Anjos1,2,4*
1Instituto Politécnico de Castelo Branco, Quinta da Senhora de Mércules/Castelo Branco - Portugal
2Centro de Biotecnologia de Plantas da Beira Interior (CBPBI), Quinta da Senhora de Mércules/Castelo Branco - Portugal
3Instituto Politécnico de Castelo Branco, Centro de Estudos de Recursos Naturais, Ambiente e Sociedade (CERNAS), Castelo Branco - Portugal
4Universidade de Lisboa, Instituto Superior de Agronomia, Centro de Estudos Florestais (CEF), Lisboa - Portugal.
*Corresponding Author: Ofélia Maria Serralha dos Anjos, Instituto Politécnico de Castelo Branco, Quinta da
Senhora de Mércules, 6001-909, Castelo Branco - Portugal, e-mail: ofelia@ipcb.pt
Cite as: Coelho, M. T., Valério, F. A., Pedro, S. I., & Anjos, O. M. S. (2020). Application of FTIR-ATR to discriminate
peach nectars with higher and lower sugar contents. Brazilian Journal of Food Technology, 23, e2018194. https://doi.org/10.1590/1981-6723.19418
Abstract
Fruit juice does not have the same nutritional value as fresh fruit with regards to the vitamin, mineral and dietary fibre contents and the antioxidant properties. However, it can be part of a healthy diet if it is produced with the minimal addition of sugar. This study aimed to evaluate the performance of the FTIR-ATR technique to discriminate the authenticity (concerning the addition of other pulps) and amount of sugar in peach nectars. This technique is usually used in food analysis because it does not require sample preparation, is quick and allows for the determination of several parameters with a single sample aliquot. The nutritional information provided on the labels of 69 samples of 23 different brands of commercial peach juice, was analysed. The differences in the nutritional composition and in the ingredients were determined according to an analysis of the labels. The largest differences observed between the samples were the sugar contents, the percentages of pulp and the addition of other pulps. All samples were analysed by FTIR-ATR equipped with a controlled temperature flow-through cell. The spectral multivariate analysis suggested it was possible to identify differences in the amount of sugar present and identify the presence of fruit pulps other than peach.
Keywords: Prunus persica; MIR spectroscopy; Fructose; Glucose; Sucrose; Fruit juice.
Resumo
O sumo de fruta não tem o mesmo valor nutricional que as frutas frescas no que se refere ao conteúdo de vitaminas, minerais, fibra dietética e propriedades antioxidantes; no entanto, pode ser parte de uma dieta saudável se a sua concentração de açúcar não for muito elevada. Este estudo teve como objetivo avaliar o desempenho da técnica de FTIR-ATR para discriminar a autenticidade (no que se refere à adição de outras polpas) e a quantidade de açúcar
adicionado. Esta técnica é normalmente usada na análise de alimentos, porque não requer preparação de amostras, é rápida e permite a determinação de vários parâmetros com uma única alíquota de amostra. Foi analisada a informação nutricional fornecida pelos rótulos de 69 amostras, de 23 marcas diferentes, de sucos comerciais de pêssego. As diferenças na composição nutricional e nos ingredientes foram feitas por análise dos rótulos. As maiores diferenças observadas nas amostras foram o teor de açúcar, a percentagem de polpa e a presença de outras polpas adicionadas. Todas as amostras foram analisadas por FTIR-ATR equipado com uma célula de fluxo contínuo com temperatura controlada. A análise multivariada espectral sugere que é possível identificar as diferenças na quantidade de açúcar e identificar a presença de polpas de outros frutos além do pêssego.
Palavras-chave: Prunus persica; Espectroscopia MIR; Frutose; Glicose; Sacarose; Sumo de fruta.
1 Introduction
The growth in consumption of fruit-based beverages is a reality driven by an increasing concern with consumer health, motivating a search for drinks with nutritional characteristics (Miaw et al., 2018). On the other hand, according to Batra et al. (2018), globalization has increased the production and use of fruit juices, but it is very important to check the quality of packaged juice before consumption. The consumption of fruit juices processed under hygienic conditions could play an important role in consumer health.
In Portugal, peach juice is the most popular juice and the peach orchards are mainly found in the Central region and in the interior of Beira, the area where the authors live, which is the main peach producing region in Portugal (Instituto Nacional de Estatística, 2015).
Packaged juice nectars consist of fruit juice, water, carbohydrates (sucrose, fructose, glucose and sorbitol), a small amount of protein, minerals, vitamin A and C, and may contain a small amount of fibre coming from the fruit. However, the vitamin concentrations depend on the temperature at which the packaged juice is stored, and higher levels of vitamin C, as well as many other fruit juice constituents could be maintained if the fruit juice was processed at low temperatures (Batra et al., 2018).
Sucrose is the predominant soluble sugar present, with levels between 54% and 75% of the total soluble carbohydrates. Glucose and fructose have similar levels, with concentrations ranging between 4% and 11% and between 9% and 21%, respectively. Sorbitol is present in very low proportions (Meredith et al., 1989; Bassi & Selli, 1990).
Fruits are very important in our diet, given their vitamin, mineral and dietary fibre concentrations and their antioxidant properties. Fruit juice does not have the same nutritional value as the fresh fruit, but it can also be a health part of the diet. However, juices must be consumed in small portions because they are still a concentrated source of calories and sugars, given the natural content of fructose as well as the sugars added to boost the sweetness. Basu et al. (2013) reported that the consumption of sugar sweetened beverages contributed to an increase in obesity and to the development of type 2 diabetes.
The evaluation of the quality and authenticity of fruit juice is an important area of applied research, with relevant impacts on food science and on the consumer protection industry (Leopold et al., 2011).
According to the Council Directive 2001/112/EC (European Union, 2001), beverages that contain juice (fruit or vegetable) must declare the percentage of juice or pulp on the label. According to the Associação Portuguesa de Nutrição (2017) the minimum juice or pulp content varies according to the nectar and may range from 25% to 50% (v/v). This includes non-carbonated and carbonated beverages, full-strength (100%) juices, concentrated juices and diluted juices. In fruit nectars, the added sugar must not exceed 20% of the total mass.
nutritional information: Energy (kJ/kcal); Fat (g), including the proportion of saturated fat (g); carbohydrate (g), from which sugars (g); protein (g) and salt (g).
Fourier transform infrared spectroscopy (FTIR spectroscopy) with attenuated total reflectance (ATR) techniques, is very useful in the quality control (Nagarajan et al., 2006; Anjos et al., 2015, 2017) and characterization (Anjos et al., 2016) of food and beverages, fruit analyses (Alkhalf & Mirghani, 2017) and others. The increase in the use of this technique is related to its flexibility, efficiency, low cost, small volume of sample needed with minimal or no processing, the high data reproducibility and speed of analysis (Bauer et al., 2008).
Spectroscopic methods such as FTIR-ATR are non-invasive methodologies used to directly analyses several matrixes and produce distinct spectral signatures resulting from various functional groups present in the sample.
These methodologies are able to quantify different food properties such as the contents of moisture, protein (Glassford et al., 2013), carbohydrates, ash, sugars (Anjos et al., 2015), lipids, tannins (Falcão & Araújo, 2014; Anjos et al., 2017), caffeine (Singh et al., 1998) and others.
The development of fast, economical methods for the determination of carbohydrates in fruit juices is very important for the industries to be able to make fast quality evaluations for labelling purposes as well as identifying possible adulterations.
In the case of commercial fruit juices, some additives can significantly affect the pH and total carbohydrate content, reducing the ability to obtain information about their quality (e.g. maturation stage of the fruits of origin). Often, pH regulators (e.g. citric acid), sucrose and other sweeteners are added to juices, and hence the pH and total carbohydrate content are no longer a reflection of the ripeness stage of the source fruit. FTIR spectroscopy has been increasingly used to study liquid foods such as juices and soft drinks. It can potentially give information about the proportions of the three main carbohydrates (glucose, fructose and sucrose) and their variation during ripening (Leopold et al., 2011).
This study aimed to assess the potential of FTIR-ATR spectroscopy for a fast discrimination of the sugar content in peach juice as well as the presence of nectars other than peach.
2 Material and methods
2.1 Samples
In this study, 69 packaged samples from 23 different brands of pasteurized commercial peach juice (within the sell by date) were acquired from several supermarkets in the city of Castelo Branco (central region of Portugal) in February, with the purpose of studying their composition and nutritional value. Initially only the labels were analysed in order to correlate with the spectral information acquired using FTIR-ATR.
2.2 Ingredients and nutritional information
For each sample, the ingredients and nutritional information present on the label were studied.
The lists of ingredients correspond to the percentages of each component in the peach juice and juice of other fruits eventually present, sugar or sweetener content and the presence or absence of acidifying agents, antioxidants, emulsifiers, stabilisers, thickeners and gelling agents.
According to the nutritional information, energy (kcal); total lipids (g); sugars (g) within the carbohydrates (g); protein (g); salt (g); vitamin C (mg) and fibre (g) per 100 mL, were evaluated.
2.3 FTIR-ATR spectroscopy and chemometric analysis
The spectra were acquired using a Bruker spectrometer (Alpha) equipped with an attenuated total reflection accessory (FTIR-ATR). Triplicate spectra were obtained per sample with 128 scans per spectrum, using a spectral resolution of 8 cm-1 in the wavelength range from 4000 to 450 cm-1.
The FTIR-ATR used was equipped with a flow-through, controlled temperature cell. The cell was cleaned by injecting milli Q water into the flow-through cell and also into the background.
The principal component analyses (PCA) of the spectral information were carried out using the Unscrambler® X, version: 10.5.46461.632 (CAMO Software AS, Oslo, Norway) and the OPUS®,
version: 7.5.18 (Bruker Optik, Germany).
For the PCA analyses, several mathematical pre-treatments (centred on the mean) were tested in different wavelength ranges, namely: no spectral data pre-processing; constant offset elimination (CO); multiplicative scatter correction (MSC), first derivative (1stDer), second derivative (2ndDer), vector normalization (SNV), straight line subtraction (SLS), minimum maximum normalization (MinMax), constant offset (ConOff), and combinations of these.
3 Results and discussion
3.1 Analysis of the ingredients and declared nutritional information
Table 1 summarizes the nutritional values of the different commercial peach nectars (regular, with reduced sugar and peach juice with added grape juice). The mean values for energy ranged from 46.1 kcal for regular peach juice to 24.9 kcal for reduced sugar peach juice. In the reduced sugar juices the value for energy decreased because of the small amount of sugar added. The peach juices with added grape juice had higher energy values (51.3 Kcal) due to the larger amounts of carbohydrates and proteins present in grape nectar as compared to peach nectar. According to Pastor et al. (1996), grape concentrate could be used as a sweetener of peach juice.
Only reduced sugar peach juices could be considered as low energy, since these products contained 40 or less Kcal. These juices, rich in polyphenols, with less added sugar also had the advantage of preventing the metabolic disorders induced by obesity (Noratto et al., 2015).
The sugars ranged between 5.9 and 12.0 g, 4.0 and 7.0 g and between 10.3 and 11.8 g, respectively, in the carbohydrate concentrations of the reduced sugar peach juice, regular peach juice and peach juice with added grape juice. However, one can see that some samples classified as regular peach juice had less sugar than one sample classified as reduced sugar peach juice. The peach juice with added grape juice always presented a higher carbohydrate concentration due to the chemical composition of the grape juice, as reported above.
None of the juices could be considered as of low sugar content, since all were greater than 2.5 g per 100 mL (Associação Portuguesa dos Nutricionistas, 2017).
The lipid concentrations in the juices analysed were very low and the saturated lipid concentrations were zero. The lipid contents of fruit juices are lower than in the fresh fruit. According to Aganovic et al. (2014) this difference is related to structural changes induced by the thermal processing applied during fruit juice processing, where non-catalysed reactions can occur between fats and the free water present, resulting in the hydrolysis of fatty acids (Salimon et al., 2011; Wanyo et al., 2014).
The protein contents were also very low, ranging between 0.0 g and 0.6 g. Higher values were observed in the peach juices with less added sugar and in the those with added grape juice, due to the larger amount of protein usually observed in grapes. Deboni et al. (2014) observed that the pasteurization process affected the
Vitamin C, also known as ascorbic acid, is a vitamin found in several food products, namely fruits, and is used as a dietary supplement due to its physiological antioxidant capacity with a very strong reducing power. The importance of vitamin C is usually related to its contribution to repairing and regenerating tissues, protecting against heart disease and decreasing the total and LDL cholesterol fractions and the triglycerides. The ascorbic acid content of commercial fruit juices ranges from 2.4 to 43 mg 100 mL-1 of juice
(Kabasakalis et al., 2000), meaning that the values cited on the packages analysed were, on average, within the range mentioned by that author. A vitamin C content was only cited on the packages of the regular peach juices, with average values of 8 mg 100 mL-1. However, this parameter is not required by the legislation, and
hence one cannot be sure that the other juices did not contain vitamin C.
Table 1. Nutritional values of the different commercial peach juices analysed (mean and standard deviation x±σ),
minimum (Min) and maximum (Max).
Parameters per
100 mL Regular peach juice Reduced sugar peach juice added grape juice Peach juice with Energy (kcal) Min-Max x± σ 46.1 ± 6.6 29.0-53.0 24.9 ± 14.6 8.0-52.0 51.3 ± 4.0 47.0-55.0
Lipids (g) Min-Max x± σ 0.1 ± 0.1 0.0-0.2 0.0 ± 0.1 0.0-0.1 0.1 ± 0.1 0.0-0.2 Carbohydrate (g) Min-Max x± σ 10.9 ± 1.6 6.5-12.3 5.4 ± 4.1 0.6-13.0 11.0-12.8 11.8-0.9 Sugars in the carbohydrate
content (g) Min-Max x± σ 10.2 ± 1.9 5.9-12.0 4.7 ± 1.3 4.0-7.0 11.0 ± 0.8 10.3-11.8 Protein (g) Min-Max x± σ 0.3 ± 0.2 0.0-0.5 0.5 ± 0.1 0.3-0.5 0.5 ± 0.1 0.4-0.6 Salt (g) Min-Max x± σ 0.0 ± 0.0 0.0-0.0 0.1 ± 0.1 0.0-0.3 0.01-0.01 0.0 ± 0.0 Vitamin C (mg) Min-Max x± σ 8.0 ± 3.5 6.0-12.0 0.0 ± 0.0 0.0-0.0 0.0 ± 0.0 0.0-0.0 Fibre (g) Min-Max x± σ 0.6 ± 0.6 0.1-1.5 0.7 ± 0.3 0.2-0.8 0.1 ± 0.0 0.1-0.1
According to Kabasakalis et al. (2000), commercial orange juice with 50% of real fruit juice contains, on average, 22.7 mg of vitamin C 100 mL-1. Thus, in comparison with commercial orange juice, the vitamin C
content of peach juice was lower. Since the peach is a carbohydrate-rich fruit, the values for salt and fibre were considerably reduced. On average, the salt content was 0.01 mg 100 mL-1 and the fibre content 0.6-0.7 g.
Figure 1 shows the frequency of the percentages of real fruit juice in the samples of commercial peach juice, where 70% of the samples in the study contained at least 50% of concentrated fruit juice.
Citric acid is widely used as an acidifying agent and 61% of the peach juice samples contained this agent (Figure 1), whereas only 4% contained lemon juice. With respect to the addition of sweeteners, 6 of the 69 samples contained added sucralose and acessulfame-k. One of these 6 samples was a regular peach juice and the other 5 were reduced sugar peach juices.
Figure 1. Percentages of real fruit juice (A) and the types and percentages of acidifying agents in the juices (B) (ND – not defined on the label).
3.2 FTIR-ATR results
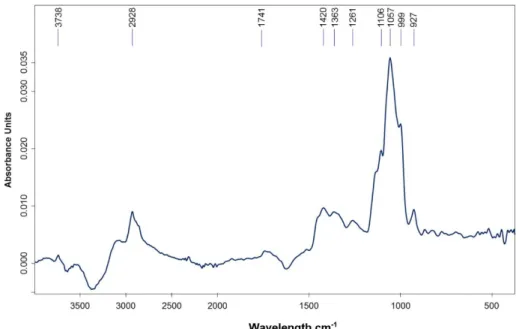
Figure 2 shows a typical FTIR-ATR spectra of a peach juice sample. The spectra are similar to those observed by Vardin et al. (2008) for concentrated pomegranate juice. The spectral analyses of all the nectars presented characteristic peaks at wavelengths ranging from 1500 to 950 cm−1, bands which are characteristic
of sugars (such as glucose and fructose) and organic acids (such as citric and malic acids) (Shah et al., 2010; Anjos et al., 2015; Shen et al., 2016).
The wavelengths ranged from 1700 to 1500 cm-1 due to C=O stretching vibrations of the pectin and the
acids, but these absorption bands were usually overlapped by the water absorption band (Defernez & Wilson, 1995). In this case and because the background was formed by water at a controlled temperature, a small peak can be seen at 1741 cm-1. Several low intensity peaks could be seen in the region from 1500 to 1200 cm-1 which
were assigned to CH2, C-C-H and H-C-O deformations (Hineno, 1977). According to He et al. (2007), these
multiple bands can also be assigned to C-O stretching absorption and to the C-O-H bending of phenols, carboxylic acids and carbohydrates.
The intense bands seen from 1200 to 900 cm−1 were assigned to the stretching vibrations of C-O and C-C
bonds also present in sugars and organic acids (He et al., 2007; Vardin et al., 2008; Shah et al., 2010). Saha et al. (2007) attributed the small peak seen at 3738 cm−1 to the amide N–H stretching frequency.
PCA class models were developed for all the peach nectar samples (peach nectar, peach nectar with added grape juice and low sugar peach nectar). Several tests were carried out with full spectral information and different mathematical pre-treatments, but the region between 1500 and 850 cm-1 was used for classification,
given its relevant information. Of all the pre-process tests, the best results were obtained using the 1stDer and 2ndDer. However, with the 2ndDer the use of 21 smoothing points increased the separation of the samples, and the differentiation between the samples was shown in the PCA score plot (Figure 3).
The samples marked as a low sugar peach nectar, plotted close to the peach nectar sample, was in fact a sample labelled as “no added sugar” but with a higher nectar concentration (71% of peach nectar) and low water content. This sample had 7 g 100 mL-1 of sugar whereas on average the low sugar nectars had
4 g 100 mL-1.
Fresh fruit contains natural sugar, namely fructose, which can increase the final sugar content of a juice if the percentage of fruit pulp is high. The peach nectar with added grape nectar was also well discriminated on the PCA produced using the spectral information.
Figure 3. PCA plot using the 1500-850 cm-1 FTIR-ATR spectral region scores and the 2ndDer pre-process and
respective loading graphics.
These results suggest that with the proper calibration model one can contribute to the nutritional evaluation of the peach juice, which is a very important tool for the quality control of this product as well as to identify any possible adulteration if all the information is not clear on the label.
As for the plot loadings graph represented in Figure 3, PC-1 discriminated the low sugar peach nectar from the other two types (peach nectar and peach nectar with added grape nectar) with 92% of confidence (PC1). The more representative region was the region between 1150 cm-1 and 850 cm-1, which is characterized
mostly by the sugar content in the samples. These intense bands were a result of the stretching vibrations of the C-O and C-C bonds present in the sugars and organic acids, as reported previously. Anjos et al. (2015) found this region to be more representative to characterize honey samples composed mainly of sugar.
The PC-2 loadings explained 7% of the total variance. The region between 1400 cm-1 and 1150 cm-1, that
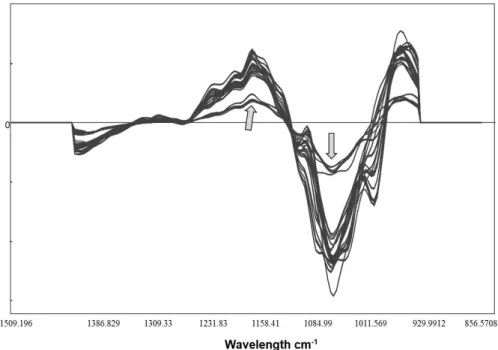
was assigned to CH2, C-C-H and H-C-O deformations, also provided relevant information as shown in Figure 3 (PC-2 loadings plot). For these two nectars (peach nectar and peach nectar with added grape nectar) the different chemical compositions of peach and grape played an important role in distinguishing them. With respect to the chemical composition of grape, the nectar with the addition of this fruit presented higher sugar and protein contents, which corroborated the importance of both regions in explaining the differences found. In Figure 4, the spectra processed with the 2ndDer in the 1500-850 cm-1 FTIR-ATR spectral region were
plotted, supporting the results shown in Figure 3. In this figure the different spectra for the low sugar peach nectar are also clear and are marked with arrows. Similar results were found by Miaw et al. (2018) who used FTIR-ATR spectroscopy combined with chemometric techniques to develop methods to quantify the main fruits in grape, peach, orange and passion fruit nectars as well as any possible adulteration or inclusion of ingredients not cited on the label such as syrup, apple juice and cashew juice.
Figure 4. 2ndDer pre-process spectra of all peach nectar samples acquired from 1500 to 850 cm-1.
4 Conclusion
The data presented in this study showed that the FTIR-ATR method was suitable to discriminate differences in the carbohydrate contents of the different peach pulp samples as well as showing if another pulp, different from the peach pulp, had been added to the nectars.
Furthermore, the technique has the advantage of requiring a reduced sampling path length, besides being simple, fast and more cost-effective for the correct characterization and labelling of the product. Therefore,
Acknowledgements
CEF is a research unit funded by the Fundação para a Ciência e a Tecnologia I.P. (FCT), Portugal (UID/AGR/00239/2019). CERNAS is a research unit funded by the Fundação para a Ciência e a Tecnologia
I.P. (FCT), Portugal (UID/AMB/00681/2019). The authors would like to express their gratitude to Isabele
Lavado (IPCB Language Centre) for revising the English language.
References
Aganovic, K., Grauwet, T., Kebede, B. T., Toepfl, S., Heinz, V., Hendrickx, M., & Van Loey, A. (2014). Impact of different large scale pasteurisation technologies and refrigerated storage on the headspace fingerprint of tomato juice. Innovative Food
Science & Emerging Technologies, 26, 431-444. http://dx.doi.org/10.1016/j.ifset.2014.10.007
Alkhalf, M. I., & Mirghani, M. E. S. (2017). Detection of formaldehyde in cheese using FTIR spectroscopy. International Food
Research Journal, 24(Suppl), S496-S500.
Anjos, O., Campos, M. G., Ruiz, P. C., & Antunes, P. (2015). Application of FTIR-ATR spectroscopy to the quantification of sugar in honey. Food Chemistry, 169, 218-223. PMid:25236219. http://dx.doi.org/10.1016/j.foodchem.2014.07.138 Anjos, O., Santos, A. J. A., Dias, T., & Estevinho, L. M. (2017). Application of FTIR-ATR spectroscopy on the bee pollen characterization. Journal of Apicultural Research, 56(3), 210-218. http://dx.doi.org/10.1080/00218839.2017.1289657 Anjos, O., Santos, A. J. A., Estevinho, L. M., & Caldeira, I. (2016). FTIR-ATR spectroscopy applied to quality control of grape-derived spirits. Food Chemistry, 205, 28-35. PMid:27006210. http://dx.doi.org/10.1016/j.foodchem.2016.02.128
Associação Portuguesa de Nutrição – APN. (2017). Sumos de fruta 100%: uma abordagem técnica e nutricional (E-book nº 45). Porto: APN.
Associação Portuguesa dos Nutricionistas – APN. (2017). Alegações nutricionais e de saúde. In Associação Portuguesa dos Nutricionistas – APN. Rotulagem alimentar: Um guia para uma escolha consciente (pp. 47). Porto: APN. Retrieved in 2018, February 10, from http://www.apn.org.pt/documentos/ebooks/Ebook_Rotulagem.pdf
Bassi, D., & Selli, R. (1990). Evaluation of fruit quality in peach and apricot. Advances in Horticultural Science, 4, 107-112. Basu, S., Mckee, M., Galea, G., & Stuckler, D. (2013). Relationship of soft drink consumption to global overweight, obesity, and diabetes: a cross national analysis of 75 countries. American Journal of Public Health, 103(11), 2071-2077. PMid:23488503. http://dx.doi.org/10.2105/AJPH.2012.300974
Batra, G., Sharma, A., & Agarwal, N. (2018). Evaluation of microbiological criteria and quality of packed fruit juices. International
Food Research Journal, 25(2), 458-461.
Bauer, R., Nieuwoudt, H., Bauer, F. F., Kossman, J., Koch, K. R., & Esbensen, H. K. (2008). FTIR spectroscopy for grape and wine analysis. Analytical Chemistry, 80(5), 1371-1379. PMid:18396479. http://dx.doi.org/10.1021/ac086051c
Deboni, T. M., Bündchen, M., Volpi Junior, C., Hotza, D., Piletti, R., & Quadri, M. G. N. (2014). Effect of the processing steps on cactus juice production. Food and Bioprocess Technology, 7(4), 990-1000. http://dx.doi.org/10.1007/s11947-013-1098-4 Defernez, M., & Wilson, R. H. (1995). Mid-infrared spectroscopy and chemometrics for determining the type of fruit used in jam.
Journal of the Science of Food and Agriculture, 67(4), 461-467. http://dx.doi.org/10.1002/jsfa.2740670407
European Union. The Council of the European Union. (2001). Council Directive 2001/112/EC of 20 December 2001 relating to fruit juices and certain similar products intended for human consumption. Official Journal of the European Unions. Retrieved in 2018, February 10, from https://eurlex.europa.eu/legalcontent/EN/TXT/PDF/?uri=CELEX:32001L0112&from=PT
European Union. The Council of the European Union. (2011, 25 October). L304/18. Regulation (EU) No 1169/2011 of the European Parliament and of the Council. Official Journal of the European Union.
Falcão, L., & Araújo, M. E. M. (2014). Application of ATR–FTIR spectroscopy to the analysis of tannins in historic leathers: the case study of the upholstery from the 19th century Portuguese Royal Train. Vibrational Spectroscopy, 74, 98-103.
http://dx.doi.org/10.1016/j.vibspec.2014.08.001
Glassford, S. E., Byrne, B., & Kazarian, S. G. (2013). Recent applications of ATR FTIR spectroscopy and imaging to proteins.
Biochimica et Biophysica Acta (BBA) - Proteins and Proteomics, 1834(12), 2849-2858. PMid:23928299.
http://dx.doi.org/10.1016/j.bbapap.2013.07.015
He, J., Rodriguez-Saona, L. E., & Giusti, M. M. (2007). Mid infrared spectroscopy for juice authentication-rapid differentiation of commercial juices. Journal of Agricultural and Food Chemistry, 55(11), 4443-4452. PMid:17488020.
http://dx.doi.org/10.1021/jf062715c
Hineno, M. (1977). Infrared spectra and normal vibration of β-D-glucopyranose. Carbohydrate Research, 56(2), 219-227. http://dx.doi.org/10.1016/S0008-6215(00)83344-3
Instituto Nacional de Estatística – INE. (2015). Estatística agricola. Retrieved in 2018, February 10, from https://www.ine.pt/ngt_server/attachfileu.jsp?look_parentBoui=232758675
Kabasakalis, V., Siopidou, D., & Moshato, E. (2000). Ascorbic acid content of commercial fruit juices and its rate of loss upon storage. Food Chemistry, 70(3), 325-328. http://dx.doi.org/10.1016/S0308-8146(00)00093-5
Meredith, F. I., Robertson, J. A., & Horvat, R. J. (1989). Changes in physical and chemical parameters associated with quality and postharvest ripening of ‘Harvester’ peaches. Journal of Agricultural and Food Chemistry, 37(5), 1210-1214.
http://dx.doi.org/10.1021/jf00089a002
Miaw, C. S. W., Assis, C., Silva, A. R. C. S., Cunha, M. L., Sena, M. M., & Souza, S. V. C. (2018). Determination of main fruits in adulterated nectars by ATR-FTIR spectroscopy combined with multivariate calibration and variable selection methods. Food
Chemistry, 254, 272-280. PMid:29548454. http://dx.doi.org/10.1016/j.foodchem.2018.02.015
Nagarajan, R., Gupta, A., Mehrotra, R., & Bajaj, M. M. (2006). Quantitative analysis of alcohol, sugar, and tartaric acid in alcoholic beverages using attenuated total reflectance spectroscopy. Journal of Automated Methods and Management in
Chemistry, 155, 45102, 1-5.
Noratto, G., Martino, H., Simbo, S., Byrne, D., & Mertens-Talcott, S. U. (2015). Consumption of polyphenol-rich peach and plum juice prevents risk factors for obesity-related metabolic disorders and cardiovascular disease in Zucker rats. The Journal of
Nutritional Biochemistry, 26(6), 633-641. PMid:25801980. http://dx.doi.org/10.1016/j.jnutbio.2014.12.014
Pastor, M. V., Costell, E., Izquierdo, L., & Durá, N. L. (1996). Optimizing acceptability of a high fruit-low sugar peach nectar using aspartame and guar gum. Shipin Kexue, 61(4), 852-855. http://dx.doi.org/10.1111/j.1365-2621.1996.tb12218.x Saha, N. K., Balakrishnan, M., & Ulbricht, M. (2007). Sugarcane juice ultrafiltration: FTIR and SEM analysis of polysaccharide fouling. Journal of Membrane Science, 306(1-2), 287-297. http://dx.doi.org/10.1016/j.memsci.2007.09.006
Salimon, J., Abdullah, B. M., & Salih, N. (2011). Hydrolysis optimization and characterization study of preparing fatty acids from Jatropha curcas seed oil. Chemistry Central Journal, 5(67), 1-9. PMid:22044685.
Shah, N., Cynkar, W., Smith, P., & Cozzolino, D. (2010). Use of attenuated total reflectance mid infrared for rapid and real-time analysis of compositional parameters in commercial white grape juice. Journal of Agricultural and Food Chemistry, 58(6), 3279-3283. PMid:20170170. http://dx.doi.org/10.1021/jf100420z
Shen, S. L., Yin, X. R., Zhang, B., Xie, X. L., Jiang, Q., Grierson, D., & Chen, K. S. (2016). CitAP2.10 activation of the terpene synthase CsTPS1 is associated with the synthesis of (+)-valencene in ‘Newhall’ orange. Journal of Experimental Botany, 67(14), 4105-4115. PMid:27194737. http://dx.doi.org/10.1093/jxb/erw189
Singh, B. R., Wechter, M. A., Hu, Y., & Lafontaine, C. (1998). Determination of caffeine content in coffee using Fourier transform infra-red spectroscopy in combination with attenuated total reflectance technique: a bioanalytical chemistry experiment for biochemists. Biochemical Education, 26(3), 243-247. http://dx.doi.org/10.1016/S0307-4412(98)00078-8
Vardin, H., Tay, A., Ozen, B., & Mauer, L. (2008). Authentication of pomegranate juice concentrate using FTIR spectroscopy and chemometric. Food Chemistry, 108(2), 742-748. PMid:26059156. http://dx.doi.org/10.1016/j.foodchem.2007.11.027 Wanyo, P., Meeso, N., & Siriamornpun, S. (2014). Effects of different treatments on the antioxidant properties and phenolic compounds of rice bran and rice husk. Food Chemistry, 157, 457-463. PMid:24679804.
http://dx.doi.org/10.1016/j.foodchem.2014.02.061
Funding: None.