Environments
Paulo Alves
1, Luísa Miranda
1,2and Carlos Morais
1,2 1Polytechnic Institute of Bragança, Bragança, Portugal
2
CIEC
–
University of Minho, Braga, Portugal
[email protected]
[email protected]
[email protected]
Abstract: Virtual learning environments (VLEs) have witnessed a high evolution, namely regarding their potentialities, the tools and the activities they provide. VLEs enable us to access large quantities of data resulting from both students and teachers’ activities developed in those environments. Monitoring undergraduates’ activities in VLEs is important as it allows us to showcase, in a structured way, a number of indicators which may be taken into account to understand the learning process more deeply and to propose improvements in the teaching and learning strategies as well as in the institution’s virtual environment. Although VLEs provide several data sectorial statistics, they do not provide knowledge regarding the institution’s evolution. Therefore, we consider the analysis of the activity logs in VLEs over a period of five years to be paramount. This paper focuses on the analysis of the activities developed by students in a virtual learning environment, from a sample of undergraduate students, approximately 7000 per year, over a period of five academic years, namely from 2009/2010 to 2013/2014. The main aims of this research work are to assess the evolution of activity logs in the virtual learning environment of a Portuguese public higher education institution, in order to fill possible gaps and to hold out the prospect of new forms of use of the environment. The results obtained from the data analysis show that overall, the number of accesses to the virtual learning environment increased over the five years under study. The most used tools were Resources, Messages and Assignments. The most frequent activities developed with these tools were respectively consulting information, sending messages and submitting assignments. The frequency of accesses to the virtual learning environment was characterized according to the number of accesses in the activity log. The data distribution was divided into five frequency categories named very low, low, moderate, high and very high, determined by the percentiles 20, 40, 60, 80 and 100, respectively. The study of activity logs of virtual learning environments is important not only because they provide real knowledge of the use that undergraduates make of these environments, but also because of the possibilities they create regarding the identification of a need for new pedagogical approaches or a reinforcement of previously consolidated approaches.
Keywords: virtual learning environment, activity logs, digital tools, digital contents, undergraduates
1.
Introduction
Virtual learning environments have been the research subject of several researchers and have represented an element of technological and pedagogical modernisation and updating to several educational institutions, namely to higher education institutions.
There are many and diversified aspects and dimensions associated with virtual learning environments. Lagarto (2013) highlights that they can be used either as plain repositories of contents which teachers provide or recommend to their students, or as spaces of interaction and knowledge building, namely through the use of training pedagogical models which use forum or chat online discussions, wikis and blogs building, doubt clarifying spaces, topics and projects development, and training assessment of the undergraduates’ performance in actions they are involved in within the degree courses they attend.
In order to assess the potentialities of the virtual learning environment tools as well as of their use patterns, it is crucial to know the relation that undergraduates establish with these environments, namely as far as their
access to the environment is concerned. The identification of students’ accesses was conducted based on the
number of accesses regarding the activity logs of the virtual learning environments.
Thus, this paper focuses on the analysis of the evolution of accesses regarding the activity logs of the virtual environment of a sample of undergraduates in the academic years between 2009/2010 and 2013/2014.
The main aims of this research consist of:
Assessing the evolution of accesses regarding the activity logs of the virtual learning environment;
Classifying the frequency of accesses to the virtual learning environment;
Assessing the type of activities developed with the tools in the virtual learning environment.
The answer to the referred aims will be obtained from the activity logs of the virtual learning environment by the students of a Portuguese higher education institution, with a sample of approximately 7000 per year, over a period of five academic years.
Hereafter is the theoretical framework, the methodology used, the results and the conclusions.
2.
Activities performed in virtual learning environments
The analysis of activity logs of virtual learning environments represents a topic of great interest and current relevance, especially when we consider the tools provided by such environments. Garrote, Pettersson (2011) divide the tools associated with virtual learning environments into four groups: distribution tools, communication tools, interaction tools and administration tools.
According to Lera-López, Faulin, Juan, Cavaller (2012), most universities integrate virtual learning environments in their higher education programs because they consider that among other potentialities, they enable undergraduates to use the technologies they provide to access materials of the degree courses they attend, do tests and self-assessment, develop individual and collaborative learning activities and clarify questions with colleagues and teachers.
Virtual learning environments have become a reality and a frequent access space for both teachers and students. However, their main focus has been laid on technological aspects when in fact, it is also crucial to associate these environments with methodological innovation (Zapata-Ros, 2014). Although the European Commission suggest that the conventional sense of the classroom continues to be the basis of higher education systems, they consider that the integration of new instruments and pedagogies may be complemented by many online learning opportunities (European Commission, 2014).
Lam, Lo, Lee and McNaught (2012) suggest that it is increasingly necessary to analyse the way contents are provided by teachers and used by students, and to know the frequency of such use. These authors claim that keeping records or logs of activities efficiently and extracting and interpreting such records may provide valuable
information. As Günes, Akçay, and Dinçer (2010) state, such information may be useful to determine students’
profiles, show their course of actions in the environment and set priorities in the decision-making regarding online learning systems.
The information obtained from the analysis of undergraduates’ activity logs of virtual learning environments may provide indicators regarding the way they get involved in the degree courses, interact with other students and acquire concepts throughout their academic journey. The European Commission also state that such records may provide information regarding the learning process, enabling for example, the assessment of the immediate impact of the different approaches implemented by teachers, or the identification of students who are struggling, which may contribute to a decrease in failure rates (European Commission, 2014).
In the view of Romero, Ventura, and García (2008), knowing the records of undergraduates’ accesses and activities in virtual learning environments may be useful to organize students in groups according to their learning and monitoring needs as well as to identify patterns and flaws by identifying the most frequent errors and the most effective activities.
in the academic activities, which often prevents them from finishing their degrees. Macfadyen and Dawson (2010) also claim that higher education institutions can use the predictive power of undergraduates’ activity logs to develop reporting tools which may identify students at risk, thus allowing appropriate pedagogical intervention.
3.
Methodology
The nature of this study is essentially quantitative and the main data collection technique used was the desk review. The data was obtained using computing procedures and consulting databases associated with the virtual learning environment. The data collection process followed the institution’s privacy policy, namely regarding authorisation and access to data, as well as the virtual learning environment users’ confidentiality. The data is consistent and valid, being available in databases which are validated and correctly monitored by entities belonging to the institution attended by the undergraduates.
A quantitative approach was chosen because the variables in this study assume numerical values and predominance was given to a descriptive analysis of data as well as its display in tables and charts, making it possible to test the relation between variables through statistical procedures (Creswell, 2014).
As pointed out by Kumar (2011), a study can be considered quantitative when it intends to quantify the variation of a phenomenon, situation, problem or question, the information is obtained through predominantly quantitative variables and the data analysis is oriented towards the assessment of the variation range.
The data under analysis refers to the activity logs of the virtual learning environment over the academic years between 2009/2010 and 2013/2014 by the students of a Portuguese public higher education institution.
According to Lam, Lo, Lee, and McNaught (2012), when dealing with a virtual learning environment, the records of data regarding the contents published and the access to those contents are not easy to obtain. However, the authors point out that knowing these records provides relevant information about the availability and access to contents without overloading both students and teachers with surveys or other time consuming data collection tools to obtain that same information. Black, Dawson and Priem (2008) reinforce this idea by suggesting that the LMS which automatically keep records of students’ activities may provide alternatives to the questionnaire research methodologies currently used.
As far as the size of the sample is concerned, Table 4 presents the number of students of the Institution registered in the virtual environment during the five years under analysis as well as the percentage corresponding to each one of the Institution schools.
Table 1: Institution students registered in the virtual environment in the academic years between 2009/2010 and 2013/2014
Academic Years
Registered Institution students (n)
Institution Schools
A(%) B(%) C(%) D(%) E(%)
2009/2010 7536 13 22 31 15 18
2010/2011 7405 13 24 32 15 15
2011/2012 7064 13 24 33 14 16
2012/2013 6931 12 26 33 14 15
2013/2014 6642 13 24 34 13 16
The virtual learning environment under study serves the whole institution. However, both access to the environment and the activities developed by the undergraduates are associated with each one of the schools that compose the institution. The schools of the institution are identified as School A, School B, School C, School D and School E. Each school is characterized according to the main areas of the courses they provide, following the classification of the Fields of Science and Technology (FOS) adopted by the OECD. Thus, the main areas taught at each school are:
School A: Agricultural Sciences;
School B: Social Sciences and Humanities;
School C: Engineering and Technology Sciences; Social Sciences;
School E: Medical and Health Sciences.
The results are presented below, focusing on aspects related to the overall institution as well as on relations between the parts and between the parts and the whole, according to the aims defined for this research.
4.
Results
4.1
Evolution of accesses to the virtual learning environment
In this presentation of results, we start by highlighting the number of undergraduates’ accesses to the institution’s virtual learning environment. The identification of these numbers enables us to assess the relation between students and the virtual environment as far as access frequency is concerned. The virtual environment represents a coherent whole for the overall institution. However, the institution is made up of five schools with different dimensions, goals and characteristics. Therefore, we present the overall evolution as well as the evolution in each of the schools.
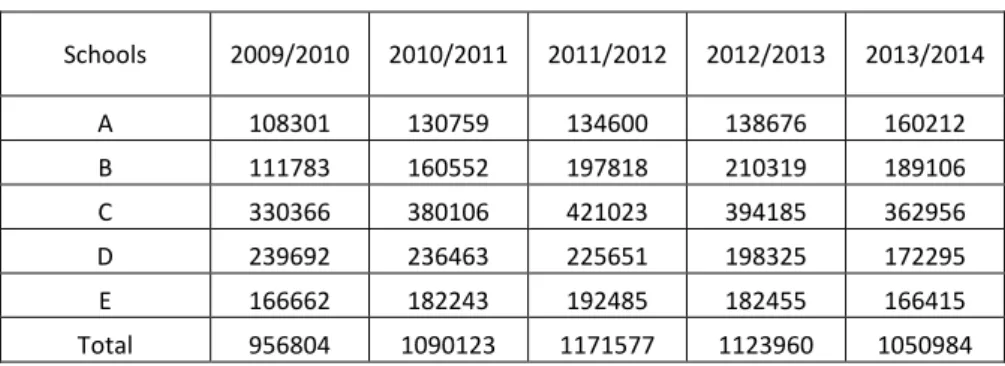
In Table 2, we present the data regarding access to the virtual environment over the period between 2009/2010 and 2013/2014.
Table 2: Number of accesses to the virtual learning environment per academic year (n)
Schools 2009/2010 2010/2011 2011/2012 2012/2013 2013/2014
A 108301 130759 134600 138676 160212
B 111783 160552 197818 210319 189106
C 330366 380106 421023 394185 362956
D 239692 236463 225651 198325 172295
E 166662 182243 192485 182455 166415
Total 956804 1090123 1171577 1123960 1050984
The analysis of Table 2 shows that considering the whole of the Institution’s schools, there was an increase in the number of accesses during the first three years and a decreasing trend during the last two years.
This situation represents a finding which enables us to raise several questions in need of urgent attention. Among such questions, we highlight the following: What are the reasons for this decrease? Is it due to a loss of undergraduates’ interest in the environment, to the methodologies used or to technological alternatives which replace the institution’s virtual environment?
On the other hand, the analysis of Table 2 shows that school A continues to reveal a high increase over the five years whereas all the other schools show a decrease in the number of accesses from 2012/2013 to 2013/2014.
The evolution of the number of accesses regarding the activity logs of the virtual learning environment in each school is presented in figure 1.
The graphic representation in Figure 1 stresses the overall evolution per school. However, as the number of students varies from school to school and from year to year, it is relevant to calculate the mean of accesses per student in each of the schools over the five years under analysis.
Therefore, in Table 3, we present the mean of accesses per student during the five years.
Table 3: Mean of the number of accesses to the virtual learning environment over five years
Schools 2009/2010 2010/2011 2011/2012 2012/2013 2013/2014
A 110.3 134.1 147.9 171.4 181.6
B 66.2 89.7 114.9 118.4 118.2
C 142.9 160.0 178.2 170.6 162.1
D 206.6 209.6 231.9 205.9 195.6
E 119.6 160.1 175.3 170.0 160.0
Total 127.0 147.2 165.9 162.2 158.2
Considering the data presented in Table 3, we highlight that the lowest mean of 66.2 was observed in school B in the academic year of 2009/2010, whereas the highest mean was of 231.9 in school D during the academic year of 2011/2012. These figures show differences regarding students’ means of the number of accesses to the virtual environment but do not enable us to assess whether there are pedagogical differences among the schools. Therefore, further studies would be necessary in order to interpret these differences.
Taking into account the relevance of the study for the analysis of the virtual environment and its action in each school of the institution, we present in Figure 2 the graphic representation of the evolution of the accesses mean per student in each school and year.
Figure 2: Evolution of the mean of the number of accesses per student in each school
It is important to highlight that school B (Social Sciences and Humanities) is the one which presents the lowest mean of accesses per student in each academic year, whereas school D (Social Sciences) is the one presenting the highest mean in all academic years. The data also shows that only in school A (Agricultural Sciences) did the mean of accesses always increase year after year.
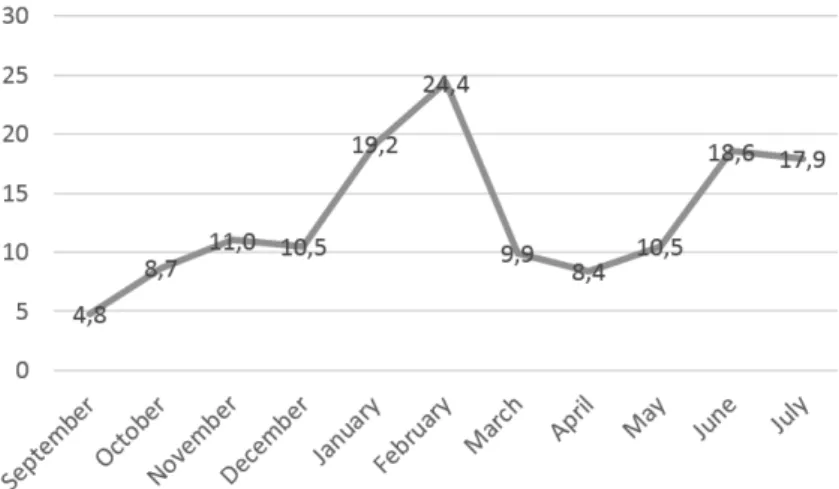
Figure 3: Mean of accesses per student and per month over five years
The analysis of Figure 3 shows that the months which reveal the highest mean of accesses are January and February as well as June and July, which correspond to the end of the exams season of the 1st and 2nd term, respectively.
We may consider that virtual learning environments are used in all higher education institutions. However, little is known about the patterns of use in terms of the number of accesses to each virtual environment.
4.2
Classification of the frequency of accesses to the virtual learning environment
In this study, there was a particular concern with the analysis and classification of the number of accesses to the environment of the institution under study. There are several aspects which may influence the number of users’ accesses to a virtual learning environment. Among those are the tools and the information they provide, the institution’s predominant methodologies and the institution’s dynamics as far as the use of technologies, their updating and innovation are concerned. However, assuming that each institution grants and provides the same conditions, tools and services to all its members, we observe that the number of accesses greatly differs from person to person.
Numbers are essential to understand the world, but their meaning is better perceived when we associate them with words which can make them more easily understood. Therefore, after knowing that the number of accesses to the virtual learning environment was determined by the accesses of approximately 7000 undergraduates per year, one question arose: How to classify access frequency in each institution based on the number of accesses? For the reasons previously mentioned, we believe that such a classification cannot be done in absolute terms, as we cannot define intervals with fixed extremes and classify according to those intervals. Due to the fact that those intervals might be altered from year to year, we chose to classify in relative terms, according to the following criteria:
We consider the users of the virtual learning environment to be all the elements that access the environment at least once;
In each year, we consider the distribution in ascending order of the numbers of accesses of each user, with
the smallest number being the minimum value of the distribution and the biggest number being the maximum value, which correspond respectively to the user who accessed the lowest number of times and the one who accessed the highest number of times;
We divided the distribution of the numbers of accesses according to their minimum value (m) and the percentiles (p) 20, 40, 60, 80 and 100. We calculated the respective values p20, p40, p60, p80 and p100, thus obtaining five intervals containing the data of approximately the same number of users;
By following the established rules, it is always possible to classify the frequency of access to the virtual learning environment of each institution, always focusing on the relation between the whole and its parts. With this classification, what varies from institution to institution is the deductible values of each category’s data, such as the minimum value, the maximum value, mean, median and mode.
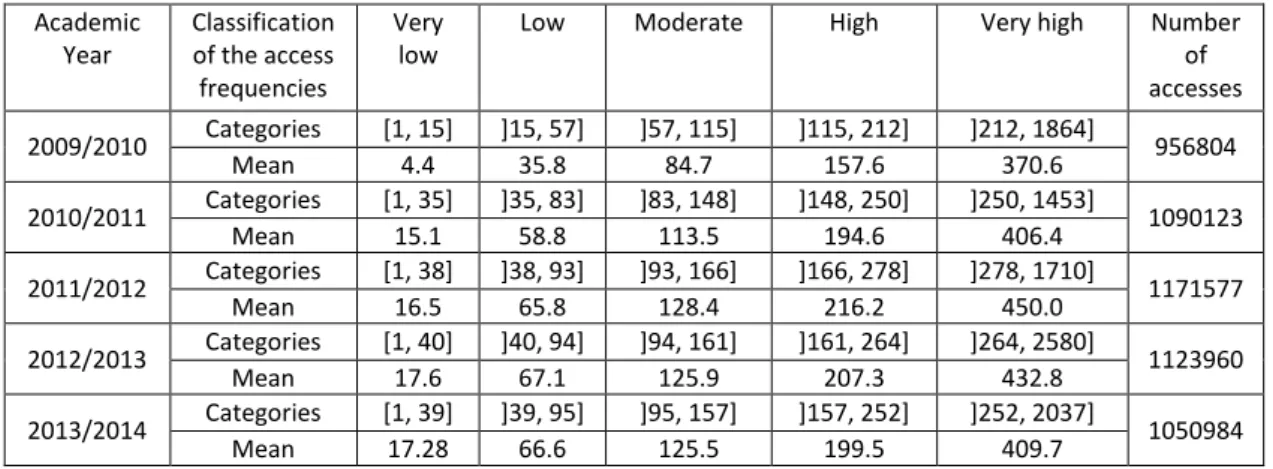
The classification of the access frequencies of this research is presented in Table 4.
Table 4: Classification of the frequency of accesses to the institution’s virtual learning environment over the period between 2009/2010 and 2013/2014
Academic Year
Classification of the access frequencies
Very low
Low Moderate High Very high Number of accesses
2009/2010 Categories [1, 15] ]15, 57] ]57, 115] ]115, 212] ]212, 1864] 956804
Mean 4.4 35.8 84.7 157.6 370.6
2010/2011 Categories [1, 35] ]35, 83] ]83, 148] ]148, 250] ]250, 1453] 1090123
Mean 15.1 58.8 113.5 194.6 406.4
2011/2012 Categories [1, 38] ]38, 93] ]93, 166] ]166, 278] ]278, 1710] 1171577
Mean 16.5 65.8 128.4 216.2 450.0
2012/2013 Categories [1, 40] ]40, 94] ]94, 161] ]161, 264] ]264, 2580] 1123960
Mean 17.6 67.1 125.9 207.3 432.8
2013/2014 Categories [1, 39] ]39, 95] ]95, 157] ]157, 252] ]252, 2037] 1050984
Mean 17.28 66.6 125.5 199.5 409.7
The analysis of Table 4 shows that the behaviour regarding the mean of accesses increased in all categories during the first three years and presented a decreasing trend in the last two years. We highlight that the mean of the number of accesses varied in the category “very low” between 4.4 and 17.6; in the category “low”
between 35.8 and 67.1; in the category “moderate” between 84.7 and 128.4; in the category “high” between
157.6 and 206.2; and in the category “very high” between 370.6 and 450.0.
In the case of the institution under study, the values found raise several questions which need understanding and answering. Among such questions, we highlight the following: In a time that is essentially technological, what reasons lead 20% of the students of a higher education institution not to access the institution’s virtual learning environment on average more than 18 times per year? What reasons lead to such a high variability between the frequency category “very low” and the category “very high”, considering that the means between the 20% of students accessing the environment the least and the 20% who access it the most varies over the five consecutive years under study 366.2, 391.3, 433.5, 415.2 and 392.4, respectively? It would also be relevant to assess the relation between the number of accesses to the virtual learning environment and the undergraduates’ academic results.
The behaviour of the accesses means according to the defined categories is represented in Figure 4.
Considering the process used, the distribution of the means of the whole set of accesses during each academic year is always divided into five intervals with an approximately similar number of data. The mean of each interval represents a strong indicator regarding undergraduates’ access to the virtual environment, which enables us not only to identify outlier values of use of the environment, but also to study the accesses evolution in levels of use frequency.
The use of the virtual environment is consolidated among the teachers and students within the institution and all its schools. Therefore, in order to prevent possible drop-outs and to increase the number of accesses to the virtual environment, especially among the undergraduates included in the frequency categories “very low” and “low”, we suggest that alerts may be integrated in virtual learning environments so as to inform the teachers and the institutions’ entities on the participation of students in these environments, as the acknowledgement of either a low frequency of accesses or a lack of accesses to the environment by students should motivate teachers to analyse those students’ actions in detail as far as motivation and involvement in learning activities are concerned.
4.3
Activities developed by undergraduates in the virtual learning environment
The activities performed in the institution’s virtual learning environment are associated with the access to the following tools: Notices, Blogs, Digital Locker, Calendar, Chat, Statistics, Forums, Area Members, Messages, Resources, Tests, Assignments and Wikis. Among the actions performed, we highlight create, consult and respond in each of the categories listed.
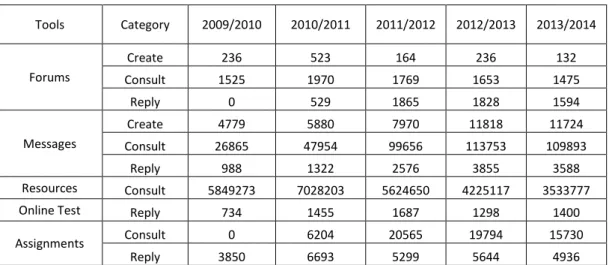
In Table 5, we present the distribution of the number of activities performed by undergraduates with the virtual learning environment tools.
Table 5: Number of activities performed by students with the virtual learning environment tools
Tools Category 2009/2010 2010/2011 2011/2012 2012/2013 2013/2014
Forums
Create 236 523 164 236 132
Consult 1525 1970 1769 1653 1475
Reply 0 529 1865 1828 1594
Messages
Create 4779 5880 7970 11818 11724
Consult 26865 47954 99656 113753 109893
Reply 988 1322 2576 3855 3588
Resources Consult 5849273 7028203 5624650 4225117 3533777
Online Test Reply 734 1455 1687 1298 1400
Assignments Consult 0 6204 20565 19794 15730
Reply 3850 6693 5299 5644 4936
By observing Table 5, we conclude that the activity performed with the highest frequency in all the years under study was consulting information using each of the following tools: Resources, Messages, Forums and Assignments.
If we consider the tool “Resources” as a distribution tool, “Messages” as a communication tool and “Forums” as an interaction tool, the indicators regarding the number of students’ activities indicate a trend similar to that observed by Garrote, Pettersson (2011) concerning teachers, as these authors concluded that the distribution tools are used more frequently than the communication or the interaction ones.
5.
Conclusions
In this study, we analysed undergraduates’ activity logs of a virtual learning environment within a Portuguese public higher education institution over a period of five academic years. The results showed that in the overall set of schools forming the institution, there was an increase in the number of accesses in the first three years and a decreasing trend in the last two years. However, this trend is not observed when we analyse each one of the schools separately. We divided the distribution of accesses into five groups according to the minimum value and five percentiles, thus obtaining five intervals with approximately the same number of data, classifying the users according to the frequency of access to the virtual learning environment into the following categories: very low, low, moderate, high, very high.
As far as the mean of the accesses is concerned, the behaviour revealed an increase in all the categories in the first three years and a decreasing trend in the last two years. It is relevant to point out that the mean of the accesses varied in the category “very low” between 4.4 and 17.6; in the category “low” between 35.8 and 67.1;
in the category “moderate” between 84.7 and 128.4; in the category “high” between 157.6 and 206.2; and in
the category “very high” between 370.6 and 450.0. These figures cause us to raise the question of why in an essentially technological era, 20% of a higher education institution students do not access their institution’s virtual environment on average over 18 times per year when simultaneously the 20% of students inserted in the category “very high” show an average up to 450 accesses per year. We must highlight that the difference between the means of the categories “very low” and “very high”, or in other words, between the 20% of undergraduates who accessed the environment the least and the 20% who accessed it the most in the five consecutive years was of 366.2, 391.3, 433.5, 415.2 and 392.4, respectively. The activities developed in the institution’s virtual learning environment are associated with accessing the tools: Notices, Blogs, Digital Locker, Calendar, Chat, Statistics, Forums, Area Members, Messages, Resources, Tests, Assignments and Wikis. Among the activities developed, we highlight in each of the tools listed above the actions create, consult and reply. The most frequent activity in each academic year was “consulting information”.
References
Al-Ashmoery, Y., Messoussi, R., Chaabi, Y., & Touahni, R. (2013). Monitoring and visualizing students tracking data online learning activities (tracking in e-learning platforms) mvsa. International Journal of Information Technology & Management Information System (IJITMIS), 4(3), 121-135
Black, E., Dawson, K., & Priem, J. (2008). Data for free: Using LMS activity logs to measure community in online courses. Internet and Higher Education, 11 (2008), 65–70
Creswell, J. (2014). Research design: Qualitative, quantitative, and mixed methods approaches (4th ed.). London: SAGE Publication Ltd.
European Commission (2014). Report to the European Commission on new modes of learning and teaching in higher education.
Garrote, R., & Pettersson, T. (2011). The use of learning management systems: A Longitudinal Case Study. eleed, Iss. 8. (urn:nbn:de:0009-5-31456)
Günes, I., Akçay, M., & Dinçer, G. (2010). Log analyser programs for distance education systems. Procedia Social and Behavioral Sciences, 9, 1208-1213
Lara, J., Lizcano, D., Martínez, M., Pazos, J., & Riera, T. A system for knowledge discovery in e-learning environments within the European Higher Education Area – Application to student data from Open University of Madrid, UDIMA, Computers & Education, Volume 72, March 2014, Pages 23-36, ISSN 0360-1315.
Kumar, R. (2011). Research methodology: A step-by-step guide for beginners. London: SAGE Publication Ltd.
Lagarto, J. (2013). Ambientes digitais de aprendizagem no Ensino Superior: Estudo de caso de uso do Moodle. Atas da VIII Conferência Internacional de TIC na Educação: Challenges 2013 (pp. 739–753). Braga, Portugal: Centro de
Competência TIC do Instituto de Educação da Universidade do Minho.
Lam, P., Lo, J., Lee, J., & McNaught, C. (2012). Evaluations of Online Learning Activities Based on LMS Logs. In Virtual Learning Environments: Concepts, Methodologies, Tools and Applications (pp. 1767-1784). Hershey, PA.
Lauría, E., & Baron, J. (2011). Mining Sakai to Measure Student Performance: Opportunities and Challenges in Academic Analytics. Retrieved: http://ecc.marist.edu/conf2011/materials/
Lera-López, F., Faulin, J., Juan, A., & Cavaller, V. (2012) Monitoring Students’ Activity and Performance. In Virtual Learning Environments: Concepts, Methodologies, Tools and Applications (pp. 1767-1784). Hershey, PA.
Macfadyen, L. & Dawson, S. (2010). Mining LMS data to develop an ‘‘early warning system” for educators: A proof of concept. Computers & Education, 54, 588–599
Romero, C., Ventura, S., & García, E. (2008). Data mining in course management systems: Moodle case study and tutorial. Computers & Education, 51 (2008), 368–384