M
ASTER
F
INANCE
M
ASTER
’
S
F
INAL
W
ORK
D
ISSERTATION
T
HE CAPITAL STRUCTURE CHOICES OF LARGE
E
UROPEAN FIRMS
OVER THE CRISIS
:
E
VIDENCE FROM
F
RANCE
,
G
ERMANY
,
I
RELAND
AND
P
ORTUGAL
M
ARIA
F
ÉLIX
M
ARIZ
M
ASTER IN
F
INANCE
M
ASTER
’
S
F
INAL
W
ORK
D
ISSERTATION
T
HE CAPITAL STRUCTURE CHOICES OF LARGE
E
UROPEAN FIRMS
OVER THE CRISIS
:
E
VIDENCE FROM
F
RANCE
,
G
ERMANY
,
I
RELAND
AND
P
ORTUGAL
M
ARIA
F
ÉLIX
M
ARIZ
S
UPERVISION:
P
ROFESSORC
LARAR
APOSOP
ROFESSORI
SABELP
ROENÇAI
Acknowledgements
I would like to use this section to express my thankfulness to all that contributed, directly and indirectly, to the progress of this MFW.
First, I would like to thank ISEG – School of Economics and Management of Lisbon – for the available facilities which allowed me to produce a quality work since I was able to include a range of data which gave more representativeness of the corporate reality.
A very special recognition and acknowledgement to my supervisor Professor Clara Raposo and Professor Isabel Proença for all the availability and readiness to assisting and guiding me thereby, contributing to higher quality of my dissertation. Likewise, I am deeply grateful to my family, because without their effort and education that they instilled in me this project was not possible.
II
Resumo
O objectivo desta dissertação de mestrado é identificar os factores que têm impacto sobre a decisão de estrutura de capital das empresas francesas, alemãs, irlandesas e portuguesas cotadas em bolsa. Pretendemos também identificar diferenças nesta escolha empresarial causada pela recente crise financeira internacional.
Para atingir o objectivo principal desta dissertação, este trabalho apresenta um resumo da pesquisa empírica realizada em torno do tema estrutura de capital, seguida por uma secção onde a metodologia utilizada no estudo é descrita, bem como as principais informações detalhadas sobre os dados recolhidos. Posteriormente, os resultados e as principais conclusões da dissertação serão apresentados nas últimas duas seções.
III
Abstract
The aim of this master thesis is to identify the factors that have an impact on the capital structure decision of French, German, Irish and Portuguese listed companies. We also aim to identify differences in this corporate choice caused by the recent international financial crisis.
In order to achieve the main purpose of this dissertation, this thesis presents a summary of the empirical research conducted around the capital structure theme, followed by a section where the methodology used in the study is described as well as the detailed key information about the collected data. Subsequently the results and main conclusions of the dissertation will be presented, in the last two sections. In general the outcomes transmit the idea that companies, when deciding how to finance their funding necessities, take in consideration a group of firm and country factors. Throughout the analysis of the estimated regression, the macroeconomic factors along with the country of origin are shown to be statistically significant. As for firm factors, only a few were considered significant when deciding about capital structure. It is worth highlighting that this capital structure decisions are influenced by the time period companies face, which answers one of the major questions of this research, that was to identify differences before and after the beginning of the international crisis.
IV
Table of Contents
Acknowledgements
I
Resumo II
Abstract
III Figures Index
VI List of Abbreviations
VII 1 Introduction
1 2 Literature Review: Capital Structure
4 2.1 The Perfect World of Modigliani and Miller
4 2.2 Trade-off Theory: Static and Dynamic
5 2.3 Peking Order Theory
9 2.4 Market-Timing Theory
10 2.5 Other Theories
12 2.6 Main determinants of Capital Structure Choice: Evidence
13 2.7 Capital Structure Choice around the World: Evidence
14 3. Methodology and Data
16 3.1 Methodology
V 3.2 Data
17 4. Results: The Effect of the Firm‟s Characteristics and
Country on Capital Structure Choice
20
4.1 Results for Country Specific Variables Effect on Capital Structure Choice
21
4.1.1 Results for Country Effect in Capital Structure Choice, Controlling for Firm Effects
22
4.2 Results for the Effect of Macroeconomic Variables on the Capital Structure Choice
23
4.2.1 Controlling for Firm-Specific Effects
25 4.3 Results by subsamples – before and after the crisis
26 Conclusions
30 References
33 Appendix
VI
Figures Index
Table 1: Summary of variables and results used in Titman and
Wessels‟ Research paper
36
Table 2: Definition of Variables 37
Table 3: Summary Statistics 39
Table 4: Correlations Matrix 40
Table 5: Results for Country Specific Variables Effect on the Capital Structure Choice
41
Table 6: - Results for Firm and Country Effects in the Capital Structure Choice
42
Table 7 Results for Firm and Country Effects in the Capital Structure Choice
43
Table 8: Results for the Effect of Macroeconomic Variables on the Capital Structure Choice
44
Table 9: Results for Firm and Macroeconomic Effects in the Capital Structure Choice
45
Table 10: Results for Firm and Macroeconomic Effects in the Capital Structure Choice
46
Table 11: Results by subsamples for Firm and Country Effects in Capital Structure
47
Table 12: Results by subsamples for Firm and Macroeconomic Effects in Capital Structure
48
Table 13: Evidence of incompatibility between variable Country_IE and the firm –specific variables – Size and Profitability1
49
VII
List of Abbreviations
CPI – Consumer Price Index FDC – Financial Distress Costs FE – Fixed Effects
- 1 -
1.
Introduction
Companies have necessity to raise funds to face their corporate needs and the way in which they choose these funds, which can either be debt, equity and other outstanding securities of the firm, establish their capital structure.
The main motivation behind this study has to do with the fact that capital structure is a very common topic in the corporate environment, since is known that the way in which companies affect their capital is influenced by their own characteristics and the economic/social reality where they operate. However researchers have difficult to explain the capital structure behaviour of one firm since there are no standard actions. For this reason, and since Europe is recovering from a Financial Crisis, I found interesting to analyse what was the impact of the crisis in the way firms balancing the factors, in order to choose their level of leverage.
In this dissertation I analyse the capital structure of the largest listed companies in four relevant and very different European countries – France, Germany, Ireland and Portugal – in 2003-2012, a period that encompasses the global financial crisis. We find this topic relevant for numerous reasons. First of all, because of the period under analysis, a period in which financial markets revealed some fragility; second, because the different European countries targeted in this study performed differently during the crisis and have natural differences in terms of location (centrality versus periphery of Europe) and also in terms of being or not intervened in financial
assistance programs conducted by the “troika”. We hope to be able to identify to what extent the capital structures of firms in these countries differ and were subject to changes during the period of the analysis.
- 2 -
However, depending on the industry in which the company operates, the choices of capital structure differ.
One option that managers can follow, regarding financing the firm, is using exclusively equity, which is also designated as unlevered equity, because of the nonexistence of debt. However, firm‟s managers can raise simultaneously equity and debt, and have outstanding debt - this sort of equity is named levered equity. In this case, there is a priority in the repayment to debt holders and only then to equity holders.
According to Modigliani and Miller (1958), capital structure is not relevant in perfect capital markets; however there are market imperfections, and thus there is indeed a concern regarding capital allocation in a firm. One of the market imperfections that strives a great impact in the funding‟s type utilized by firms is the amount of taxes1 paid on the income earned by them from their investments. The fact that companies pay taxes after the deduction of interest on their profit becomes an incentive to use debt, because interest expenses, originated by debt, will reduce the quantity of corporate tax that firms will have to pay. This will originate a gain to investors, namely the interest tax shield, which is the supplementary amount that a firm would have to pay in taxes if it did not resort to leverage. Needless to say, this tax benefit of debt over equity – ITS - would only apply in case firms are actually making profits.
Analysing from a different perspective, other market imperfections associated with debt obligations, are the so called costs of financial distress, i.e. direct costs of bankruptcy, which embrace all legal and accounting expenses, and also indirect costs of financial distress which may include costs related with losses of customers,
1
- 3 -
suppliers, employees and receivables, also fire sales of assets, costs derived from a delayed liquidation, and finally other indirect costs associated with creditors.
Agency costs and benefits of leverage are also important to determine the capital structure of a firm. High levels of debt can persuade managers and equity holders to take extreme levels of risk or investment that are undervalued. On the other hand, low values of debt may motivate wasteful expenses, when free cash flows are too high.
After realising all the benefits and the costs associated to debt, companies have to determine the desired debt‟s level in order to maximize their value.
- 4 -
2.
Literature Review: Capital Structure
In the financial environment, and especially, in corporate finance, the capital structure implemented by the firm is a very important topic studied by many researchers. Nonetheless, knowledge in this field is limited, as no theory or motive universally explains the choice of capital structure for all firms at all points in time. A good classic reference on this matter is Myers (1984) that analyses how different firms may select to issue debt, equity or hybrid. In sum, none of the theories that try to explain how capital structure decisions are made, gives a general clarification of financing strategy, because there are conditional strategies (Myers 2001). Therefore I present first a brief summary of the most influential articles and theories that identify relevant factors for the choice of capital structure. The second part of this section includes a summary of the empirical literature.
2.1 The Perfect World of Modigliani and Miller
The founding theory of capital structure was presented by Modigliani and Miller (1958), in their Propositions I and II, which is valid for a scenario of perfect capital markets2. These authors had an enormous contribution to the development of numerous theories that attempt to explain capital structure decisions, despite the fact that these propositions do not clarify the motivations behind the debt-equity choices,
yet they show how the company‟s value behaves according to their capital structure. Modigliani and Miller show that the capital structure decision would be irrelevant; however, by supressing market imperfections form their analysis, are able to identify the factors that actually would influence the capital structure choice.
2
Modigliani and Miller consider that their propositions hold in perfect capital markets, which follow conditions such as: 1) Investors and companies can trade securities at competitive market prices which are
- 5 -
Proposition I, from Modigliani and Miller, states that “In a perfect capital market,
the total value of a firm is equal to the market value of total cash flows generated by its assets and is not affected by its choice of capital structure”, revealing that in the presence of perfect capital markets, an improbably reality, the firms are indifferent in their choice regarding raising equity or, on the other hand increase equity plus debt to face their needs, because by the Law of One Price both securities and assets of a company must have equally market values.
2.2 Trade-off Theory: Static and Dynamic
The theory demonstrates that the trade-off model is subdivided in the static version and in a dynamic one. Relying on Myers (1984), static trade-off theory is when companies established a debt-to-equity ratio and progressively will meet it. The optimal leverage ratio is determined by firms, through a balance between costs and benefits of borrowing, such that it enhances the company‟s value.
Throughout the process of decision concerning financing policy, companies perceive costs and benefits of debt that they weight in their adjustment decision. These debt costs are the same utilized in the static trade-off theory, they correspond to direct and indirect bankruptcy costs. On the other hand the significant benefit of debt comprises the tax shield effect. Following Modigliani and Miller (1958) and their identification of the ITS effect, and Opler and Titman‟s (1994) assessment of costs of financial distress (FDC), we can establish that the levered value of a firm can be reached as:
(1) VL = VU + PV(ITS) – PV(FDC)
- 6 -
Observing formula (1), it is verifiable that firms have incentive to raise leverage in order to achieve the benefits that result from debt, nevertheless too much debt contributes to the increasing of the risk of default and consequently FDC.
In accordance to Berk and DeMarzo (2014), this theory is useful to solve two enigmas concerning leverage. First, the existence of FDC explains the reason for some companies‟ record low levels of debt, despite the existence of the ITS‟s benefit, in a way that the advantage of the ITS is not entirely exploit. Second, the differences of leverage registered in dissimilar industries arise from the differences in the volatility of the cash flows and the scale of the FDC.
In addition to FDC there are other situations, linked to debt holders‟ behaviour, which create additional costs, namely agency costs of leverage, and they tend to arise with higher probability when the risk of financial distress is bigger. These types of costs emerge due to the conflict of interests that numerous times occurs between shareholders and debt holders, because, according to the investment decisions made by the manager, the impact on the value of equity and debt will be distinct. Managerial actions can favour shareholders since equity holders are the ones who hire the manager; however this originates reprisals from credit holders and at the end will disparage the value of the company.
- 7 -
second type of agency cost, known as underinvestment, comes from the rejection of new positive-NPV projects in a financial distress situation. This is harmful to debt
holders and to the company‟s value because of wasted opportunities. Finally, it is visible how leverage impels managers and shareholders to act in their own behalf, decreasing the overall value of the firms.
Although there are costs associated to the agency issue of conflicts between equity and debt holders, it is also possible to point some benefits that appear from the parting of control (Manager) and ownership (Shareholders). As mentioned before, the manager can run the company in his favour using leverage, however the inverse situation is also accomplished, i.e., debt can be used as an incentive for managers to run it more efficiently. As in the agency costs part, the respective benefits can be observed in a firm over different forms, being the first, the commitment of the manager to the company, because debt can thrill him to operate more cautious and strategically, because of the risk of financial distress (Jensen, 1986). Secondly, leverage is an alternative form to raise funds without changing the ownership, keeping the ownership concentrated and in that order shareholders do not renounce their majority enabling them to maintain a solid influence, which will be reflected in
“doing what is best for the firm”.
After realising the existence of other implications, besides FDC, to be taken in consideration in the choice of the capital structure is mandatory to readjust equation (1) and include the agency costs and benefits into trade-off theory, when representing levered value of a firm:
- 8 -
Even as companies gear their capital structure for a target debt ratio, they may face disabilities to movements to their target ratio, and because of changes in stock prices and profitability of firms, their target is subject to disparities
To a more realistic approach, researchers consider the existence of adjustment‟s
costs, otherwise the optimal ratio should be the deb-to-equity ratio observed in the firm. Having in considerations these costs, and still following Myers (1984), companies cannot instantly counterbalance the events that drive away their capital structure from the optimum, they must consider, in one side the tax shield effect, and on the other the costs of financial distress. In this context, and in view of the tax shield advantage, firms that record high profits will have associate low debt, however, in accordance to Myers (2001), the contradictory relationship can be verified if managers explore the importance of the interest tax shield, i.e., firms with high profitability have more taxable income to shield, thus can take more debt deprived of risking financial distress.
According to Myers (1984), this philosophy sounds reasonable and defines an interior optimum debt ratio, although it does not fit well entirely to reality, because actual leverage ratios diverge wildly between similar companies, which lead us to reflect that there are other factors, still not studied, which are the source of such situation occurs.
- 9 -
Empirical studies on the trade-off model also cover the other side of the theory and consider rebalancing of leverage a dynamic process, through which firms will be more willing to increase leverage if their leverage is comparatively low (Leary and Roberts 2005). This type of model implies a readjustment of the capital structure toward a target ratio, that reflects the trade-off of the benefits and costs which were achieved through the previous version – static trade-off model. The main implication of this dynamic rebalancing for the empirical work, concerning financing choices, is that any force which presses the leverage to one of the boundaries increases the chance of beating that boundary and thus increases the probability of firms taking action by readjusting their leverage. It is predictable that the relation between the leverage level and the prospective of an adjustment in the current level to be negative. Another relevant matter in this theory is related to the fact that, previous adjustments in leverage have impact on the probability of future adjustments, being this influence a positive connexion between past decreasing (or increasing) decisions and the likelihood of upcoming leverage-increasing (or decreasing) choices.
However, according to these authors plus Fama and French (2002), the leverage issue is handled using partial adjustment models, which explains the slowness of the rebalancing process reaching the optimal leverage‟s range. The reality of the partial adjustments is due to the fact that, allowing the presence of adjustment costs, companies have to balance the extent to which the costs of readjusting the leverage beyond, or not, the benefits, and measure the impact on corporate financing policy.
2.3 Pecking Order Theory
The other theory that can explain capital allocation decisions is the pecking order
- 10 -
(Myers 1984). When internal cash flow is not enough to support capital expenditures, firms will resort to debt instead of equity. The pure pecking order theory argues that companies do not have a distinct target of leverage ratio.
Behind the pecking order model, the underlying idea is one of asymmetric information - managers have inside information, which has influence in the
manager‟s decisions concerning investing or not in a positive-NPV project, admitting that the two sources of capital to finance the project are issuing stocks or selling other marketable securities. If this private information is unfavourable to the old shareholder, managers will refuse to issue shares, even if this means lose an
investment‟ chance.
One of the major implications of a model grounded on asymmetric information and managers acting in the interest of passive old shareholders (the pecking order model), according to Myers and Majluf (1984), is the tendency for firms to adopt a behaviour in which they prefer internal sources of fund rather than external sources, furthermore companies favour debt to equity if they have to resort to external financial sources, so that they do not dilute the equity of their current shareholders by selling new undervalued shares.
One limitation of the pecking order theory relates to the fact that it does not show how the asymmetric information can affect the financing policy, showing that each of the capital structure theories are best applied in some conditions and circumstances than in others.
2.4 Market-Timing Theory
- 11 -
advantage of temporary fluctuations in the cost of equity relative to the others, and issue shares at high prices. For this theory there are two versions presented, being the first a dynamic form of Myers and Majluf (1984). The second version of the theory is related with irrational investors or managers and their insights of mispricing, i.e., managers will take advantage when the share price is below the fair one to issue equity and to repurchase shares when the price is higher than the fair market price.
The impact that market timing has on capital structure is significant in the long-term, because the capital structure is understood as the cumulative outcome of attempt to time the equity market and therefore produces persistent effects on the way in which companies allocate their capital resources. In accordance to this rationale the relevant conclusion to be drawn is that it does not exist an optimal capital structure in this theory.
- 12 -
2.5 Other Theories
Researchers have been developing theories to support the behaviour of the companies regarding capital structure decisions, and besides Trade-off and Pecking Order theories, there are others, such as Managerial Hypothesis, Neutral Mutation Hypothesis or the Free Cash Flow Theory (which itself can be seen as an example of an agency benefit of debt).
Starting when the Managerial Entrenchment theory of Zwiebel (1996), this concept elucidates that high valuations and valuable investment chances eases financing through equity, but on the other hand, enables managers to become entrenched, i.e., managers select capital structure primarily to prevent the discipline of debt, because raising leverage sacrifices value of the firm which is not attractive for the shareholders, who may be tempted to replace the manager. This theory represents a model of dynamic capital structure that illustrates how unchallengeable managerial
entrenchment influences a manager‟s capability to issue debt before times of
financial constraints, in order to avoid projects with negative returns associated. Going back to mention Baker and Wurgler, these authors ponder that there is an approximation between this theory and Market Timing theory, since managers also take advantage from high valuations to issue equity and do not subsequently readjust.
Regarding Neutral Mutation theory, which is presented by Miller (1977), it suggests that companies tend to get used to certain financing pattern, which have no significant influence on firm value; however someone who recognizes these habits tend to extrapolate conclusions about the corresponding financing behaviour.
- 13 -
that are disposed to overinvest. This theory supports that extremely high debt levels lean towards an increase in value, in spite of the financial distress, if the firm‟s cash flow surpass the earnings derived from their investment occasions. This argument can be framed also as an example of agency benefits of debt.
2.6 Main Determinants of Capital Structure Choice: Evidence
The empirical studies concerning financing policy of the companies, suggest there exists a set of attributes that determine the diversity of costs and benefits related to the sources of financing. The major determinants that affect the debt-equity choice, according to the diverse theories regarding capital structure and, particularly following Titman and Wessels‟ (1988) study, are asset structure, non-debt tax
shield, firm‟s growth, sector/industry, uniqueness, company‟s size, profitability and
volatility of the earnings. To represent these determinants a group of proxies are used which can vary depending on the researcher and his/her beliefs. However, in accordance to the same authors, the method of using proxies to represent the main determinants of capital structure involves some problems, namely the fact that the most commonly used attributes are unobservable, so it is difficult to find appropriated proxy variables, since in most cases researchers find several proxies to characterize one determinant/attribute. Another issue relates to a particular variable working well in terms of statistical criteria, but not so well in the interpretation of its significance levels and its tests.
- 14 -
Appendix, Table 1. When examining Titman and Wessels‟s main results it is possible to notice that only attributes such as Uniqueness, Size and Profitability of the company are statistically significant, meaning that these are the firm‟s characteristics that have greater importance in the assignment‟s decisions of the
company‟s capital. Moreover, the relation between these variables and the debt -to-equity ratio is noteworthy, which for these cases is negative, that is, the larger the company and its profitability as well as its uniqueness, the lower the tendency to this firm opting for a capital structure predominantly with debt, but rather the opposite. In order to evaluate the statistical significance of each determinant over the capital structure of one firm, researchers have to express the dependent variable which will represent the value of leverage. Regarding this subject, the key point is to choose if the variable representative of debt-equity ratio will be measured in book values or in market values. On occasion, it is from this choice that arise different conclusions for dissimilar types of values used. Nonetheless, in accordance with Bowman (1980), the correlation between book and market values of debt is large, consequently the probability of an incorrect interpretation of the coefficients is minor, preventing a
bias interpretation of the determinants‟ effect on debt ratio.
2.7 Capital Structure Choice Around the World: Evidence
- 15 -
in this sort of analysis are of an institutional nature, which may include legal enforcement, shareholder/creditor right protection, market/bank-based financial system and development of stock and bond markets, and further, macroeconomic measures, such as gross domestic product (GDP). These authors found evidence that international capital structures are different across countries and that firm-specific determinants are also subject to the influence of the determinants regarding the
country‟s firm.
The key findings, concerning the country‟s effect on the firm‟s capital structure, reported by Jong et al. (2007), suggest that credit right protection, GDP growth and the bond market performance have direct and significant impact on corporate debt to equity ratio. For another perspective, indirect impact, the researchers found that GDP growth remains statistically important to describe firm´s leverage, and beyond, legal enforcement and creditor/shareholders right protection.
- 16 -
3.
Methodology and Data
3.1 Methodology
We will estimate a panel data-type of model in which we explain the leverage of a firm defined as the ratio of book value of debt to market value of equity, with a list of regressors that are firm-specific. In a second specification we consider the existence of a country effect. In order to assess the importance of the explanatory variables, I had to resort to an econometric analysis by performing linear regressions. The estimation used in this study was based on the panel data method, since the type of data collected were a mixture of cross-sectional and time series data - Pooled Data – insofar as the work analyzed data of numerous subjects, in this case firms, observed over several periods, specifically years. With panel data it is necessary to choose between fixed or random effects estimator. To decide the most appropriate, given the set of variables involved, and when necessary, I conducted a Hausman Test, which exhibits the variables‟ coefficients corresponding to a regression using fixed effects and random effects, and also the Chi-square statistic for the cross-section with random effects, so that the latter provide us elements to assess if the random effect is statistically significant such that it leads me to choose random effects specification. At last, when performing econometric analysis with pooled data, came the need to define the coefficient covariance method as white period because this hypothesis assumes that companies in the sample are independent among them and amend the heteroskedasticity phenomenon and also fix the autocorrelation of the variables in time for each company.
- 17 -
variables considered in the analysis evaluate the capital structure of a company, and for that I choose the debt-to-equity ratio, but considering some variants. First, the debt-to-equity ratio is with book values, however the market value of equity give the stockholders a more up to date and realistic perspective of the company‟s equity, since book values are considered to be historical values and are often misleading because of being outdated. So I get to the second variant, which is the same ratio but in the denominator I used market value of equity. Finally, the last formulation of the dependent variable is founded on the previous one but replacing book value of debt by book value of net debt3. Observing the variation in the results using net debt instead of simple debt has become more popular as it gives a better notion of the
“effective” indebtedness of the firm after using its current liquidity.
In what concerns the explanatory variables, I also consider some different regressions. For the first results I included only the firms-specific variables while in another I include the country-specific variables so that it is possible to analyze the separate effect of these two different kinds of variables in the capital structure.
We further examine the difference between countries subject to the “Troika”
intervention and also examine different time sub-periods, according to the events associated with the recent financial crisis.
3.2Sample
In order to assess the capital structure choices of firms we build a panel of 1453 firms coming from Amadeus Database and respectively from four countries (Germany, France, Ireland and Portugal) for the period 2003-2012 – a period that encompasses the pre and after subprime crisis that originated many fragilities in the
3
Book value of net debt is the book value of debt minus the value of rubric of the assets “cash& cash
- 18 -
financial sector of some European countries, which collapsed in the recent European financial crisis. Behind the selection of these four countries is the fact that two of these countries – Ireland and Portugal – were significantly affected by the European financial crisis, both were subject to an external intervention program imposed by
“troika” and, on the contrary Germany and France managed to work around the unpleasant financial situation in which Europe was attracted. The selection of these four distinct economies has the purpose of making the analysis of the capital structure more complete and interesting because it covers two (if no more) different financial realities.
To achieve the final sample of firms, I collected information from all the listed companies from France, Germany, Ireland and Portugal and at that point all companies in financial services industry and in utility services were excluded, since these types of business are subject to specific regulation. As is common in the literature I identified a few companies as outliers. The criterion defined for the outliers was to remove 1% of the firms with the highest market values and 1% of the firms with the lowest market values.
We collected firm level data from two distinct sources, Amadeus‟ Database and DataStream Database. The majority of the firms‟ data that were essential for the regressions were book values, that I collected from Amadeus, however to a more realistic illustration of the leverage level of the firms, that will constitute the dependent variable, I decided to use equity market values in order to be more representative of the real situation of the firm, since the book value of equity is merely an historical value.
- 19 -
country in which the company is installed, and to gather the data that reflect these conditions, I resort to the European Central Bank Statistical Data Warehouse and to The World Bank database.
- 20 -
4.
Results: The
Effect of the Firm’s Characteristics and Country
on
Capital Structure Choice
We intend to examine if country of origin of a firm has an influence in its capital structure. Therefore, using our panel of firms from the four countries with annual data for the period 2003-2012, we start by estimating a regression in which the dependent variable is the leverage ratio and the explanatory variables are the country dummies. By so doing we are to identify differences across countries. These results are reported in Table 5 and comments made in subsection 4.1. We also consider the inclusion of the firm-specific variables mentioned above in section 3.1. These results are also presented in Tables 6 and 7, and comments in section 4.1.1.
- 21 -
Before presenting the results of the study, it is important to highlight that the Hausman test was applied to determine whenever we should perform estimations using Random or Fixed Effects.
Another relevant remark concerns the fact that the regressions that include macroeconomic variables, namely GDP, Inflation, CPI, Employment and Interest Rate (that is, variables that do not vary across firms), cannot include time dummy variables, to avoid multicollinearity. In fact, the macroeconomic variables themselves translate the effects of the different economic environment due to the progress of time.
4.1Results for Country Specific Variables Effect on Capital Structure Choice
To asses if country features have an impact in the way chosen by companies to finance their current operations I will examine the results obtained through the regressions using only country-variables. These results are in Table 5 and were estimated using random effects, since these types of variables do not change in time, so the fixed effect cannot be used to estimate the regressions.
- 22 -
4.1.1 Results for Country Effect in Capital Structure Choice, Controlling for
Firm Effects
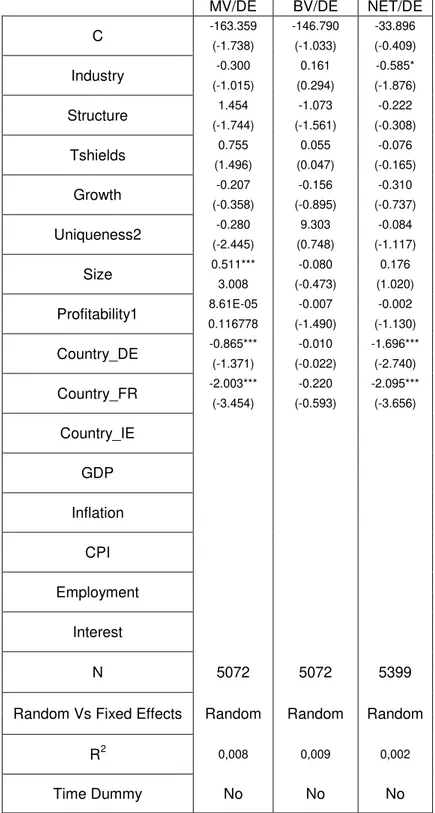
It might be over-simplistic to run a regression of leverage on country variables alone. Hence, we perform the same analysis, but this time controlling for the firm-specific variables suggested as relevant by the literature4. These results are present in Tables 6 and 7, for the various specifications of the variable Leverage and using Random Effects. This analysis is reflected in two distinct tables because the country variable representativeness of Irish companies (dummy-variable) has no values for
size and profitability (firms‟ variables) when it assumes the value 1, meaning that it is always zero5. Derived from the incompatibility between the two previous types of variables, Table 6 exclude the variables Size and Profitability1 and in Table 7 the
variable Country_IE isn‟t included.
This analysis indicates that the country effects are significant, as before seen in Table 5, but on the other hand firm specific variables reveal some significance in just a few variables.
The statistically significant variables worth mentioning in both tables is the industry, to which a firm belongs when considering net debt in the capital structure ratio, transmitting the idea of manufacturing companies having lower debt-to-equity values comparing with remaining ones, possibly given the tax benefits that they already have with their amount of depreciations. Specifically for Table 7, the firm‟s size is also significant for the amount of leverage that companies opt for, since a larger dimension can be also associated with a more cohesive financial structure, giving these firms a higher credibility to resort to financing from credit institutions.
4
For completeness we also ran regressions of Leverage on firm-specific variables only. Since these are not the focus of the dissertation, we chose not to tabulate those results, but they are available upon request.
5
This scenario can be observed in the Appendix, Table 13, by observing the descriptive statistics of the
- 23 -
The firms‟ country of origin, in the majority of the specification of leverage, is statically relevant to the capital structure choice, as we already found in Table 5 (Section 4.1) before controlling for the firm specific explanatory variables. This analysis confirms the previous comparison of the tendency of German, French and Irish companies relative to their Portuguese counterparts.
4.2Results for the Effect of Macroeconomic Variables on the Capital Structure
Choice
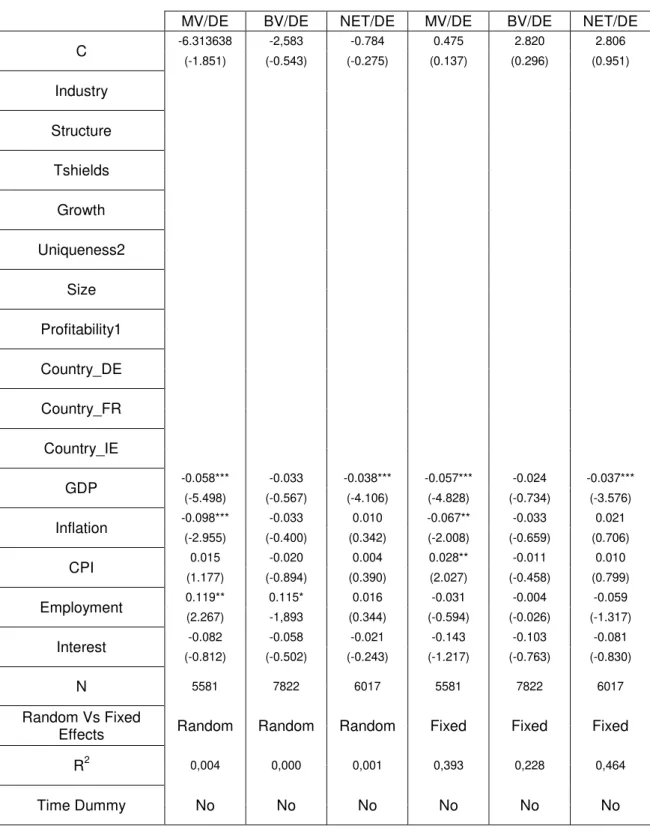
After briefly portraying the findings concerning the impact of the firm´s nationality in the selection of their appropriate capital structure, it is the time to ascertain whether macroeconomic factors themselves place any influence on the funding decisions of the companies, in a way that was not captured by the country dummies. The group of macroeconomic variables that were selected encompasses items that depict the economic wealth of a country and the development‟s degree of its capital market, which are important considerations to take into account when analyzing the conditions of a market/country and that may have implications in the way how companies fund themselves.
Since in this regressions was possible to estimate both with RE and FE, I performed an Hausman test and once I analyzed the output6, I determine, regarding effect specification of cross-sectional information, that FE are more appropriate because at the 10% significance level the random effect was not statistically significant, and coefficients provided by the regressions with fixed effect proved to be higher than using random effects.
When observing Table 8 (for the three definitions of leverage and for both random or fixed effects estimation) we find that GDP growth is the country variable that
6
- 24 -
most stands out, since, at 1% of significance level, it shows that the higher the
growth on the GDP of a country, the smaller is its firms‟ tendency to have high levels of debt. This finding illustrates what is expected to occur in companies from countries with higher annual generation of GDP. Since those companies are the ones that contribute to the growth of the GDP, it makes sense to say that we are talking about companies with high capacity to produce revenues and therefore great availability of capital to finance themselves without resorting to a third party. Beyond the GDP growth, Inflation rates, CPI and Employment rate in each country prove to be statically significant, when considering market values for equity in the debt-to equity ratio. Starting with estimation using RE, the variable representativeness of the inflation rate, what we can take from their coefficient is that, as in reality, companies that face inflation have higher volumes of sales, in value, whereby their results will be higher, which give to these companies more freedom of action to finance their operations with their own resources, having lower values for debt comparing to equity. As for the Employment rate, it proves to be significant to explain the capital structure of firms, wherein the higher the level of employment in a country, the lowest is the value of external funding. This may be a sign of the overall market/economy being more confident in times of higher employment, which may lead firms to fear bankruptcy less, and therefore engage in higher leverage.
- 25 -
the consumers, over time in the economy, for consumer goods and services. In the current study this variable exerts a positive influence in the choice of the leverage ratio. This might be due to the fact that the whole period under analysis has been a particularly low inflation period in Europe. In any case this variable was significant in one specification only.
4.2.1 Controlling for Firm-Specific Effects
Using the same rationale as in sub-section 4.1.1 we also control for firm-specific explanatory variables in Table 9.
These set of regressions reveal that there are some firm‟s characteristic as well as macroeconomic factors that are important for companies to make decisions concerning their capital structure in order to achieve the one more appropriate to their condition.
In this specific analysis numerous firm‟s features prove to be statistically significant,
starting with the firm „size which proves to be positively influential for the level of leverage, suggesting that larger firms incur in higher levels of debt as they tend to be more diversified and present lower chances of bankruptcy, consequently facing lower financial distress costs.
- 26 -
anyway, as we knew from the start of the study when data were collected. Besides these factors, the ratio between the ratio of the market value of a company to its accounting value – Uniqueness – seems to cause a negative impact on the leverage ratios chosen by firms, meaning that overvalued companies possibly appeal to debt in last resource, giving preference to internal funding sources, which promotes the pecking order theory philosophy.
The upcoming variables that deserve highlight, due to their significance for the
funding„s problem, are our variables of interest in this study, the ones related to the features of the country of origin of the companies. As noted earlier, GDP and Inflation again appear as important variables to explain the capital allocation that this study examines, confirming our results from Table 8, before controlling for firm specific variables. Interestingly, as opposed to what happened in table 8 of section 4.2, CPI is no longer statistically important (not even at 10% significance), but instead the variable employment reinforces its significance, indicating that countries with better employment rates tend to have companies more comfortably financed with debt.
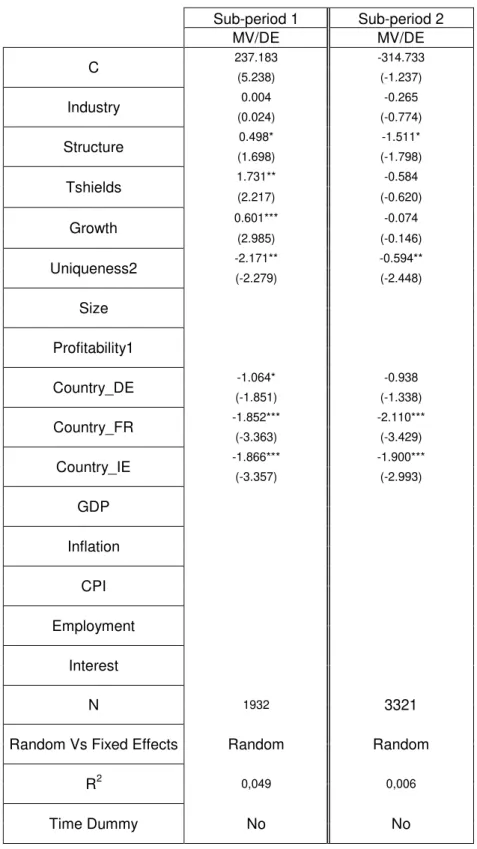
4.3Results by subsamples – before and after the crisis
Since the period under analysis encompasses two distinct moments regarding the economic situation in some European countries, including those in this sample, it emerges as interesting to check if some variables become more significant to the model when changing the time period of analysis, since we know that it is
expectable to record some changes in the firms‟ method of operating in order to
adapt to the external environment.
- 27 -
sample into two sub-periods. The first period is 2003-2007, and tries to assess capital structure choices made before the international financial crisis. The second period is 2008-2012 and tries to capture the capital structure of firms after the crisis emerges.
- 28 -
to more collateral available to companies present as guarantee to raise more debt. However a plausible justification for this outcome is that, after the crisis the market value of firms with more intangible assets drops so that the debt-to-equity ratio becomes higher, simply because of the fall of the market value of equity caused by an overall mistrust in the market. In any case the coefficients are only marginally significant which weakens their interpretation.
Regarding country variables, firms from the other countries in the sample tend to have lower levels of leverage comparing to Portuguese companies. However, in the second sub period the coefficient for German companies (comparing to Portuguese ones) is no longer statistically significant to explain the capital structure.
Table 11, concerning first sub period, reveals as significant factors the non-debt tax
shield, dimension of companies‟ growth, size and profitability and the three country
variables, as in the previous estimation. However for the last sub period, only the
assets‟ structure and growth prove to be statistically significant but again with the opposite sign, when compared to the first sub period. That is again, an interesting observation that suggests that the sub-periods are indeed different, and correspond to
different outcomes in terms of firms‟ capital structures.
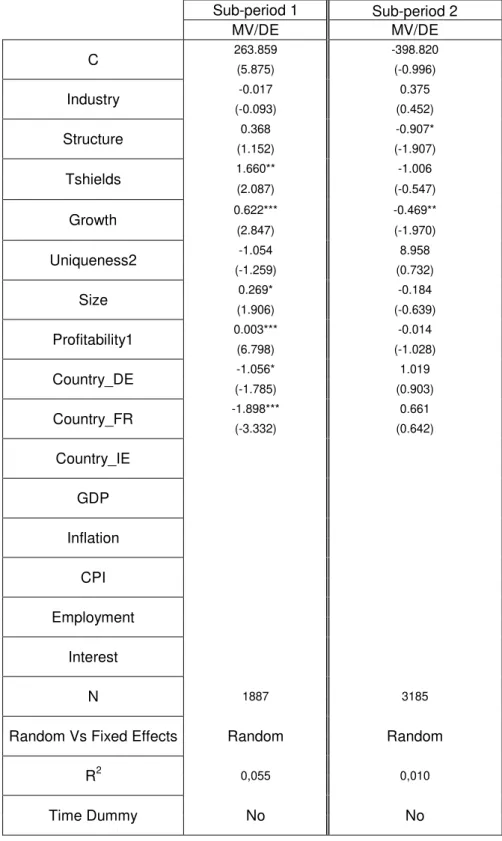
Observing the final model specification estimated in Table 12 we conclude that during the period 2003-2007 the variables growth and profitability 1 are statistically significant together with all macroeconomic factors, except for the interest rates. When moving to the analysis of the post-crisis period, the company size is the only
- 29 -
- 30 -
Conclusions
This dissertation is devoted to theme related to how distinct companies choose their capital structure and in what manner firm and country factors influence this corporate decision. Another pertinent point addressed in this work is associated with the relevance of the financial crisis in the capital structure adopted by firms (during different periods in time).
Throughout the analysis of the previous empirical research I found evidence that those companies follow different funding strategies according to their purposes and beliefs, either relying on the Trade-off Theory, the Pecking order theory, the Market Timing theory or others. When resorting to other research papers concerning the capital structure theme it is also observable that there exists a number of firm factors that directly affect the capital structure choice of a firm, which in some cases reinforce the results achieved in this thesis. Uniqueness (i.e., the presence of intangible assets) and size were some of the firms‟ features that emerged as being relevant to the choice of capital structure when I analysed previous literature that also proved to be meaningful in the outcomes extracted from the analysis of the impact of firm and country factors in the capital structure choice in section 4.1.1. Besides this variable, the industry in which a firm operates is also shown to be significant in this analysis. Apart from these firms‟ characteristics, the results obtained in the analysis of the influence of firm and macroeconomic variables on the leverage choice – in section 4.2.1- show us that the companies‟ asset structure and the non-debt tax shield are statically significant as well as the uniqueness and size, already mentioned above.
- 31 -
dissertation also emphasized the fact that there are country-specific factors and macroeconomic variables that may influence, directly or indirectly, the companies‟ decisions concerning leverage, since not all countries have the same macroeconomic environment. The main conclusion withdrawn from previous literature, regarding capital structure choices around the world, matches the results obtained in this dissertation – different companies native from distinct countries tend to choose dissimilar structure for their capital – which revealed that the fact that the company in analysis is German, French or Irish has a statistical influence when choosing their debt-to-equity value, comparing to Portuguese companies. Furthermore, some macroeconomic factors, namely GDP, Inflation, CPI and Employment, proved to be worthy of attention, since firms tend to choose divergent forms of capital structure according to the environment that their country offers.
The other purpose established for this master thesis was to identify if the beginning of the financial crisis carried with it changes in the weight of the firm and country factors which companies use to ponder their ideal capital structure. By the examination of the results achieved along the work it is apparent that the crisis implemented a few changes in the significance and impact of the different variables in the explanation of the leverage ratio. The most evident ones were in the macro economic variables, since after the crisis all of the macro variables used in this study became statistically significant (see Table 12). This empirical result probably reflects the intuitive idea that the early signs of a crisis are reproduced in the
- 32 -
Beyond the changes reported in the last paragraph, the results also reflected some
changes in few firms‟ features. The size of the companies turned to be one of the most statistically significant variables to the analysis, during the period of crisis, most likely because companies that record more enhanced sales values are also more solid companies, therefore have higher capacity to ask for debt in controversial times. Structure of the assets showed a growing relevance after the international financial crisissince companies with more collaterals are more susceptible to secure external funding, primarily with hard economic conditions. On the contrary the growth achieved by a company became not so relevant for the study.
- 33 -
References
Books and Published Journal Articles
BAKER, M. and WURGLER, J. (2002) Market Timing and Capital Structure. The Journal of Finance. Vol. LVII, Nº1 (February). p. 1-32;
BERK, J and DEMARZO, Peter, 2013. “Corporate Finance”, 3rd Ed. Pearson; BOWMAN, J. (1980) The Importance of a Market-Value Measurement of Debt in Assessing Leverage. Journal of Accounting Research. Vol. 18, Nº1. p. 242-254; Donaldson, G. (1961) Corporate Debt Capacity: A Study of Corporate Debt Policy and Determination of Corporate Debt Capacity. Boston Division of Research,
Harvard School of Business Administration. Beard Books;
FAMA, E. and FRENCH, K. (2002) Testing Trade-Off and Pecking Order Predictions about Dividends and Debt. The Review of Financial Studies. Vol. 15, Nº1. p. 1-33;
HENNESSY, C. A. and WHITED, T. M. (2005) Debt Dynamics. The Journal of Finance. Vol. LX, Nº3 (June). p. 1129-1165;
HOVAKIMIAN, A., et al (2001) The Debt Equity Choice. Journal of Financial and Quantitative Analysis. Vol. 36,Nº1 (March). p.1-24 ;
JENSEN, M. and MECKLING, W. (1976) Theory of the Firm: Managerial Behaviour, Agency Costs and Ownership Structure. Journal of Financial and Economics. Vol. 3, Nº4. p.305-360
JENSEN, M. (1986) Agency Costs of Free Cash Flow, Corporate Finance, and Takeovers. American Economic Review. Vol. 76, Nº 2. p.323-329.
- 34 -
LEARY, R. and ROBERTS, M. R. (2005) Do Firms Rebalance Their Capital Structure. The Journal of Finance. Vol. LX, Nº6. p.2575-2619 (December);
MILLER, M. (1977) Debt and Taxes. The Journal of Finance. Vol. XXXIII, Nº2 (May). p. 261-275;
MOGDILIANI, F and MILLER, M. (1958) The Cost of Capital Corporation Finance and the Theory of Investment. American Economic Review. Vol. 48, Nº2 (June).p. 261-297;
MYERS, S. C. (2001) Capital Structure. Journal of Economic Perspectives. Vol. 15, Nº2. p. 81-102;
MYERS, S. C. (1984) The Capital Structure Puzzle. The Journal of Finance. Vol. XXXIX, Nº3 (July). p.574-592;
MYERS, S. C. and MAJLUF, N. S. (1984) Corporate Financing and Investment Decisions When Firms Have Information That Investors Do Not Have. Journal of Financial Economics. Vol. 13, Nº2. p. 187-221;
OPLER, T. and TITMAN, S. (1994) Financial Corporate Distress and Corporate Performance. Journal of Finance. Vol. XLIX, Nº 3. p. 1015-1040;
TITMAN, S. and WESSELS, R. (1988) The Determinants of Capital Structure Choice. The Journal of Finance. Vol. XLIII, Nº1 (March). p.1-19;
WELCH, I. (2004) Capital Structure and Stock Returns. Journal of Political Economy. Vol. 112, Nº1. p. 106-131;
ZWIEBEL, J. (1996) Dynamic Capital Structure under Managerial Entrenchment.
The American Economic Review. Vol. 86, Nº5 (December). p. 1197-1215.
Digital support
- 35 -
Eviews Illustrated for version 8 – [On-line], February 2013 – Available: <URL: https://www.eviews.com/illustrated/Eviews_Illustrated.pdf>
- 36 -
Table 1 - Summary of variables and results used in Titman and Wessels’
Research paper
.
Variables
Relation with the Dependent
Variable7
Statistical
Significance
Asset Structure
Almost Null (Market Values)/Negative (Book Values)
No
Non-Debt Tax
Shield
Negative No
Firm´s Growth
Negative (Market Values)/Positive (Book values)
No
Industry/Sector Negative No
Uniqueness Negative Yes
Company’s Size Negative Yes
Profitability Negative
Yes (Market Values)/No (Book
Values)
Volatility of the
Earnings
Negative No
7
- 37 -
Table 2 - Definition of Variables
Variables Definition
MV_DE
Ratio between book value of debt and market value of equity.
BV_DE
Ratio between book value of debt and book value of equity
Net_DE
Ratio between book value of net debt (debt minus cash & cash equivalents) and market value of equity.
Structure
Ratio between book value of intangible assets and the book value of total assets.
TShields
Non-Debt Tax Shields computed as the ratio between book value of depreciations & amortizations and total assets.
Growth
Variation in percentage of the total assets‟
value.
Uniqueness2
Ratio between the market value and book value of equity.
Industry
Dummy-variable for industry classification. For companies with industry‟s code between 1000 and 3320 has the value 1, and
otherwise has 0 as value.
Country_DE
Dummy-variable with value 1 for German companies, 0 otherwise.
- 38 -
companies, 0 otherwise.
Country_IE
Dummy-variable with value 1 for Irish companies, 0 otherwise.
Country_PT
Dummy-variable with value 1 for Portuguese companies, 0 otherwise.
Size Logarithm of total sales.
Profitability1 Ratio between EBIT and total sales.
GDP
Annual percentage growth of the GDP in each country.
Inflation Annual inflation rate in each country.
CPI
Consumer Price Index, which measure fluctuations in the price level of a market basket of consumer goods and services acquired by families.
Employment Annual Employment rate in each country.
- 39 -
Table 3 - Summary Statistics
This table presents the descriptive statistics of all variables used in the study – dependent variables, firm-specific and country-specific variables. The sample period is
from 2003 to 2012.
Mean Median Standard Deviation Maximum Minimum Number of
Observations
MV_DE 1,155 0,348 5,957 389,205 0,000 6040,000
BV_DE 1,033 0,406 11,355 702,385 -48,949 8465,000
Net_DE 0,484 0,061 5,616 335,511 -131,143 6500,000
Structure 0,156 0,067 0,456 36,722 -0,016 9875,000
Tshields 0,058 0,032 0,739 64,508 -0,093 9151,000
Growth 0,024 0,382 0,648 1,000 -36,233 8694,000
Uniqueness2 0,048 0,001 1,277 44,348 -0,046 6873,000
Industry 0,211 0 0,408 1,000 0,000 12390,000
Size 4,670 4,672 1,092 7,886 -1,569 9032,000
Profitability1 -7,229 0,057 528,204 806,391 -49290,667 9013,000
Country_DE 0,487 0,000 0,500 1,000 0,000 12390,000
Country_FR 0,450 0,000 0,497 1,000 0,000 12390,000
Country_IE 0,045 0,000 0,208 1,000 0,000 12390,000
Country_PT 0,018 0,000 0,132 1,000 0,000 12390,000
GDP 1,245 -5,145 2,377 6,080 -6,384 11151,000
Inflation 1,722 1,736 0,889 4,880 -4,480 11151,000
CPI 104,465 106,101 5,044 116,076 95,507 12390,000
Employment 56,500 51,900 2,283 60,700 50,600 11151,000
- 40 -
Table 4 - Correlations Matrix
This table reports the correlation between explanatory variables (firm and country-specific variables and macro variables).
MV_DE BV_DE NET_DE INDUSTRY STRUCTURE TSHIELDS GROWTH UNIQUENESS2 PROFITABILITY1 SIZE COUNTRY_DE COUNTRY_FR
COUNTRY_
IR GDP INFLATION CPI EMPLOYMENT INTEREST MV_DE 1,000 0,000 0,989 0,062 -0,018 -0,008 -0,014 -0,008 0,002 0,262 0,113 -0,109 0,001 - -0,019 0,009 - 0,074 -0,026
BV_DE 0,000 1,000 0,000 -0,007 0,020 -0,006 -0,003 0,357 0,001 0,006 -0,015 0,010 0,006 - 0,017 0,001 -0,001 0,012
NET_DE 0,989 0,000 1,000 0,056 -0,015 -0,007 -0,009 -0,007 0,002 0,235 0,098 -0,095 0,001 -0,014 0,012 - 0,061 -0,019
INDUSTRY 0,062 -0,007 0,056 1,000 -0,160 0,026 -0,006 -0,012 -0,008 0,077 0,075 -0,087 0,004 0,003 0,006 - 0,073 -0,001
STRUCTURE -0,018 0,020 -0,015 -0,160 1,000 0,128 0,022 -0,027 0,010 0,109 -0,108 0,109 0,031 - -0,005 0,067 -0,063 0,002
TSHIELDS -0,008 -0,006 -0,007 0,026 0,128 1,000 -0,317 0,004 -0,007 0,061 - 0,057 -0,061 0,009 - 0,007 0,011 0,051 -0,023
GROWTH -0,014 -0,003 -0,009 -0,006 0,022 -0,317 1,000 0,006 0,046 0,081 -0,031 0,033 0,119 0,056 0,093 - -0,062 0,060
UNIQUENESS2 -0,008 0,357 -0,007 -0,012 -0,027 0,004 0,006 1,000 -0,003 0,080 - 0,013 -0,016 0,012 0,016 0,014 0,027 -0,013
PROFITABILITY1 0,002 0,001 0,002 -0,008 0,010 -0,007 0,046 -0,003 1,000 0,085 -0,015 0,015 0,013 - -0,004 0,018 - -0,025 0,023
SIZE 0,262 0,006 0,235 0,077 0,109 -0,061 0,081 -0,080 0,085 1,000 0,056 -0,045 0,029 0,022 0,013 - 0,031 -0,025
COUNTRY_DE 0,113 -0,015 0,098 0,075 -0,108 0,057 -0,031 0,013 -0,015 0,056 1,000 -0,957 0,103 -0,017 0,036 0,752 -0,275
COUNTRY_FR -0,109 0,010 -0,095 -0,087 0,109 -0,061 0,033 -0,016 0,015 0,045 - -0,957 1,000 0,085 - -0,008 0,043 - -0,821 0,166
COUNTRY_IR
GDP -0,001 -0,006 0,001 0,004 -0,031 -0,009 0,119 0,012 -0,013 0,029 0,103 -0,085 1,000 0,529 0,150 - 0,053 0,026
INFLATION -0,019 0,017 -0,014 0,003 -0,005 0,007 0,056 0,016 -0,004 0,022 -0,017 -0,008 0,529 1,000 0,066 0,074 -0,001
CPI -0,009 0,001 -0,012 -0,006 0,067 0,011 -0,093 0,014 -0,018 0,013 - 0,036 -0,043 0,150 - 0,066 1,000 0,392 -0,528
EMPLOYMENT 0,074 -0,001 0,061 0,073 -0,063 0,051 -0,062 0,027 -0,025 0,031 0,752 -0,821 0,053 0,074 0,392 1,000 -0,378
- 41 -
Table 5 - Results for Country Specific Variables Effect on the Capital Structure
Choice
This table contains estimates, using three distinct specifications for the variable that measures the leverage‟ level
of firms, for the period 2003-2012. The table contains the estimated coefficients for each variable and the
t-statistics inside brackets.
MV/DE BV/DE NET/DE
C 3.123 1.389 2.371
(4.243) (1.869) (3.440)
Industry
Structure
Tshields
Growth
Uniqueness2
Size
Profitability1
Country_DE -0.781 0.480 -1.513***
(-1.317) (1.157) (-2.569)
Country_FR -1.879*** -0.274 -1.886***
(-3.532) (-1.203) (-3.517)
Country_IE -1.876*** -0.178 -1.882***
(-3.420) (-0.619) (-3.430)
GDP
Inflation
CPI
Employment
Interest
N 6040 8465 6500
Random Vs Fixed Effects Random Random Random
R2 0.008 0.001 0.002
- 42 -
Table 6 - Results for Firm and Country Effects in the Capital Structure Choice
(Without the firm variables: Size and Profitability1)
This table contains estimates, using three distinct specifications for the variable that measures the leverage‟ level
of firms, for the period 2003-2012. The table contains the estimated coefficients for each variable and the
t-statistics inside brackets.
MV/DE BV/DE NET/DE
C -167.949 -141.214 -39.478
(-1.805) (-1.017) (-0.472)
Industry -0.189 0.177 -0.495*
(-0.714) (0.346) (-1.781)
Structure -1.096 -1.046 -0.102
(-1.540) (-1.398) (-0.171)
Tshields 0.361 0.234 0.077
(0.705) (0.250) (0.214)
Growth -0.142 -0.170 -0.163
(-0.263) (-1.026) (-0.537)
Uniqueness2 -0.530** 9.345 -0.165
(-2.306) (0.748) (-1.282)
Size
Profitability1
Country_DE -0.873 0.027 -1.682***
(-1.460) (0.056) (-2.799)
Country_FR -1.949*** -0.187 -2.044***
(-3.595) (-0.501) (-3.648)
Country_IE -1.821*** -0.15 -1.954***
(-3.257) (-0.417) (-3.407)
GDP
Inflation
CPI
Employment
Interest
N
Random Vs Fixed Effects Random Random Random
R2 0,006 0,001 0,002
- 43 -
Table 7- Results for Firm and Country Effects in the Capital Structure Choice
(Without the country variable: Country_IE)
This table contains estimates, using three distinct specifications for the variable that measures the leverage‟ level
of firms, for the period 2003-2012. The table contains the estimated coefficients for each variable and the
t-statistics inside brackets.
MV/DE BV/DE NET/DE
C -163.359 -146.790 -33.896
(-1.738) (-1.033) (-0.409)
Industry -0.300 0.161 -0.585*
(-1.015) (0.294) (-1.876)
Structure 1.454 -1.073 -0.222
(-1.744) (-1.561) (-0.308)
Tshields 0.755 0.055 -0.076
(1.496) (0.047) (-0.165)
Growth -0.207 -0.156 -0.310
(-0.358) (-0.895) (-0.737)
Uniqueness2 -0.280 9.303 -0.084
(-2.445) (0.748) (-1.117)
Size 0.511*** -0.080 0.176
3.008 (-0.473) (1.020)
Profitability1 8.61E-05 -0.007 -0.002
0.116778 (-1.490) (-1.130)
Country_DE -0.865*** -0.010 -1.696***
(-1.371) (-0.022) (-2.740)
Country_FR -2.003*** -0.220 -2.095***
(-3.454) (-0.593) (-3.656)
Country_IE GDP Inflation CPI Employment Interest
N 5072 5072 5399
Random Vs Fixed Effects Random Random Random
R2 0,008 0,009 0,002
- 44 -
Table 8 - Results for the Effect of Macroeconomic Variables on the Capital
Structure Choice
This table contains estimates, using three distinct specifications for the variable that measures the leverage‟ level
of firms, for the period 2003-2012. The table contains the estimated coefficients for each variable and the
t-statistics inside brackets.
MV/DE BV/DE NET/DE MV/DE BV/DE NET/DE
C -6.313638 -2,583 -0.784 0.475 2.820 2.806
(-1.851) (-0.543) (-0.275) (0.137) (0.296) (0.951)
Industry Structure Tshields Growth Uniqueness2 Size Profitability1 Country_DE Country_FR Country_IE
GDP -0.058*** -0.033 -0.038*** -0.057*** -0.024 -0.037***
(-5.498) (-0.567) (-4.106) (-4.828) (-0.734) (-3.576)
Inflation -0.098*** -0.033 0.010 -0.067** -0.033 0.021
(-2.955) (-0.400) (0.342) (-2.008) (-0.659) (0.706)
CPI 0.015 -0.020 0.004 0.028** -0.011 0.010
(1.177) (-0.894) (0.390) (2.027) (-0.458) (0.799)
Employment 0.119** 0.115* 0.016 -0.031 -0.004 -0.059
(2.267) -1,893 (0.344) (-0.594) (-0.026) (-1.317)
Interest -0.082 -0.058 -0.021 -0.143 -0.103 -0.081
(-0.812) (-0.502) (-0.243) (-1.217) (-0.763) (-0.830)
N 5581 7822 6017 5581 7822 6017
Random Vs Fixed
Effects Random Random Random Fixed Fixed Fixed
R2 0,004 0,000 0,001 0,393 0,228 0,464