UNIDADE ACADÊMICA DE PESQUISA E PÓS-GRADUAÇÃO PROGRAMA DE PÓS-GRADUAÇÃO EM GEOLOGIA
NÍVEL MESTRADO
BRUNO MIGUEL VAZ DE CARVALHO
Confined Turbidite Sand-Sheets in the Paraná and Paganzo Basins.
BRUNO MIGUEL VAZ DE CARVALHO
Confined Turbidite Sand-Sheets in the Paraná and Paganzo Basins.
Dissertação de Mestrado apresentada como parte das exigências para a obtenção do título de Mestre, pelo Programa de Pós-Graduação em Geologia da Universidade do Vale do Rio dos Sinos (UNISINOS).
Área de Concentração: Geologia Sedimentar
Linha de Pesquisa: Estratigrafia e Evolução de Bacias
Orientador: Prof. Dr. Paulo Sérgio Gomes Paim Co-orientador: Prof. Dr. Benjamin C. Kneller
C331c Carvalho, Bruno Miguel Vaz de
Confined turbidite sand-sheets in the Paraná and Paganzo Basins / por Bruno Miguel Vaz de Carvalho. -- São Leopoldo, 2014.
95 f. : il. color. ; 30 cm.
Dissertação (mestrado) – Universidade do Vale do Rio dos Sinos, Programa de Pós-Graduação em Geologia, São Leopoldo, RS, 2014.
Área de concentração: Geologia Sedimentar.
Linha de Pesquisa: Estratigrafia e Evolução de Bacias. Orientação: Prof. Dr. Paulo Sérgio Gomes Paim, Escola Politécnica ; Coorientação: Prof. Dr. Benjamin C. Kneller, University of Aberdeen.
1.Sedimentos (Geologia). 2.Bacias (Geologia). 3.Geologia estratigráfica. 4.Geologia estrutural. I.Paim, Paulo Sérgio Gomes. II.Kneller, Benjamin C. III.Título.
CDU 551.3.051 551.7 551.243
Catalogação na publicação:
Bruno Miguel Vaz de Carvalho
Confined Turbidite Sand-Sheets in the Paraná and Paganzo Basins.
Disserrtação de Mestrado apresentada como parte das exigências para a obtenção do título de Mestre pelo programa de Pós-Graduação em Geologia da Universidade do Vale do Rio dos Sinos (UNISINOS).
Aprovada em ____/____/____.
BANCA EXAMINADORA
Prof. Dr. Claiton Marlon dos Santos Scherer (UFRGS)
LIST OF FIGURES
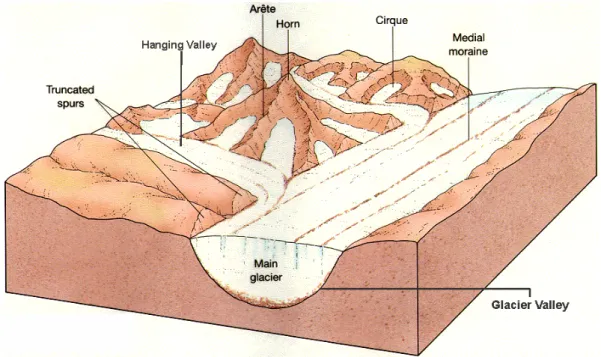
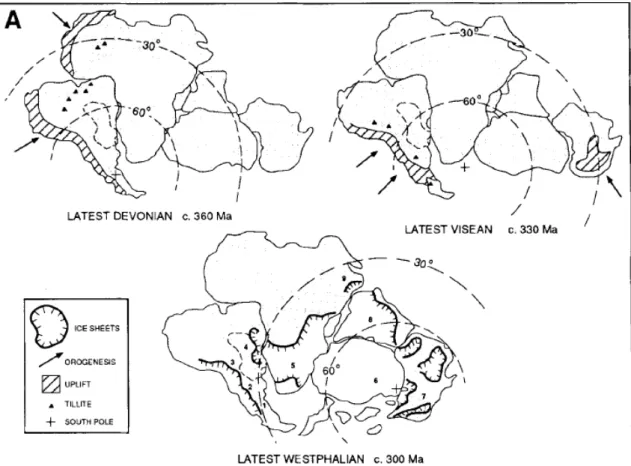
Figure 1.1 - Location map of the Quebrada de las Lajas (palaeofjord) and Quebrada Grande (palaeovalley)... 6 Figure 1.2 - Location map of the Vidal Ramos palaeovalley.. ... 6 Figure 2.1 - Glacial-valley and associated landscapes. Main glaciers carve the basement to create the main glacier-valley and adjacent hanging-valley (modified from Surachit, 2007)……… ... 9 Figure 2.2 - Mass balance in a valley-glacier (Embleton & King, 1975)... 10 Figure 2.3 - Paleogeographical maps of the Gondwana for the latest Devonian, latest Visean and latest Westphalian. Permo-carboniferous glaciated basins are numbered 1-9: 1) Argentina; 2) Paraguay; 3) Bolivia; 4) Paraná Basin; 5) Southern-African; 6) Antarctica; 7) Australia; 9) Indian S C; 9) Arabian P. (modified from Veevers& Powell, 1987)………. ... 11 Figure 2.4 - Diagram representing a schematic subdivision of a turbidite current.. ... 13 Figure 2.5 - Turbidite acceleration graph, representing the type of deposits according to the type of temporal and spatial acceleration (Kneller, 1995)…………... ... 14 Figure 2.6 - Types of turbidite deposits based on the type of flow acceleration (Kneller, 1995). ... 14 Figure 2.7 - Depositional model for the infill of a confined turbidite basin at the flow
stripping stage (modified from Sinclair and Tomasso 2002)...1 Figure 2.8 - Classification of sand body terminations after (a) McCaffrey & Kneller
Figure 2.17 - Geological provinces (left) and one example (right) of the Paraná Basin basement rock.. ... 29 Figure 2.18 - Depositional sequences and lithostratigraphy of the Paraná Basin (Milani, 1993).. ... 30 Figure 2.19 - Stratigraphic correlation of the Itararé Group, with depositional sequences (Weinscthuz and Castro, 2004) ... 31 Figure 2.20 - Subsurface stratigraphy and associated lithological column of the Itararé Group according to Franca &Potter, 1988... 31 Figure 2.21 - General sedimentary log of Vidal Ramos. ... 34
ARTICLE
Figure 14 - The sedimentary succession that fills the QLL palaeofjord changes laterally due to the pinchout of the sandstone beds (a) whereas is relatively easy to follow along the fjord axis (b).. ... 58 Figure 15 - Quebrada Grande geological map. Stage III and IV palaeocurrent readings represented in rose diagrams.. ... 60 Figure 16 - General log illustrative of the Quebrada Grande palaeovalley fill... ... 61 Figure 17 - Quebrada Grande cross-section and associated logs (vertical numbered
lines). ... 62 Figure 18 - Geological map and vertical section of Vidal Ramos... 63 Figure 19 - Sedimentary log of the lowermost interval (Mafra Formation) that fills the Vidal Ramos palaeovalley.... ... 65 Figure 20 - Vidal Ramos geological cross-section derived from the correlation of several sedimentary logs acquired in the southern sector of the area. ... 67 Figure 21 - Mafra Shale with dropstones. Notice its sharp contact with the overlying R1 Stage... ... 68 Figure 22 - (A) Transition from R1 to T1 stages and (B) sharp contact between Mafra Shale and R1 Stage.. ... 68 Figure 23 - Dropstone in the middle portion of R2 stage. ... 69 Figure 24 - (a) closely-spaced and overlapping, elongated flute casts and (b) bottom irregularities (loading and injection) at the base of Stage III turbidites... ... 71 Figure 25 - Mud to sand ratio at Quebrada de las Lajas. Notice the sudden drop of mud just above at 150 m above the base ... 72 Figure 26 - Sandstone of the lower portion of Ts1 composed of biotite, muscovite and quartz. No to very low permeability is suggested by the lack of the impregnating blue resin... ... 73 Figure 27 - (a) and (b) Well preserved groove cast at the base of Ts2 sandstone; and (c) impression of lepidodendron within Ts1 unit sandstone... ... 74 Figure 28 - Thin-section of the upper portion of Ts1 unit. A higher permeability and porosity relative to the lower part of this interval is apparent and at least partially a result of the dissolution of calcite veins... ... 74 Figure 29 - Fossils found at QG Ts2 sandstones, (a) large and abundant trunk impressions at the base of Ts2 sandstones, (b) Microbial induced sedimentary structures (MISS) at the base of Ts2 sandstone bed. ... 76 Figure 30 - Soft-sediment deformation (injections), a common feature of the Ts3. ... 78 Figure 31 - Thick sandstones at the mid portion of the T1 Stage.. ... 79 Figure 32 - Fine-grained sandstone composed of muscovite, biotite and quartz grains
with no pores within them (T1
stage)…………...80
Figure 34 - Well defined T2 stage beds due to presence of thin mud caps near the confining southern wall.. ... 81 Figure 35 - T2 stage sandstone. Note its coarser-grained nature and higher permeability relative to previous stages as well as the presence of K-feldspar... ... 82 Figure 36 - Aerial view and location of the sedimentary logs at the Quebrada de Las Lajas palaeofjord. Logs 54, QL6, QL2 and QL3 are located near the palaeofjord axis whereas logs QL5 and QL4 are closer of the palaeofjord walls... ... 83
LIST OF TABLES
Table 1 - It presents the parameters that define glacial valleys morphology. Note the wide range of depth to width ratios (Fr
1
INDEX
ACKNOWLEDGMENTS 2
ABSTRACT 3
CHAPTER 1 – INTRODUCTION 4
· 1.1.Geographic location 5
· 1.2.Methodology 7
· 1.3.Objectives 8
CHAPTER 2 - CONCEPTUAL REVIEW AND GEOLOGICAL SETTING
· 2.1.Glacier-valleys 9
· 2.2.Glaciation and turbidity currents 11
· 2.3.Turbidites onlap 17
· 2.4.Paganzo Basin 19
· 2.5.Paraná Basin 27
CHAPTER 3 – RESULTS, DISCUSSION AND CONCLUSION 35
3.1. Article 36
2
ACKNOWLEDGMENTS
To BG Brasil, that sponsored this project, and believed in our ideas.
ANP (Angencia Nacional de Petroleos) for its commitment to investment in research
and development.
My family which helped me from the beginning to the end of this project, no matter the
circumstances.
Prof Paim, without his orientation and excellent scientific vision this work wouldn’t be
possible, and for his time with us in Brazil and Argentina field work..
Prof Kneller, for his great ideas and which contributed to the work strongly and for his
time with us in the Brazil and Argentina field work.
Prof Milana, for opening the doors for the researched areas in Argentina, and his helpful
comments in my final work.
My dear colleagues, which proportionated me new experiences and strengthen me for
the future challenges.
Carla Puigdomenech and Fabiano Rodrigues, my dear colleagues and field partners,
couldn´t imagine a better experience without you.
My dear field assistants Daniel Oyarzabal, Henrique Frasson and Ilana Lehn, for their
time, knowledge and friendship, always willing to help no matter what.
To everyone involved with the project, Professors at Unisinos and University of
Aberdeen, ITT Fossil Lab, Unisinos petrographic lab, for making this final piece of
3
ABSTRACT
During the Late Paleozoic, Gondwana was home for a protracted glaciation that
generated high sediment supplies and ample accommodation space within incised
valleys and fjords, usually laterally confined and longitudinally extensive
geomorphological features. These glacial valleys became so overdeepened below sea
level that they filled up with hundreds of meters of seawater, as glacio-eustatic sea level
rose during and following deglaciation, therefore producing deep-water environments
prone to gravity-flows such as turbidity currents. This study assesses the behavior and
morphology of sand sheets deposited by turbidity currents that instead of flowing
outward onto an unconfined basin floor, were confined within a limited space up to a
spill point. This study compare three examples of turbidite sand sheet deposited on
settings presenting distinct degree of confinement, including two areas in the Paganzo
Basin (Paganzo Group) and one area in in the roughly coeval Paraná Basin (Itararé
Group) The Argentinean case studies are located in the eastern Precordillera of the
Andes, near San Juan city, and include a palaeofjord (Quebrada de Las Lajas) and a
more open valley (Quebrada Grande), both incised into Early Paleozoic shelf carbonates
(San Juan Formation) and olistostrome (Rinconada Formation). The Brazilian
counterpart is located inVidal Ramos (Santa Catarina State, Southern Brazil) and it is a
very wide palaeovalley carved into Proterozoic schists and secondly marbles. After a
general description and interpretation of the valleys fills and a more detailed description
and interpretationof the associated turbidite sand sheets, their similarities and
differences are stressed to define which features ewere dependent or independent of the
4 1. INTRODUCTION
Deglacial marine sedimentary sequences record the melting retreat of glaciers. Along
the Late Palaeozoic, glaciation affected Gondwana over 100 million years,
and glaciogenic deposits can be found in all present day continents formerly assembled
in the Gondwanaland (Crowell, 1983).
Fjords (long, narrow inlets with steep sides or cliffs) and valleys can provide especially
detailed records of environmental changes associated with deglaciation due to the large
amount of accommodation space available within these glacial, overdeepened features.
Their typical high deposition rates provide a high-resolution record (e.g. Eyles et al.,
1997; Kneller et al., 2004). These local basins are overdeepened during glacial
excavation, and commonly left under hundreds of meters of seawater following glacial
retreat and relative sea level rise (e.g. Powell and Molnia, 1989; Eyles et al.,
1990; DaSilva et al., 1997; Benn and Evans, 1998). Also, high sedimentation rates
during and following deglaciation can emplace hundreds of meters of stratigraphy in
relatively short time spans (hundreds to thousands of years), therefore enhancing
resolution of their sedimentary records (e.g., Cowan et al., 1988; Powell and Molnia,
1989; Eyles et al., 1990; Lysa et al., 2004).
Deposition tends to respond to seasonal cycles, as snowmelt, rainy seasons or seasonal
thawing of a valley glacier (Dykstra et al., 2007). Spring or summer melts periods can
be responsible for the greatest sediment pulses. Sediment failures may also contribute
significantly to sediment gravity flows in these confined settings. Commonly produced
from delta-fronts, usually related to Gilbert-type deltas, or rock fall off the steep fjord
walls, they can evolve into turbidity currents upon entrainment of ambient water and
flow for very long distances down to local basins (Prior et al., 1987; Benn and Evans,
5
At last, it is worth to notice that Gondwana glacial deposits are important hydrocarbons
producers in Oman (Levell et al., 1988), Argentina and Bolivia, and are being actively
explored in Brazil, Saudi Arabia and Australia.
1.1Geographic Location
The data set was acquired in the well exposed Paganzo Basin and in the densely covered
Paraná Basin in order to use the first one as a possible analogue to interpret the second
one. As both study areas in the Paganzo Basin represent more (Quebrada de Las Lajas -
QLL) or less (Quebrada Grande - QG) confined depositional settings, the area that was
chosen in Brazil (Vidal Ramos - VR) was also supposed to represent some sort of
depositional confinement.
The Argentinean areas of the Paganzo Basin include a palaeofjord (QLL) and
a palaeovalley (QG), both located in the western sector of San Juan city (Fig1.1), which
were rapidly filled subsequently to the Pennsylvanian Gondwana glaciation (Dykstra,
2005). They show excellent exposures, minimal structural overprint, and a
three-dimensional view that allow a detailed observation of the evolution of their thick
turbidite fill.
On the other hand, the Brazilian counterpart comprises a previously
mentioned palaeovalley (Santos, 1996) situated near the south-eastern border of the
Paraná Basin in the Vidal Ramos (Santa Catarina State) surroundings (Fig1.2). Its rock
record is poorly exposed due to dense vegetation cover. A reliable representation of the
turbidite facies geometry, architecture and stratigraphy can only be assessed from scarce
6
Figure 1.2: Location map of the Vidal Ramos palaeovalley.
7 1.2. Methodology
Data collection included three month of field work in the Paganzo Basin and two
months and a half in the Paraná Basin. Field data was later processed in lab during a 2
year period. A geological map of each study area was produced in order to understand
and organize individual sedimentary successions.
The lack of topographic maps as well as the arid climate in the Paganzo Basin lead to
the use of satellite and aerial images, GPS marker-points and outcrop description to
produce the QLL and QG geological maps (1:10,000). Their incorporation
into ArcGis project has enabled later input of data acquired from laser-shots used to
locate unreachable points and delineate inaccessible stratigraphic surfaces. It is worth to
notice that the QG northern sector had been previously mapped (Kneller, 2004), so only
its southern sector, a 2km x 1km area mostly comprising gravity flow deposits, was
actually mapped.
In the Paraná Basin (VR), topographic-map, GPS points, laser-shots and outcrop
features were used to produce a larger-scale (1:100,000) geological map in an area
characterized by dense vegetation and usually largely weathered exposures.
Both in Argentina and Brazil, several sedimentary logs were acquired in strategic points
during the mapping to describe facies, facies association and later to define turbidite
stratigraphic architecture. To improve depositional elements characterization, the
analysis of photo-mosaic and 3D images (supported by laser-shooting) was performed
8
To demonstrate glacial movement and sediment transport paths within the confined
local basins, paleocurrent readings were taken from all mapped units, usually presented
as rose diagrams and / or mean vectors, and from the basal surface scoured into the
Precambrian basement. To better differentiate distinct turbidite intervals and to bring
into light some pieces of evidence related to source areas, some samples were taken to
petrographic analysis. A few, dark grey to black shales were sampled to TOC analysis.
1.3. Objectives
This MSc dissertation aims to describe and compare turbidite sand sheets deposited
during the Gondwana, late Palaeozoic de-glaciation on distinct, poorly- to
highly-confined depositional settings. To accomplish this main goal, three objectives were
pursued:
• To demonstrate the confined nature of the turbidite succession and to
quantify the degree of confinement of each area;
• To erect individual models of facies association, stratigraphic architecture
and overall geometry of turbidite strata in each area;
• To compare the turbidite systems taking into account their specific
geological settings.
As a result this work may also be useful for exploration and exploitation in the Paraná
Basin as well as in other comparable successions, including Brazilian offshore. Its
results may also be used for training of subsurface teams in deep-water systems using
9 2. CONCEPTUAL REVIEW AND GEOLOGICAL SETTING
2.1 Glacier-Valleys
A glacier corresponds to a mass of ice formed by the compaction and recrystallization
of the precipitated snow that moves downslope by the action of gravity. According to
their occurrence, glaciers can be subdivided into valleys-glaciers and
continental-glaciers (Miller, 1996).
Valley-glaciers, also known as alpine-glaciers, have a dendritic drainage (Miller, 1996),
and are formed by the drift of ice accumulated at high altitudes through snow
precipitation (fig 2.1).
The shape of the valley changes as the glacier moves downhill. A V-shaped valley is
deepened and widened, and therefore transformed into a U-shaped valley through the
glacial erosion processes of plucking and abrasion, creating perfectly confined setting.
10 Figure 2.2: Mass balance in a valley-glacier (Embleton & King, 1975)
The mass balance profile (fig 2.2) and the valley geometry combine to set the pattern of
glacial modification of the valley.
The interplay of the dynamic properties of the eroding glacier and the mass strength of
the subglacial bedrock control the valley morphology. When the pattern of ice discharge
reaches its maximum at the equilibrium line altitude (ELA), the pattern of erosion ought
to mimic this trend (Anderson et al., 2006). The longer it stays in the ELA, the deeper
the glacier-valley tends to be (Sugden and John, 1976). Another major control on valley
morphology is the bedrock strength as there is a strong positive correlation between
rock mass strength and Fr number (Fr = D/2w), where D is the valley depth and w is the
valleys half width. This correlation suggests a trend toward narrower, steeper-sided
valleys being developed on bedrock of high mass strength. An increase in the Fr number
implies on narrower valley.
11
Glaciers covered most of Gondwana during the Carboniferous and Permian, leaving in
the rock record clues of a second major ice age in the Phanerozoic, i.e. the Karoo ice
age (360-260 Ma). The Panthalassa Ocean and the Paleotethys Sea influenced a
progressive cooling of the summer, and higher rates of snow accumulation in winter,
causing alpine glaciers to form and spread out to form continental glaciers (Berner,
1999; Beerling and Berner, 2000; Fig.2.3).
Glaciers displacement and deposition are well recorded in the Paganzo and Paraná
basins, usually as striation on basement rock surfaces due to moving ice, an extensive
process that can form fjords and valleys due over-deepening by glacial scour. Such
depressions are commonly left under hundreds of meters of water following glacial
12
retreat and relative sea level rise (Powell and Molnia, 1989;Eyles et al.,
1990; DaSilva et al., 1997; Benn and Evans, 1998; Dykstra et al. 2007).
Though postglacial rebound can remove a great portion of the accommodation space,
these incised valleys are commonly so over-deepened that most of the valley remains
below sea level, where sedimentary preservation is usually high (Kneller et al., 2004;
Dykstra et al., 2007).
Sediments in this deep fjord and valleys are largely made up of turbidites: they
generally consist of sediments eroded from land surface, transported by rivers to the
shoreline, and ressedimented into deeper water by turbidity currents (surge-type).
Besides, during glaciation turbidity flows were also favoured by seasonal cyclic
changes. Spring/summer warmer temperatures can spur melting periods, producing
important sediment pulses of very cold and dense, sediment laden, usually hyperpycnal,
and sustained flows into confined settings (Prior et al., 1987; Benn and Evans, 1998;
Kneller et al., 2004; Dykstra, 2005).
Ancient sandy turbidites tend to be deeply buried and compacted, and form an
important class of hydrocarbon reservoirs (Weimeir & Slatt, 2007) or a host rock for a
particular type of gold deposit (Keppie et al., 1987). The structure of the turbidity
currents can be differentiated into a frontal region (head) that is followed by the body
(Fig. 2.4). The motion of the fluid behind the head can be approximated with the
modified formula of the Chezy equation for flow in open channels, using reduced
gravity (Middleton, 1993), and it is slope-dependent. Thus, the buoyance flux (Turner,
1973) into the head increases with increasing slope, with a concomitant effect on
mixing. Finite-volume releases (surge-type currents) may be dominated by the
13
The deposits of turbidity current mostly depend of the behaviour of the particles in
terms of spacial and temporal acceleration within the flow (Fig. 2.5). Accepting that
when both accelerations are zero, the fluid and particles will be moving in a constant
flow, if it has a substantive acceleration the particles will not fall from flow suspension
(bypass/erosion). When the fluid starts decelerating, it will eventually reach a
suspension threshold forcing the sediment to fall-out (Bouma, 1962).
The acceleration of a turbidite can be subdivided into five possible types of flow,
differentiated by the type of acceleration (Fig. 2.6).
• Waxing/Depletive flow: it presents a positive temporal acceleration
(waxing) and negative spatial acceleration (depletive) flow. At a specific
point the flow becomes faster with time whereas it is slower downstream.
At that specific point the grain size material falling from suspension from
the flow tends to become larger with time as the current velocity increases,
producing inverse graded beds. Eventually, if the flow velocity becomes too
high, it will maintain all the sediment in suspension (bypass/erosion).
14 Figure 2.5: Turbidite acceleration graph, representing the type of deposits
according to the type of temporal and special acceleration (Kneller, 1995).
15 • Steady/Depletive flow: it shows no variation in temporal acceleration
(steady), as the flow has a constant velocity, although the negative spacial
acceleration (due confinement) allows particles to decelerate and deposit.
This flow tends to deposit sediments from flow suspension so rapidly that
produce massive ungraded beds with occasional incorporation of mudclasts
at a specific point and finer material downstream.
• Waning/Depletive flow: it displays negative flow acceleration in which both
temporal (waning) and spatial (depletive) accelerations are negative. As the
flow decelerates it produces graded beds. At an upstream position the
sediments will be coarser-grained and the beds thicker, at a downstream
position grains will be finer-grained and bed thinner. The higher negative
acceleration, the harder will be to produce traction structures.
• Waning/Accumulative flow: it shows a positive spatial acceleration
(accumulative) that will give rise to changes in the bed shear stress, but due
the waning properties it will generate a graded bed. Altogether the flow will
produce a well-sorted graded bed, commonly with flute marks/cast.
In many cases, the development of turbidite systems has been moderately to strongly
controlled by pre-existing bounding slopes (Lomas and Joseph, 2004). Van Andel &
Komar (1969) used the term ponding to refer to a situation in which turbidity currents of
sufficiently large volume are fully contained by an area of subdue bathymetry.
Similarly, Pickering & Hiscott (1985) used the expression “contained turbidites” to
describe beds deposited from turbidity currents that were confined within a basin too
small to allow sustained unidirectional flow. These terms describe situations in which
16
surmount the bounding sloped which bound that depositional area. Closely associated
with the concept of confined deposition are the notions of flow reflection and deflection
and fill-and-spill common features related to turbidity currents confinement, (Pickering
and Hiscott, 1985) that can also include:
• presence of thick siltstone/mudstone caps overlying or interbedded
with sandstone beds;
• complex multidirectional paleocurrent directions;
• dominance of thick beds;
• complex grading patterns;
• soft-sediment-deformation;
• onlap of sheet-like beds onto confining-basement.
The upper part of confined sedimentary successions tends to present an increase in the
sand-to-mud ratio due to flow stripping (Fig 2.7), i.e. the denser, sand-rich flow travels
along the basin floor eroding and depositing amalgamated sandstones, while the
finer-grained material stays in suspension, therefore escaping from confinement (Sinclair
and Tomasso, 2002).
17 2.3 Turbidites Onlap
The development of stratigraphic traps, a key feature of many hydrocarbon reservoirs, is
favoured at the margin of confined turbidites sheet systems (sensu Haughton, 1994a).
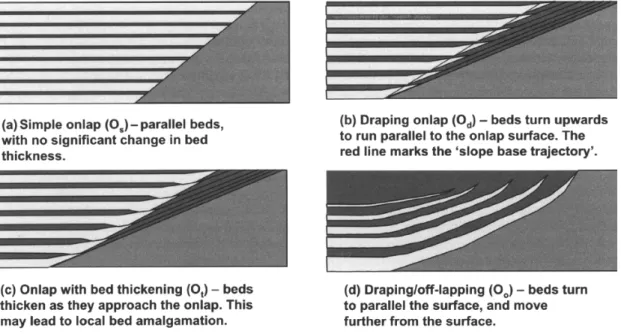
According to McCaffrey & Kneller (2001) there are two main types of pinch out (types
A and B). In the first case (Type A), turbidites thin onto the confining surface –
although the final sandstone pinch-out is commonly abrupt – and individual beds tend
not to erode into earlier deposits. In type B, turbidite sandstones commonly thicken
toward the confining slope, and bed may incise into earlier deposits. These two types
may occur in combination, so producing a wide spectrum of pinch out characteristics
(fig. 2.8).
Sandbody pinchout occur in a range of depositional environments and can take a variety
of forms (Fig. 2.9). In the case of glacial-valley, individual beds may preserve their
thickness, but usually as they approach the onlap surface sandbody thickness tends to
decrease. (Gardiner, 2006). In some cases, as sand beds thin at the onlap surface, they
continue up the surface for some distance (McCaffrey & Kneller, 2006; Smith &
Joseph, 2004), often with a thickness of only a few cm (Fig. 2.9 b, d).
18
2.4. The Paganzo Basin
Western Argentina is an area of recent and constant deformation resultant from the
convergence of the Nazca and South American plate, reflected in modern GPS velocity
data and constant seismicity in the region, including large-magnitude, catastrophic
seismic events (Brooks et al., 2003; Costa and Finzi, 1996; Perucca and Paredes, 2003;
Ramos et al., 2002; Siame et al., 2002). Recent uplift and arid climate favour excellent
rock exposure in the Paganzo Basin, one of the largest (140,000 Km2) upper Palaeozoic
depositional areas documented along the western margin of Gondwana (Saltify
and Gorustovich, 1983; López Gamundí at al., 1994). The Paganzo Basin is bounded to
the east by the Sierras-Pampeanas cratonic area and to the west by an orogenic belt
composed of thrusted and folded, Lower Palaeozoic and Lower Carboniferous units
(Limarino et al., 2002).
19
This pericratonic basin received glacial-derived sediments during and just after the Late
Carboniferous glaciation of Gondwana (Kneller et al., 2004; Eyeles et al., 1995). It lied
close to the active western margin of the supercontinent near paleolatitude 60ºS (Fig
2.3). Its tectonic setting has been ascribed either to a retro-arc foreland basin (Ramos,
1998) or to a strike-slip basin (Fernández Seveso & Tankard, 1995). Paganzo Basin was
isolated from a coeval, open marine basin to the west (Calingasta-Uspallata and Rio
Blanco basins) by one or more coastal ranges (e.g. Salfity & Gorustovich, 1983)
uplifted in the Devonian and geographically roughly equivalent to the
modern Precordillera (Fig. 2.10).
Postglacial, early-Namurian to Westphalian transgressive strata have been identified in
several localities (Limarino et al., 2002). In the western and central domains of
the Precordillera, transgression is recorded by open marine facies and transitional fjord
type environments (López Gamundí, 1987). The Precordillera represents the transition
between open marine environments (western domain) and thin flooding facies typical of
the Sierra Pampeanas (eastern domain). This transgression is well exposed in at least
five localities: Huaco, Rio Francia, San Juan River Valley, Guandacol (Sierra de Maz),
20
The palaeovalleys situated along the western Precordillera were apparently connected to
the open ocean during the Carboniferous transgression, which is recorded in the lower
portion of the Jejenes Formation and characterized by gravity-flow deposits and shales
with marine fossils (López Gamundí, 1983, 1989), spores and monosacate pollens,
subordinated Namurian acritarchs and marine microfossils represented by abundant
21
These palaeovalleys also show clear evidence of glacial erosion, with well-preserved
striations and basal glacial pavements (Milana and Bercowski, 1990, 1993;
López-Gamundí and Martínez, 2000; Kneller et al., 2004; Dykstra et al., 2007).
The Quebrada de Las Lajas, situated near San Juan, in the western Argentina (Fig. 1.1),
represents one of these palaeovalleys and comprises one of the study areas. This modern
valley exhumes a deeply incised, Mississippian palaeofjord developed on the eastern
side of the Andean proto-Precordillera. Carved during the Gondwana glaciation, cutting
over 1000 m down into Lower Palaeozoic shelf carbonates of the San Juan Formation
(Kneller et al., 2004; Dykstra, 2005; Dykstra et al., 2007), it was later filled with
a siliciclastic succession known as the Jejenes Formation.
Fjord basement was probably already dipping steeply by the Carboniferous. It was
deformed during a Devonian accretion event and incorporated into a mountain range at
the time (Beresi and Bordonaro, 1985). The unconformity between the San Juan
and Jejenes formations displays a geometry that is similar to the modern glacial-valleys
(Fig. 2.11), i.e. U-shaped with steeply dipping walls (60º-70º) that extend more than
1,000m above the valley floor (Dykstra, 2005; Dykstra et al., 2007; Fig. 2.10).
b)
a)
22
Abundant fossil and palynological evidence demonstrates that marine transgression
progressed up into the inner mountains valleys such as the Quebrada de Las Lajas
(Martinez, 1991; Césari and Berkowski, 1997; Lech et al., 1998; Limarino et al.,
2002; Pazos, 2002; Kneller et al., 2004; Dykstra et al., 2007).
The QLL palaeofjord is now oriented to SW-NE and contains Pennsylvanian
clastic strata preserved over about 5 km along the valley with total thickness close to
297 m. Its width varies from ~200 m at its head up to 1 km at its mouth (Fig. 2.12). The
thickness of marine deposits is greater than the magnitude of a eustatic sea-level rise,
suggesting a significant over-deepening of the palaeofjord below sea level by glacial
erosion prior to glacial collapse and flooding (Dykstra et al., 2006). Several sills are
present in the base of the palaeofjord and at least three hanging valleys with
Carboniferous fill are present along its margins (Dykstra et al., 2007).
According to Dykstra (2006) the sedimentary succession that fills the QLL palaeofjord
can be subdivided into four main evolutionary stages (Fig 2.12) represented by
distinct facies associations:
• Stage I, an ice-contact facies association related to subaqueous outwash and
subaqueous fans, and deep lacustrine strata including a channel levee system and
23 • Stage II, a postglacial, marine transgressive succession including basal, chaotic
MTDs and associated ponded channels, few slope channels (channel bodies
incised into black shales), and coherent, slide-sheet-dominated MTDs.
24 • Stage III, which encompasses sheet-like, sandy turbidites (the main target of this
dissertation).
• Stage IV, coarse grained, delta sheet sandstones and conglomerates and
abundant, small-scale MTDs.
The Quebrada Grande (QG) is situated 13 km to the south of QLL and about 25 Km
from San Juan, on the eastern margin of the Zonda range, in the foothills of the
eastern Precordillera in western Argentina (Fig 2.13). The area lies on the foreland side
of a Quaternary back-thrusting zone (the Eastern Precordillera), with practically no
structural complications. Like the QLL, it also exposes the filling of a palaeovalley and
comprises the second study area of the Paganzo Basin.
The succession (Jejenes Formation) exposed in the Quebrada Grande dips (35º-40º to
ESE) transversely to the roughly NNE-SSW oriented valley axis (Fig. 2.12). The
Quebrada Grande area is extensively dissected by modern valleys and creeks, providing
superb sections through parts of the palaeovalley fill (Fig. 2.12). The local subcrop to
the Carboniferous deposits consists of Ordovician platform limestones of the San Juan
Formation (Berese and Bordonaro, 1985), stratigraphically overlain to the east by an
Ordovician-Silurian olistostrome (Rinconada Formation; Amos, 1954; Peralta, 1990;
Peralta et al., 1994) composed of highly deformed, Ordovician-Silurian siliciclastic
turbidites and olistholiths of the San Juan Formation (Kneller et al., 2004). Both lower
Palaeozoic units and their boundary dip very steeply to the east. The Carboniferous
Jejenes Formation crops out as a ~1km wide strip that is unconformably overlain to the
25
The valley-fill was subdivided by Kneller (2004) into five stages (Figs. 2.14; 2.15):
· Stage I: Glacial deposits comprising massive, stratified diamictites and
matrix-supported conglomerates;
· Stage II: Shallow-marine strata represented by water-laid sandstone,
including shallow-water delta facies;
· Stage III: Proglacial, deep-water deposits, including gravel-rich
submarine fans and dropstone-bearing basin-floor mudstones with few,
thin-bedded turbidites and two mega-beds (Kneller, 2004; Rodrigues, in prep);
· Stage IV: Confined turbidite sand sheets (the focus of this thesis);
· Stage V: Mass flow deposits and turbidite-channelized complexes
associated with the development of Gilbert-type deltas.
C on fin ed T ur bid ite S an d-Sh ee ts in th e P ar an á a nd P ag an zo B as in s 2 6
27
2.5. Paraná Basin
The Paraná Basin (Fig. 2.16), named after the Paraná River (Eyles et al., 1993) and one
of the largest intracratonic basin of South America, is situated in the central-eastern part
of the continent (Barberena et al., 1991). It is present from the Mato Grosso do Sul to
the Rio Grande do Sul state, in Brazil, and also in eastern Paraguay, Argentina and
northern Uruguay. The shape of the depression is elliptical and covers about 1,500,000
km2 (Souza et al., 2007; Milani et al., 2007), with 2/3 of its surface covered by
Mesozoic basaltic lavas of the Serra Geral Formation (Melo, 1988; Zalán et al., 1991;
Souza et al., 2007).
28
The eastern flank of the Paraná Basin corresponds to a crustal region deeply affected by
the South Atlantic rifting and drift developed on continental crust of the
former Gondwana supercontinent (Milani and Zalán, 1999). The Precambrian basement
that underlies the volcano-sedimentary succession is complex and highly structured
(Fig. 2.16). It consists of cratonic nuclei bounded by upper Proterozoic thrust and fold
belts composed of metasedimentary and metavolcanic rocks intruded by granites
(Eyles & Eyles, 1993; Fig 2.17).
29
The stratigraphy of the Paraná Basin comprises a total thickness over 6 km and consists
essentially of six sequences (Milani, 1993) ranging from Ordovician to Late Cretaceous
(Fig 2.18) that record distinct episodes of tectonic subsidence and sediment preservation
within the basin.
The stratigraphic interval directly related to this thesis is the Gondwana I, a Late
Carboniferous to Early Triassic Sequence that includes the glaciogenic Itararé Group.
Together with similar deposits of the Carnarvon Basin (Lyons Group, 2500m thick) in
Western Australia (Veevers & Powell, 1987), the Itararé Group holds one of the thickest
accumulations of late Palaeozoic, glacially-influenced strata. It reaches up to 1300 m in
thickness (França & Potter, 1988) in the central-western portion of the basin and
comprises three lithostratigraphic units (Milani, 1997, 2005; Bartoreli, 2005; Marques
30
and Ernesto, 2005): the Campo do Tenente, Mafra and Rio do Sul formations
(Schneider et al., 1974), roughly equivalent to the subsurface-based units proposed by
França (1987) and França & Potter (1988, 1991), namely the Lagoa Azul, Campo
Mourão and Taciba formations, respectively (Fig. 2.18). Despite of the data source,
each formation comprises a lower, coarser-grained (sandstone to conglomerate) and an
upper, diamictite-dominated unit (Fig. 2.19).
31
Although the oldest Itararé strata record glacial-lacustrine or brackish water settings, an
increasingly marine influence can be identified upwards through the Itararé Group
(Eyles et al., 1993). Fully marine conditions are recorded in the overlying deltaic
deposits related to the top of Taciba Formation (Puigdomenech, 2013).
The Itararé Group is poorly constrained relative to other Gondwana glacial successions
and there is no firm ground, as yet, for establishing the Carboniferous-Permian
boundary within the Paraná Basin (Rocha-Campos and Rösler, 1978). Preliminary
findings using revised scheme suggest that the Itararé Group ranges from the
Figure 2.19: Stratigraphic correlation of the Itararé Group, with depositional sequences (Weinscthuz and Castro, 2004)
32
latest Westphalian to Early Kungurian, so it is essentially Permian (Daemon, 1991). The
late start of the glaciation in the Paraná Basin compared to adjacent basins in Bolivia,
Argentina and Paraguay may simple reflect a different tectonic regime in southern
Brazil: glacial strata only began to accumulate in the Paraná Basin after 300 Ma with
the onset of tectonic subsidence (Eyles et al., 1993). A long period of glacial erosion in
the basin would explain both the lack of depositional record and the existence of
glacially carved valleys. At this time, the major glacial influence on sedimentation in
southern Brazil was from the Kaokoveld area of southern Africa, such glaciers coming
from southwest Africa and reaching the westernmost portions of the Paraná Basin
(Barbosa, 1940; Gesicki et al., 2001). Glacial abrasion features carved onto
Precambrian basement rocks (Barbosa, 1940; Carvalho, 1940; Dequech, 1948; Canuto,
1993) are common and indicate a north-north-westward sense of ice movement.
Besides, intraformational striated surfaces scoured on sandstone and diamictites were
found in Cachoeira do Sul, Pinheiro Machado (Tomazelli and Soliani, 1982) and
Suspiro (Tomazelli and Soliani, 1997), as well as in other areas of the south of Brazil
and São Paulo (Caetano-Chang et al., 1990). More recently, a striated surface developed
on glacial deposits of the Aquidabán Formation, which is comparable to
the Itararé Group, was found in the village of Escobar, Eastern Paraguay
(Riccomini and Velázquez, 1999). In the Santa Catarina state, iceberg scours, dump
structures, striations as well as debris left by grounded icebergs on rhythmites, probably
generated during the last, early Permian deglaciation episode of the Paraná Basin, were
also described (Canuto, 1991; Santos et al., 1992). The orientation of
the subglacial abrasion features ranges from NW to NNE, but it is dominantly oriented
to NNW, revealing that the southeastern terrains of the Paraná Basin where the main
33
The study area in Brazil represents a relatively wide paleovalley exposed in the Vidal
Ramos (VR) county, central portion of the Santa Catarina State (Fig. 1.2). It is poorly
exposed due to extensive and dense vegetation cover, and deep weathering. There is
almost no structural complication, apart from the diabase intrusive rocks
(Serra Geral Formation) that locally dislocate the strata from their original position. The
local subcrop to the Permian-carboniferous package consists of Pre-Cambrian gneiss,
marble and meta-sedimentary rocks that were originally carved by glaciers producing a
striated surface that displays evidence of north-northwestward (345º) sense of ice
movement. The palaeovalley has an average width of 12 km and walls that dip 10º to
15º. Its fill includes a thin succession of the Mafra Formation, that crop out along
a~2km wide strip. Once the palaeovalley was filled (Mafra Formation), deposition of
the Rio do Sul formation took place in a non-confined setting including deep marine to
35
CHAPTER 3 – RESULTS, DISCUSSION AND CONCLUSION
This chapter presents most of the results, their discussion and the conclusions of the
dissertation, It is organized as paper submitted to the Journal of South American Earth
Sciences. Therefore, although minimized as much as possible, some duplication in
terms of objectives, methodology, scientific background and geological setting were
unavoidable. But in general the paper presents the results, discussion and conclusions
and the previous chapter discuss further subjects that are important in terms of a
dissertation, but to long to be included in a paper. Below, the confirmation of the
36
THE ROLE OF CONFINEMENT ON TURBIDITE SAND-SHEET
DEVELOPMENT: A COMPARISON OF THREE CASE STUDIES
FROM PAGANZO AND PARANÁ PALAEOVALLEYS
Bruno V. Carvalhoa, Paulo G. Paima, Carla N. Puigdomenecha, Benjamin Knellerb, Juan P. Milanab
a
Department of Geology Post-Graduation, Universidade do Vale do Rio Sinos, CP 275, CEP 93022-000, São Leopoldo, Brazil
b Department of Geology and Petroleum Geology, University of Aberdeen, Aberdeen AB24 3UE, UK
ABSTRACT
During the Late Paleozoic, Gondwana was home for a protracted glaciation responsible
for high rates of sediment supply and generation of accommodation space within
laterally confined, longitudinally extensive glacial valleys and fjords. These features
became so overdeepened below sea level that they filled up with hundreds of meters of
seawater, as glacio-eustatic sea level rose during glaciation and early deglaciation.
Deep-water environments and high sediment supply thus favored gravity-flows,
including large-scale mass transport, debris flows and turbidity currents. This study
assesses the morphological setting, sedimentology and architecture of the sand sheets
deposited by turbidity currents that instead of flowing onto an unconfined basin floor
were confined within glacial palaeotopography. In this context, this paper describes and
compares three turbidite systems deposited into settings presenting different degrees of
confinement. The main aim was to identify some sort of signature on turbidite strata that
could be correlated to their confined depositional settings. This study was based on
three outcrop case studies, two in Argentina (Paganzo basin) and one in Brazil (Paraná
basin). The Argentinean areas, located in the eastern Andean Precordillera, near San
Juan city, comprise a palaeofjord (Las Lajas) and a more open valley system (Quebrada
Grande), both incised into Early Paleozoic shelf carbonates (San Juan Formation) and
37
Paraná basin is situated around Vidal Ramos where basement depressions produced by
glacial carving into upper Proterozoic schists (secondly marbles) were firstly filled with
deep marine shales and turbidites. Long mapping and logging field seasons in all areas,
with the help of laser range finders, to delineate surfaces in inaccessible sites, and 3D
photomosaics, to interpret facies geometry, comprised the adopted approach in terms of
data acquisition. From mapping and logging, the extent of confinement (morphological
models) was characterized and conceptual models integrating sequence stratigraphy,
sedimentology and valley morphology were proposed. The deglacial sedimentary fill of
glacial palaeovalleys, in special the associated turbidite sand sheets, includes features
both independent and dependent of the confinement extent. The independent features
occurs in all studied sites and include high frequency climate changes controlling
vertical facies successions, turbidity currents flowing mostly along the valley axis
following a unidirectional trend and an assumed association with fjord- or valley-head
deltas prograding into relatively steep valley floor, hence favouring recurrent sand
remobilization from delta front to deep marine settings as turbidity, depletive surges. On
the other hand, the higher is the confinement, more complex are paleocurrent trend and
facies association due to current rebound of the flows and more common large-scale
remobilization near the confining walls. Besides, facies succession suggest that the
larger the confinement, the higher the possibility of the existence of effective
longitudinal barriers trapping mud in more proximal depositional settings.
Key words: Confined turbidites; turbidite sand sheet; deglacial strata; Paraná basin;
Paganzo basin; Gondwana glacial record.
38
Deglacial marine sedimentary sequences record the melting retreat of glaciers. Along
the Late Palaeozoic, glaciation that affected Gondwana over one hundred million years,
glaciogenic deposits can be found in all present day continents formerly assembled in
the Gondwanaland (Crowell, 1983).
Fjords (long, narrow inlets with steep sides or cliffs) and valleys can provide especially
detailed records of environmental changes associated with deglaciation due to the large
amount of accommodation space available within these glacial, overdeepened features.
Their typical high deposition rates provide a high-resolution record (e.g. Eyles et al.,
1997; Kneller et al., 2004). These local basins were overdeepened during glacial
excavation, and commonly left under hundreds of meters of seawater following glacial
retreat and relative sea level rise (e.g. Powell and Molnia, 1989; Eyles et al.,
1990; DaSilva et al., 1997; Benn and Evans, 1998). Also, high sedimentation rates
during and following deglaciation can emplace hundreds of meters of stratigraphy in
relatively short time spans (hundreds to thousands of years), therefore enhancing
resolution of their sedimentary records (e.g., Cowan et al., 1988; Powell and Molnia,
1989; Eyles et al., 1990; Lysa et al., 2004).
Deposition tends to respond to seasonal cycles, as snowmelt, rainy seasons or seasonal
thawing of a valley glacier (Dykstra et al., 2007). Spring or summer melts periods can
be responsible for the greatest sediment pulses. Sediment failures may also contribute
significantly accumulations in these confined settings. Commonly produced from
delta-fronts, usually related to Gilbert-type deltas, or rock fall off the steep fjord walls, most
gravity flows can evolve into turbidity currents upon entrainment of ambient water and
flow for very long distances down to local basins (Prior et al., 1987; Benn and Evans,
39
Besides, most of the early conceptual and experimental models of turbidity systems
have pictured essentially unconfined, radial lobes and fan-shape depositional bodies
(Lomas & Joseph, 2004). However, Andel & Komar (1969) proposed the term ponding
to describe turbidity currents fully contained by an area of enclosed bathymetry and
unable to surmount the bounding slopes. Lomas & Joseph (2004) suggested the use of a
more general term (confinement) to describe all cases where sediment gravity flows and
their deposits are strongly affected by the presence of significant basin floor
topography, not necessarily implying in an entire containment. Closely associated with
this concept (confinement) is the idea of flow reflection and deflection, usually deduced
from reversals on paleocurrent indicators assumed as a border effect (e.g. Pickering &
Hiscott, 1985; Kneller et al. 1991). Onlap relationship with steeper surfaces is also an
indicative of confinement. Moreover, the recognition of stratal onlap against a confining
frontal slope is understood as a diagnostic feature of the fill of a true silled sub-basin. In
terms of confined settings, the most frequent causes include large-scale structural
features, slope collapse masses, halokinesis, mud diapirism and differential compaction
(Lomas & Joseph 2004).
Within this context, this paper aims to describe and to compare three roughly coeval
deglacial turbidite sand sheets deposited in a broad range of confined valleys carved by
glaciers. The idea is to test the possible influence of different degree of confinement on
turbidite facies, facies association, succession and geometry, pattern of stratal onlap,
sand connectivity and sand-to-mud ratio as well as to compare the deglacial record of
two large South American basins (Paraná and Paganzo).
40
This study took place in two correlative basins (Parana and Paganzo basins). The
Paganzo basin is a pericratonic basin that received glacial-derived sediments during and
just after the Late Carboniferous glaciation of Gondwana (Salfity and Gorustovich,
1983; Fernandez Seveso and Tankard, 1995; Kneller et al., 2004; Eyeles et al., 1995). It
was formed close to the active western margin of the supercontinent
near paleolatitude 60ºS. An area of recent and constant deformation resultant from the
convergence of the Nazca and South American plate, reflected in modern GPS velocity
data and constant seismicity in the region, including large-magnitude, catastrophic
seismic events (Brooks et al., 2003; Costa and Finzi, 1996; Perucca and Paredes, 2003;
Ramos et al., 2002; Siame et al., 2002). Recent uplift and arid climate favour excellent
rock exposure in the Paganzo Basin, one of the largest (140,000 Km2) upper Palaeozoic
depositional areas documented along the western margin of Gondwana (Saltify
and Gorustovich, 1983; López Gamundí at al., 1994). The Precordillera was apparently
connected to the open ocean during the Carboniferous transgression, which is recorded
in the lower portion of Jejenes and correlative Formations and characterized by
gravity-flow deposits and shales with marine fossils (López Gamundí, 1983, 1989).
The Paraná basin, one of the largest intracratonic basins of South America, is situated in
the central-eastern part of the continent. It is present from the Mato Grosso do Sul to the
Rio Grande do Sul state, in Brazil, and also in eastern Paraguay, Argentina and northern
Uruguay (Milani and Zalán, 2003). The shape of the depression is elliptical and covers
about 1,500,000 km2 (Souza et al., 2007; Milani et al., 2007), with 2/3 of its surface
covered by Mesozoic basaltic lavas of the Serra Geral Formation (Melo, 1988; Zalán et
al., 1991; Souza et al., 2007). The stratigraphic interval directly related to this work is
the Gondwana I, a Late Carboniferous to Early Triassic Megasequence that includes
41
The data set comes from the well exposed Paganzo Basin and the densely covered
Paraná Basin in order to use the first as a possible analogue to the second one. As both
study areas in the Paganzo Basin represent highly (Quebrada de Las Lajas - QLL) to
moderately (Quebrada Grande - QG) confined depositional settings, the area chosen in
Brazil (Vidal Ramos - VR) was also supposed to represent some sort of depositional
confinement. The Argentinean areas include a narrow palaeofjord (QLL) and a
palaeovalley (QG), both located in the western sector of San Juan city (Fig. 1), which
were rapidly filled subsequently to Pennsylvanian Gondwana glaciation (Dykstra,
2005). They show excellent exposures, minimal structural overprint, and
three-dimensional view that allow a detailed observation of the evolution of their thick
turbidite fill. On the other hand, the Brazilian counterpart comprises a previously
mentioned palaeovalley (Santos, 1996) situated near the south-eastern border of the
Paraná Basin in the Vidal Ramos (Santa Catarina State) surroundings (Fig 2). Its
geological record is poorly exposed due to a dense plant cover. Therefore, a
representation of the turbidite facies geometry, architecture and stratigraphy can only be
42
Figure 2: Location of the Vidal Ramos area (black dot) in the Santa Catarina State (red region) and geological map of the studied area.
43 3. METHODS
Data collection was taken from the Paganzo and Paraná basins and later processed in
lab. A geological map of each study area was produced in order to understand and
organize individual sedimentary successions.
The lack of detailed topographic maps as well as the arid climate in the Paganzo Basin
lead to the use of satellite and aerial images, GPS marker-points and outcrop description
to produce the QLL and QG geological maps (1:10,000). Their incorporation
into ArcGis project has enabled later input of data acquired from laser-shots used to
locate unreachable points and delineate inaccessible stratigraphic surfaces.
In the Paraná Basin (VR), topographic-map, GPS points, laser-shots and outcrop
features were used to produce a larger-scale (1:100,000) geological map in an area
characterized by dense vegetation and usually largely weathered.
Both in Argentina and Brazil, several sedimentary logs were measured in strategic
points during the mapping to describe facies and facies succession and later to define
turbidite stratigraphic architecture. To improve depositional elements characterization,
the analysis of photo-mosaic and 3D images (supported by laser-shooting) analysis was
performed in both QLL and QG.
To demonstrate the interplay between-confinement shape and sediment transport paths
within these confined local basins, paleocurrent readings were taken from all mapped
units, usually presented as rose diagrams and / or mean vectors, and from the basal
surface scoured by ice into Precambrian basement rocks. To better differentiate distinct
turbidite intervals and to bring into light some pieces of evidence related to source
areas, some samples were taken to petrographic analysis. A few, dark grey to black
44
4. CONCEPTUAL BACKGROUD
The interplay of the dynamic properties of the eroding glacier and the mass strength of
the subglacial bedrock control glacial valley morphology. When ice discharge reaches
its maximum at the equilibrium line altitude (ELA), the pattern of erosion ought to
mimic this trend (Anderson et al., 2006), depending on bedrock strength as there is a
strong positive correlation between rock mass strength and Fr number (Fr = D/2w),
where D is the valley depth and w is the valleys half width (Sugden and John, 1976).
For the interpretation of the turbidite sand-sheets its was used the concept in which the
motion of the fluid behind the turbidite head can be approached with the modified
formula of the Chezy equation for flow in open channels, using reduced gravity
(Middleton, 1993), and it is slope-dependent. Thus, the buoyance flux (Turner, 1973)
into the head increases with increasing slope, with a concomitant effect on mixing.
Finite-volume releases (surge-type currents) may be dominated by the properties of the
head in contrast to sustained underflows (Hacker et al., 1996). The deposits of turbidity
current mostly depend of the behaviour of the particles in terms of spacial and temporal
acceleration within the flow. Accepting that when both accelerations are zero, the fluid
and particles will be moving in a constant flow, if it has a substantive acceleration the
particles will not fall from flow suspension (bypass/erosion). When the fluid starts
decelerating, it will eventually reach a suspension threshold forcing the sediment to
fall-out (Bouma, 1962).
4.1. Confinement
In many cases, the development of turbidite systems is moderately to strongly modified
by pre-existing bounding slopes (Lomas and Joseph, 2004). Van Andel &
45
sufficiently large volume are fully contained in an area of subdue bathymetry. Similarly,
Pickering & Hiscott (1985) used the expression “contained turbidites” to describe beds
deposited from turbidity currents that were confined within a basin too small to allow
sustained unidirectional flow. These terms describe situations in which gravity flow
sediments fill the floor of an enclosed depression and are unable to surmount the
bounding sloped which bound that depositional area. Closely associated with the
concept of confined deposition are the notions of flow reflection and deflection and
fill-and-spill. According to Pickering and Hiscott (1985) some common features related to
turbidity currents confinement include (1) the presence of thick siltstone/mudstone caps
overlying or interbedded with sandstone beds; (2) complex multidirectional
palaeocurrent directions; (3) dominance of thick beds; (4) complex grading patterns; (5)
soft-sediment-deformation; and (6) onlap of sheet-like beds onto confining-basement.
The upper part of confined sedimentary successions tends to present an increase in the
sand-to-mud ratio due to flow stripping (Fig. 3), i.e. the denser, sand-rich flow travels
along the basin floor eroding and depositing amalgamated sandstones, while the
finer-grained material stays in suspension, therefore escaping from confinement (Sinclair
and Tomasso, 2002).
46 4.2. Onlap
The development of stratigraphic traps, a key feature of many hydrocarbon reservoirs, is
favoured at the margin of confined turbidites sheet systems (sensu Haughton, 1994a).
According to McCaffrey & Kneller (2001) there are two main types of pinch out (types
A and B). In the first case (Type A), turbidites thin onto the confining surface –
although the final sandstone pinch-out is commonly abrupt – and individual beds tend
not to erode into earlier deposits. In type B, turbidite sandstones commonly thicken
toward the confining slope, and bed may incise into earlier deposits. These two types
may occur in combination, so producing a wide spectrum of pinch out characteristics
(Fig. 4).
Sandbody pinchout occur in a range of depositional environments and can take a variety
of forms. In the case of glacial-valley, individual beds may preserve their thickness, but
usually as they approach the onlap surface sandbody thickness tends to decrease.
(Gardiner, 2006). In some cases, as sand beds thin at the onlap surface, they continue up
the surface for some distance (McCaffrey & Kneller, 2006; Smith & Joseph, 2004),
often with a thickness of only a few cm.
47 5. RESULTS
The results were firstly based on the description of the fjord/valley morphology.
Acknowledging the shape of each glacial valley, their fill was described, with emphasis
on the turbidite sand sheets. Turbidite sand-sheets were interpreted in terms of the main
transport (long- and short-distance) and depositional mechanisms as well as in terms of
temporal and spatial acceleration of the turbidity currents and the type of lateral onlap in
each studied area. At last, possible relationships between valley morphology and
sedimentary fill were then endeavored.
However, before describing their morphology, it is important to highlight why they are
treated as glacial-carved features. First of all, the general glacial setting of the Jejenes
Formation in the Paganzo Basin and the Mafra and Rio do Sul formations in the Paraná
Basin is a well-known aspect for a long time (e.g. Schneider et al. 1974; Eyles et al
1985; Canuto 1993; Eyles and França, 1993; Limarino 1987; Milana and Bercowski
1993; Limarino et al 2002). In terms of the specific areas of study the Vidal Ramos
palaeovalley was previously ascribed to glacial carving by Santos (1996) whereas a
palaeofjord setting for the succession exposed in the Quebradas Grande and Las Lajas
was presented by Kneller et al (2004) and Dykstra et al. (2006, 2007). Besides, the
Vidal Ramos palaeovalley presents glacial striations (Fig. 5a) on the basement rocks
(Santos 1996) above which the glacio-marine deposits rest (Mafra Formation). The
Quebrada de Las Lajas palaeofjord is an entirely exhumed and exposed feature that is
elongate, narrow and bounded by almost vertical walls whose initial record includes
glacio-lacustrine mudstones with dropstones (Dykstra, 2007). At last, the Quebrada
Grande palaeovalley, although not wholly exposed as the Las Lajas palaeofjord, also
comprises an elongate and narrow feature, confined by a steep and high wall at least to
48 Fig.5. Feature associated with the glacial nature of the studied palaeovalleys, glacial striation at the base of the Vidal Ramos palaeovalley fill (a), iceberg-related scour features in the Quebrada Grande palaeovalley fill (b).
5.1. Glacial Valley Morphology
Three glacial valleys are here presented. They range from a very narrow and deep
palaeofjord (QLL) through a moderately narrow and deep palaeovalley (QG) to a much
broader and shallower palaeovalley (VR). All of them include deep marine turbidite
successions. The QLL palaeovalley presents the higher depth to width ratio (Fr number
= 0.55) whereas the VR one shows the lowest Fr value (0.006). Although the QG
palaeovalley presents an intermediate ratio, it is much closer to the QLL Fr number
(Tab. 1). This range of valley configuration, and their relative differences, are better
seen the figure 6, which display a typical cross-section of each example, from the