Master Thesis in Geospatial Technology
WETLAND HABITAT STUDIES USING VARIOUS CLASSIFICATION
TECHNIQUES ON MULTI-SPECTRAL LANDSAT IMAGERY
Case study: Tram chim National Park, Dong Thap Vietnam
Master thesis supervised by
Dr. Carlos Granell Canut
ABSTRACT
Wetland is one of the most valuable ecological systems in nature. Wetland habitat is a set of comprehensive information of wetland distribution, wetland habitat types are essential to wetland management programs. Maps of wetland should provide sufficient detail, retain an appropriate scale and be useful for further mapping and inventory work (Queensland wetland framework).
Remotely sensed image classification techniques are useful to detect vegetation patterns and species combination in the inaccessible regions. Automated classification procedures are conducted to save the time of the research.
The purpose of the research was to develop a hierarchical classification approach that effectively integrate ancillary information into the classification process and combines ISODATA (iterative self-organizing data analysis techniques algorithm) clustering, Maximum likelihood and rule-based classifier. The main goal was to find out the best possible combination or sequence of classifiers for typically classifying wetland habitat types yields higher accuracy than the existing classified wetland map from Landsat ETM data. Three classification schemes were introduced to delineate the wetland habitat types in the idea of comparison among the methods. The results showed the low accuracy of different classification schemes revealing the fact that image classification is still on the way toward a fine proper procedure to get high accuracy result with limited effort to make the investigation on sites. Even though the motivation of the research was to apply an appropriate procedure with acceptable accuracy of classified map image, the results did not achieve a higher accuracy on knowledge-based classification method as it was expected. The possible reasons are the limitation of the image resolution, the ground truth data requirements, and the difficulties of building the rules based on the spectral characteristics of the objects which contain high mix of spectral similarities.
Dedication
ACKNOWLEGEMENT
The Master study was financially supported by Erasmus Mundus programme and implemented in the Department of language and informatics system – UJI, in collaboration with IFGI, Institute of geographical informatics, Germany and ISEGI, Institute of Statistics and Information Management, Portugal.
I would like to express my gratitude to Ms. Rita Szettele, project manager of the Erasmus Mundus program.
My heart-felt thanks are also to my thesis supervisor Dr.
Carlos Granell
Canut
, Department of language and informatics system, UJI, the two co-supervisors: Prof. Joaquin Huerta (UJI) and Dr. Prinz Torsten, for providing me comments and suggestions during the Master course.I also wish to express my sincere gratitude to professors and lecturers of this course who gave me their useful knowledge and technical assistance, my colleagues in the Remote sensing centre for their great help in providing me the image data as well as the technical assistance, and the Center for Global Change for making available the Landsat datasets used in this study.
I am very grateful to thank all my classmates of M.Sc. course Geospatial Technology who shared their knowledge and experience with me during my research.
LIST OF CONTENTS
1. INTRODUCTION ...1
1.1 Background ... 1
1.1.1. Wetland definition and the need for wetland delineation ... 1
1.1.2. Image classification of wetland habitat ... 2
1.2 Problem definition... 2
1.3 Objectives... 3
1.4 Research questions ... 4
1.5 Outline of the thesis ... 4
2. LITERATURE REVIEW...6
2.1 Use of Landsat imagery in detecting wetland ... 6
2.2 Traditional Remote Sensing classification techniques applied in the wetland
studies... 7
2.2.1 Visual analysis. ... 7
2.2.2 Traditionally automatic classification. ... 8
2.3 Hybrid classification ... 8
2.4 Knowledge based classification techniques ... 10
3. RESEARCH METHODOLOGY ...13
3.1 Tram chim study area: location and characteristics ... 13
3.1.1 Topography... 14
3.1.2 Hydrology... 14
3.1.3 Landscape characteristics ... 14
3.2 Research design... 16
3.3 Data collection ... 17
3.3.1 Imagery... 17
3.3.2 Topographic map and additional data... 18
3.4 Data preparation ... 19
3.4.1 Classification scheme ... 19
3.4.2 Image preparation... 21
3.4.3 Calculation of Normalized Difference Vegetation Index (NDVI)... 22
3.5 Classification procedures ... 24
3.5.1 Unsupervised classification ... 24
3.5.2 Hybrid classification... 25
3.5.3 Knowledge based classification ... 28
3.5.3.1 Knowledge base establishment...28
3.5.3.2 Developing the rule base by expert classifier in Erdas Imagine...28
3.5.3.3 Apply the rule ...29
4. RESULT AND DISCUSSION...31
5. CONCLUSION AND FUTURE RESEARCH...37
5.1 Conclusion... 37
5.2 Future recommendation ... 38
LIST OF TABLES AND FIGURES
TABLES
Table 1. Landsat specifications 17
Table 2. Extracted Mekong lower basin wetland classification system 20
Table 3. Classes in the study area 21
Table 4. Accuracies of unsupervised classifications 32
Table 5. Accuracies of supervised classification 33
Table 6. Area and and proportion of thematic layers of wetland habitats relatively compared to the total area of Tram chim (from hybrid classification result) 33
FIGURES
Figure 1. Location of the study area 13
Figure 2. Seasonally inundated wetland types in Tram Chim Park 15
Figure 3. Work flow of the analysis of wetland habitat types in Tram chim National
Park 16
Figure 4. A set of “ground truth” points 18
Figure 5. The subset composite image of the study area 22
Figure 6. NDVI image 23
Figure 7. Classified image under unsupervised classification technique 25
Figure 8. Classified image with supervised classification technique 26
Figure 9. Visual comparison techniques 27
Figure 10. Rules built in the Expert Classifier in ERDAS Imagine 27
1. INTRODUCTION
1.1 Background
1.1.1. Wetland definition and the need for wetland delineation
Wetland definition depends on the professionals of the study. There are debates and controversy on wetland definition. The introduction to some widely used definitions would help the reader gain clear ideas on wetland representation and characteristics. In the US, one of the most widely accepted definition has been adopted by the US Fish and Wild life service:
Wetlands are lands transitional between terrestrial and aquatic systems where the water table is usually at or near the surface or the land is covered by shallow water... Wetlands must have one or more of the following three attributes: (1) at least periodically, the land supports predominantly hydrophytes, (2) the substrate is predominantly inundated hydric soil, and (3) the substrate is non-soil and is saturated with water or covered by shallow water at some time during the growing season of each year.
This definition emphasize on three main attributes of the wetland: hydrology, soil and water. Another broader definition was developed by Ramsar Convention:
Wetlands are “areas of marsh, fen, peat land, or water, whether natural or artificial, permanent or temporary, with water that is static or flowing, fresh, brackish, or salt, including areas of marine water the depth of which at low tide does not exceed 6 m.” (Ramsar Convention Bureau 2004). This definition recognizes other habitats such as open deep water, riparian lands, irrigated agricultural land and canals as components of the wetlands.
1.1.2. Image classification of wetland habitat
Within the scope of this study, image classification is defined as the extraction of differentiated classes or themes, wetland habitat categories from raw remotely sensed image data (Jensen 2005). To start the image classification process, the researcher work on steps which may include the determination of a suitable classification system, image processing, feature extraction, selection of suitable classification approaches, post-classification processing and accuracy assessment (Lu, D. 2007). A number of previous research on wetland delineation are specifically concerned with the image classification techniques. As reviewed by Ozesmin (2002), the remote sensing techniques used for wetland identification ranged from visual interpretation to computerized classification methods. Clustering techniques such as unsupervised, supervised, and hybrid classification approaches were mentioned as the most popular approaches. The approach of unsupervised classification bases on statistical inference in which the comparatively homogeneous pixels were counted, clustered and assigned by a type or a name in accordance with the human perception of surrounding nature or specific themes. The other approach is based on the texture of the pixel mosaic, i.e. the pattern of image structure.
The vegetation and spectral indices can be useful in visual interpretation of wetland boundaries or in a classification algorithms to map wetland types and other land cover types. Ancillary data if available is very useful to support the classification process and improve classification results. Many researchers have used ancillary data such as soils data (Bolstad and Lillesand, 1992b, Sader et al. 1995), topographic data (Bolstad and Lillesand, 1992), and forest inventory maps (Gluck et al. 1996). The approach that incorporates and exploit the relationship the ancillary data in the classification procedures is called knowledge-based classification. The method is becoming increasingly attractive in the practical studies. However, the input ancillary data with acceptable format and data quality remains the problem for researchers, especially for those who choose the study areas in developing countries. In most case, the visual interpretation knowledge or the influence of human knowledge on the image manipulation makes contribution to the success of image classification.
1.2 Problem definition
Rehabilitating the wetland species are common to what are facing today in lowland and forest systems. Wetland habitat types is the important information in conservation plan for landscape management. Landscape studies and practices would have been of great help to integrate watershed management, restoration of local hydrologic conditions as a basis for rehabilitation of soils and manage the flooding and humidity conditions in order to successful replanting of wetland species, as well as developing forest systems as the basis for sustainable use of the wetland forests.
Tram Chim national park is one of the important wetland sites in ecological management policy. As the area is recognized officially as wetland national park, the domain inside the dykes boundary are wetlands. The question now are what the wetland types are and how they are distributed within the park. Wetland delineation types are classified based on the purpose and some criteria. In one hand, the system meet the need of separating the land types due to the landscape regime and the geographical features of the region. On the other hand, it must be in accordance with the image resource and ability, computational resource. It is not yet perfectly understood or decisive whether image grey values can produce standardised indicators of wetland habitat types.
As the cost for one sq km of multispectral or high resolution images to be at least a square function of geometric resolution, it is necessary to find out a sufficient and reasonable automated segmentation algorithms. In this context, Landsat 7 ETM+ was used for the investigation of wetland types. The main part of the investigation concentrated on a combination of pixel-based multispectral classification and a knowledge based classification in reference to the available information of the study area.
1.3 Objectives
Reason to classify the wetland habitat types: in wetland ecosystem management and landscape characterization, there are number of information needs due to the variety of problem to be solved. The examples traditional problem in wetland management are characterised by research on finding the wetland feature size and type; wetland exposure and risk characteristics; conditions of a site and facilities or resources; records of management activities; maps; GIS data, and other information (Lyon 2001) .
The present research focused on development of remote sensing indicators for wetland habitat types, the specific land cover of the ground surface.
investigation on the accuracy of classified images from three classification approaches. Three approaches were compared, including GIS rule based model. First approach is based on unsupervised classifier of ISODATA, the second using results from unsupervised classified classes as input to supervised classification, naming hybrid approach. The third approach was aim to develop knowledge rule set for the testing on distinguishing layers of water and forest.
The main goal was to examine the best possible combination or sequence of classifiers for typically classifying wetland type vegetation in the LANDSAT satellite image. The proposed classification approach aims to classify defined wetlands to delineate the habitat types in as high classification level as possible and compare accuracy the existing classified wetland inventory map made from Landsat using traditional classification techniques.
The specific objectives include:
- Identifies and maps wetland types (habitats) of National park Tram chim in Vietnam
- Create an easy to do procedures for image classification.
- Assesses accuracy of different methods of image classification.
- Capture lessons to build knowledge base for wetland type classification
1.4 Research questions
The study aimed at the manipulation of satellite image to examine the possibilities and effectiveness of three classification techniques.
- The preliminary questions are whether Landsat image can be applied successfully mapping wetlands types in small area; Moderate spectral resolution Satellite image can be a good source of wetlands classes separation?
- How can a hybrid classifier be used to classify Landsat ETM+ data to achieve better performance than classification techniques used using actual ground truth data?
- How to extract spatial and spectral knowledge for the wetland habitat types that can be utilized for expert classification?
All image manipulation, classification, and accuracy assessment were performed using ERDAS IMAGINE (Leica Geosystems, Inc.), ENVI (RSI), and ArcGIS (ESRI).
1.5 Outline of the thesis
The thesis is structured as follows:
Chapter 2 describes the background literature review and concepts of image classification, the evolution of classification process from visual interpretation, traditional techniques to the knowledge-based classification principles.
image data and the additional maps used. The chapter includes the description of the study area, classification scheme, and the classification procedures.
Chapter 4 discuss the results of the research and describe the accuracies of the classified images. This chapter also points out the research limitations and concerns.
2. LITERATURE REVIEW
Wetland mapping by satellite remote sensing has captured the attentions of researchers for many years thanks to advantages of using the technique. Numerous research efforts have been devoted to identify and measure wetlands and wetland habitat types. The efforts start from using optical multispectral Landsat imagery to combing difference imagery sources; integrating different image processing techniques; incorporating various types of spatial data such as GIS data, additional maps. The recent development of GIS data contribute to the ease of integrating many data source to improve the classification performance and mapping accuracy. Satellite remote sensing is especially appropriate to support the research in developing countries where fund are limited and where little information is available on wetland areas (Ozesmi, 2002, McAlister, 2008)
2.1 Use of Landsat imagery in detecting wetland
Wetland studies, traditional approaches which has long history of applying in land cover/land use mapping among the sensors detecting and measuring electromagnetic radiation in the optical part of the spectrum, Landsat images have been used in most studies of large wetlands. Users Landsat ETM be downloaded without any cost through the USGS website has regarded wetlands studies with favour.
Even though every types of data sensor were applied in wetland classification, Landsat is the most popular image in the experiments or play a one side in the pair image to compare with other data source.
NASA launched the first generation of Landsat imagery in 1972. The Landsat MSS data was used by many researchers to study wetlands (i.e. Haack and Messina (1997), Lee and Marsh (1995) Ackleson S.G. and Klemas V. (1987)). Currently, the imagery is used only in need of monitoring the historical changes studies where earlier dates of the image needed or in case of study on large areas acquiring numerous of satellite data.
The Landsat Thematic Mapper (TM) sensor, launched on Landsat 4 in 1982, has added more improvement on Landsat MSS in respect of spectral, radiometric, temporal and spatial resolution. (Ozesmi, 2002)
correlated with the minimum mapping unit, the trade off between the image availability and the cost.
Several wetland-mapping studies suggest that Landsat TM based classification provide greater overall accuracies than other space-borne sensors (Civco 1989, Hewitt 1990, Bolstad and Lillesand 1992a).
The most recent Landsat generation was launched in 1999. It carries the sensor of enhanced thematic mapper, providing a panchromatic band with 15m resolution as well as increasing spatial resolution for band 6 from 120m to 60m. The Global Land Cover Facility has made available many set of Landsat 7 ETM+ for scientific research. Landsat 7 ETM+ is the most frequently used data source for open wetlands delineation (Renzong, L. 2002, Li et al. 2005, Islam,M. D. 2008).
2.2 Traditional Remote Sensing classification techniques applied in
the wetland studies
Remote sensing classification is a complex process and requires consideration of many factors, such as the complexity of the landscape, the selected imagery data, and the image processing and classification method (Lu, D. 2007).
2.2.1 Visual analysis.
becomes untrustworthy. Therefore, computerized-methods are much more
emphasized in recent works.
2.2.2 Traditionally automatic classification.
Traditionally automatic classification is done by using pixels as the smallest
unit of the image. In the spectral p
ixel-based view, the image classification was divided into three main categories: unsupervised, supervised and hybrid classification which is the combination of two or more classifiers in the processing procedure. In unsupervised classification, or clustering, ISODATA algorithm is widely applied. The algorithm is an iterative classification procedure including merging the clusters if their spectral distance in the multispectral feature space is below a user specify threshold and rule for splitting the a single cluster into two clusters. (Jensen 2005). The algorithm automatically assign the clusters separation along the n-dimensional vector for every points in the feature space. The region of this feature space is defined by the mean and the standard deviation of each band in the analysis. The algorithm is self-organizing, thus require little human interactive interference. The input are the maximum number of clusters, the maximum percentage of pixel whose class values are unchanged between the iterations, and the maximum number of times in the iterations process of assigning the clusters and recalculating the mean. When each of these number is reached, the algorithm terminates. The algorithm does not take the pixel similarity as well as the two types of terrain difference into account during the analysis. Nevertheless, it hasadvantage of discovering the inherent spectral characteristics of pixels.
the usefulness of the unsupervised classification lie in the number of clusters applied. The larger number of clusters, the more successful the classification performance. Kempka et al (1992) has used more than 230 clusters per Landsat TM scene for identifying wetlands in California's Central Valley. Macleod and Congalton (1998) used an unsupervised ISODATA classification of Landsat TM data as a part in the change detection study on eelgrass meadows in Great Bay, New Hamphshire. After the first trial with 100 clusters without obtaining good results, the author used 255 clusters with much better results.
2.3 Hybrid classification
by Hinson et al (1994) to classify Texas coastal wetlands by using December Landsat TM images. (as reviewed by Ozesmi, 2002)
It is noted that hybrid classification in this study is referred to the combination or sequentially joining the classification techniques, mainly based on the methods reviewed in Ozesmi, 2002. There are other hybrid classification conception based on other criteria such as the combination of multiple imagery sources, or the combination of various classifiers into one approach. (Chaudhuri, D. 2004).
among the supervised classifiers, maximum likelihood generally gives better performance than the minimum distance to means or parallel piped classifiers because the covariance of the data is taken into account. (Ozesmi, 2002). There are numerous studies applied maximum likelihood supervised classification in wetland research. The authors were named in the review of Ozesmi, 2002, page 390.
Recently, Mc Alister et al (2006) has studied the wetland in the Lower Mekong Basin using Landsat ETM images and field survey data. A prudent preparation of ground data including field survey, on land and by boat, embraced marking way points has provided good training samples for the project. Overall accuracies range from 77.2% to 93.8% including wetland and non-wetland classes with GPS handsets within homogeneous areas, and at the boundaries of typical (wetland) habitats. The maps produced are now in use at a Provincial and National level in three countries for resource and conservation planning and management applications, including designation of a Ramsar wetland site of international importance. That study recommended to devise a strategy for extending spatial coverage at a lower resolution without loosing acceptable accuracy and to plan a handover of extended coverage mapping to national line agencies.
the earth surface represented by a pixel comes from the surrounding pixels.
The capacity of pixel-based methods is also limited when different objects have similar spectral information. And pixel-based classification creates heterogeneous objects, where inside the object sometimes several different landuse classes are to be found. However, it is not yet clear whether this aspect is advantageous or disadvantageous, as wetland types, landscape objects, are never completely homogeneous in nature (Wasser 2004).
2.4 Knowledge based classification techniques
Hundreds of classifiers algorithms were built and tested, but no classifiers is perfect according to Liu et al.2005 and Ozesmi (2002). Generally, it was found that ancillary information such as soils, elevation or land cover/use map as well as the combination of complement classifiers improved wetland classification. Combining automated classification with recently remote sensing data can quickly and accurately identify the position of small, isolated, and highly changeable ecosystem. More recent studies adopted knowledge based classification that allow integrating ancillary data. Skidmore (1989) defined an expert system as a computer system that attempts to solve complex real-world problems by reasoning. The expert's understanding about the physical characteristics such as the slope, aspect, geomorphology, geology of the area is mapped in the classification procedures. For example, Baker (2006) proved that hydric soils data was helpful in separating wetlands from irrigated agricultural land and riparian zones. Baker has applied the combination of Landsat imagery and ancillary environmental data and an Stochastic gradient Boosting classification algorithm resulted good effect for distinguishing a number of wetland conditions from the surrounding landscape. The accuracy of 86% derived form this study demonstrate that boosted decision trees provide improved sensitivity to characteristics of damaged wetlands that are often missed in other wetland mapping procedures. Baker affirmed that automated classification procedures are highly capable to detect wetland, the diverse land cover.
According to Inampudi, R.B (2002), three types of information are considered in constructing the knowledge rules for each land-cover type in the hierarchy:
• Domain spectral knowledge: Spectral knowledge can be used to construct the hierarchical structure of land-cover classes, such as discrimination between vegetation and non-vegetation regions using indices and detecting water areas using band decreasing property. This domain knowledge is obtained from the remote sensing literature.
specific quantitative classification rules. Training data help to generate thresholds to be used later as rules for discriminating and classifying land-cover categories more accurately.
• Spatial knowledge: Since spectral knowledge alone is insufficient for classification of all land-cover types, spatial rules have to be used to increase the resultant accuracy.
Several researchers have successful used knowledge-rule based classification in wetland studies. For instances, using SAR data in combination with Landsat ETM source, Ruan and Ren (2007) had identified inland freshwater wetland from crop. Clustering algorithms of ISODATA was employed firstly to generate initial classification results for sample selection. ETM+ attribute samples and some complementary data were fed into the CART (classification and regression tree) for the generation of knowledge rules. RADARSAT C band was classified and combined with the results from Landsat using rules. The results showed that the combination of Landsat and Radar data achieved the highest classification accuracy (92.3%), confirming the value of the rule-based methodology.
Baker et al (2006) used multi-season Landsat ETM+ imagery combined with ancillary topographic and soils data to map wetland and riparian systems in Gallatin valley, US. Two decision tree algorithms used in the study were CTA (classification Tree analysis) and SGB (stochastic gradient boosting). SGB resulted a better effectively accuracy than CTA (86% versus 73,1%). He concluded that the automated classification can quickly and accurately determine the location of small, isolated, and highly variable ecosystems.
Bolstad and Lillesand (1992b) have developed a rule -based model in which spatial data themes (roads, land cover, soil texture and terrain) and TM data for land cover classification of Landsat TM imagery. The overall classification accuracy of the rule based method was 83% compared with 69% for a traditional supervised classifier. Sader et al (1995) carried out an investigation to compare four classification techniques: unsupervised classification, tassel cap transformation, hybrid classification and GIS rule-based model for forest wetland classification in Maine. The overall accuracy of four super group including forest wetland, other wetland, forest upland and other upland) has improved from 72% to 81%. the study appeared that the GIS model had insignificant improvement over all the methods. He suggested the further study on the combination of GIS-rule model with hybrid classification.
sites in Eastern Canada were selected to test this new method. The accuracy obtained from the study ranges from 71% to 92%. In the study the slope threshold of 5% was used to constraint the extend of the wetlands, proving the potential of knowledge based decision rules
3. RESEARCH METHODOLOGY
3.1 Tram chim study area: location and characteristics
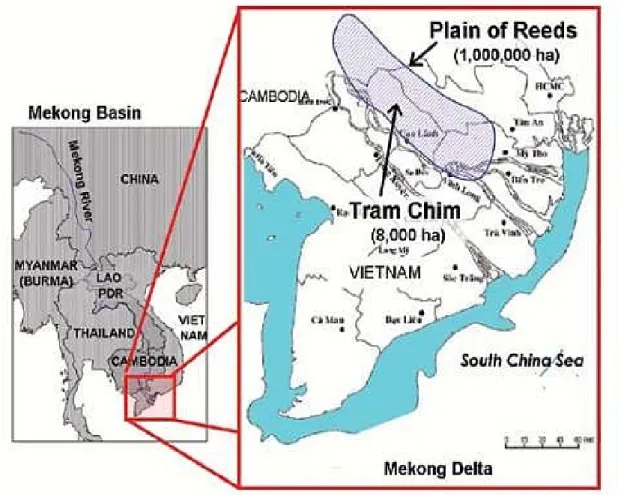
Tram Chim National Park (TCNP), (figure 1) covering an area approximately 7,740 hectares, is surrounded by dykes and canals and located in the Tam Nong District of Dong Thap Province, Vietnam. The area is within the coordinates bounded at 10º40' - 10º47'N, 105º26' - 105º36'E , is one of the last remnants of natural freshwater wetland habitat of the extensive Plain of Reeds (originally 670 000 ha). (MWBP, 2006). The park is bounded by a network of canals approximately 53km long in which more than 32 kilometres (km) of low dykes were constructed to maintain standing water in the dry season, restore the native flora and prevent fires in the Melaleuca forest. (Van Der Schan, M., 2006)
Established in 1994, Tram chim, the ecosystem consisting of alternating flooded and dry delta plains covered in grasses and Melaleuca forest, became the first wetland national park declared in Vietnam and has been nominated by the Vietnamese government to be a Ramsar wetland site in 1998. (Buckton et al. 1999).
3.1.1 Topography
Tram chim National Park is a predominantly even area; there is a difference of only 1.9 meters between the highest point and the lowest point. The high and low elevation areas are scattered throughout the park. The majority of the park, total of 5,864 ha, is very flat with an elevation ranging from 1.0 m to 1.4 m.
3.1.2 Hydrology
The area is historically characterized by two seasons: a flood season that lasts from June to December and a dry season that lasts from January to end of May. During the flood season the landscape is covered in water level up to 3 m in depth. There is little rain during the dry season, grasslands dry out and become susceptible to fire. The ecosystems of the Plain have adapted to the interchange of inundation during the flood season and drought in the dry season. Dykes, canals and roads have fragmented the area and prevent the flood waters advance and recede. Wet-rice agriculture is dominant covering the surface. The extensive canal system today causes water to advance more rapidly and recede in the same manner. In the dry season, water table would drop far below the ground (down to 1.6 meters by end of the dry season).
3.1.3 Landscape characteristics
Seasonally inundated grasslands which regenerate melaleuca forest, grassland communities account for main plantation pattern of the national park. The lower areas, roughly below one metre were dominated by swamp vegetation and forested wetlands. The diversity of soil types in the park facilitates the establishment of a diversity of vegetation from woody trees, such as Melaleuca cajuputi and Sarcocephalus coadunate, to seasonally inundated grassland species, lotus, water lilies, and other aquatic plants in the swamp, canals, and artificial ponds. (Nguyen, H.T. 2007, Van Der Schans. 2006) (Figure 2)
Plain of Reeds, become the most important conservation site in Vietnam. (Conor Linstead & Beazley 2006, www.mrcmekong.org)
(a) (b)
(c)
Figure 2. Seasonally inundated wetland types in Tram Chim Park. (a) aquatic bodies
(b) Melaleuca forest (c) Grasslands
3.2 Research design
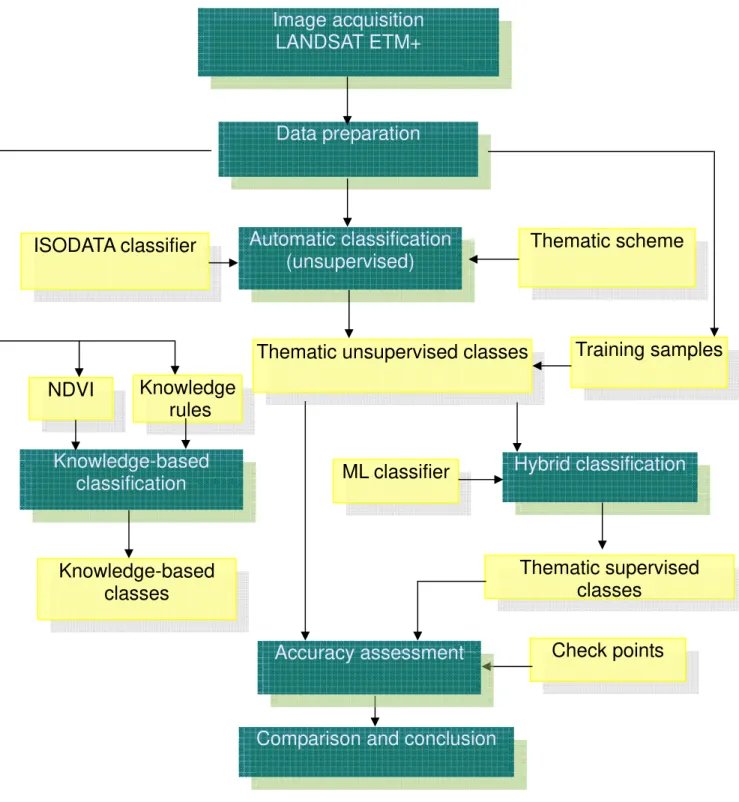
Figure 3. Work flow of the analysis of wetland habitat types in Tram chim National Park
Automatic classification
(unsupervised)
Thematic scheme
ISODATA classifier
Image acquisition
LANDSAT ETM+
Data preparation
Knowledge-based
classification
Knowledge
rules
NDVI
Knowledge-based
classes
Comparison and conclusion
Hybrid classification
ML classifier
Thematic supervised
classes
Check points
Accuracy assessment
3.3 Data collection
3.3.1 Imagery
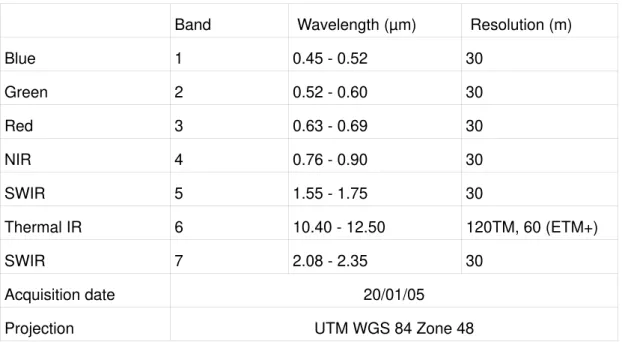
Landsat ETM+ image data consist of 8 spectral bands with a spatial resolution of 30 meters for bands 1 to band 5 and 7. According to the announcement from USGS, the data was geoprocessed at L1T level- precision and terrain corrected. Level 1T provides systematic and geometric accuracy by incorporating ground control points. The used Landsat has good quality of little cloud, acquired on 20 January, 2005. The image has 0,1 micrometer spectral resolution and 30 m spatial resolution. As reviewed by Ozesmi, the most important Landsat band to discriminate wetland types is band 5, which enable separating capability of the vegetation and soil moisture levels. Band 3, 4 and 5 were proved to be high prominent for wetland studies. In addition, the middle infra-red Landsat TM bands provide for much of the separability between wetland to recover forested types (Jensen et al. 1993a)
Landsat and are consider as relatively coarse resolution satellite images. However the images posse an advantage of free data (Landsat). Comparisons of different classification methods was carried out on Landsat ETM+ band 3, 4 and 5 downloaded from the archive of Global Cover Centre. The product was processed and maintained on 1T level.
Band Wavelength (µm) Resolution (m)
Blue 1 0.45 - 0.52 30
Green 2 0.52 - 0.60 30
Red 3 0.63 - 0.69 30
NIR 4 0.76 - 0.90 30
SWIR 5 1.55 - 1.75 30
Thermal IR 6 10.40 - 12.50 120TM, 60 (ETM+)
SWIR 7 2.08 - 2.35 30
Acquisition date 20/01/05
Projection UTM WGS 84 Zone 48
The processing parameters of the image are as follows: - Level 1T (terrain corrected) product
- 30/60 meters pixel size (Landsat 7 Pan band = 15) - GeoTIFF output format
- Cubic Convolution (CC) resampling method
- Universal Transverse Mercator (UTM) map projection - MAP (north up) image orientation
3.3.2 Topographic map and additional data
The topographic map of Tram chim was edited from three 1:25000 topographic digital maps provided in .dgn format. The area of interest on the map was extracted and used as additional information to learn the wetlands types because it presents the distribution and boundary of vegetation themes.
A land use/land cover maps over the provinces was provided. The 1:50000 map was established in 2005 which was recent to the year of the satellite image obtained. A previously established wetlands habitat type map in .jpg format was used as the reference data. The training data was referred to Google Earth satellite imagery and collected from which is sourced predominantly from DigitalGlobe and MDA Federal. (Figure 4). In addition, reference materials such as vegetation, soil, ecology maps relating to “Classification and Inventory of Wetland/Aquatic Ecosystems in the Mekong River Basin” were collected from government and non-government agencies, academic institutions, reports, personal contacts, and websites.
Earth. http://www.zonums.com/zmaps/digipoint.html
3.4 Data preparation
3.4.1 Classification scheme
Classification of wetland habitat types is based on the natural geographical condition of the area as well as the purpose of the research. In this study, classes were studied from the Mekong River Commission's scheme, namely “Wetland Classification System of the Lower Mekong Basin”. It was developed, proposed and adopted in April 1993 at the meeting of representative experts of the IMW-LMB Project in Vientiane (Mekong Secretariat, 1993) and has since been used in varying degrees in the four Lower Mekong Basin countries.
The full MRC wetland classification hierarchical system of Mekong River delta is hierarchical progressing from systems and subsystems to classes and is able to be further subdivided to detailed units which can be used at local levels. Within the subsystems, classes are based on vegetative life forms, or on substrate materials, or on flooding regime. The system constitutes 5 levels: 1) between freshwater and coastal salt; 2) marine/coastal and estuarine, riverine, freshwater/palustrine and lacustrine water habitats; 3) types are determined by period of inundation or seasonality; 4) this level is determined primarily by habitat features or land cover; 5) wetlands with woody cover are assigned a broad canopy cover. However, the system does not include taxonomic detail. (Table 2).
The physical characteristics of wetlands within the national park shows that wetland types are of freshwater level. Level 1 and 2 in the Mekong classification scheme can be skipped. McAlister (2006) has done a study on mapping the wetlands in the lower Mekong basin. The wetland habitats appeared in Tram chim pilot sites were marsh, rice field irrigated, emergent woody scrub – moderate canopy, flooded forest, flooded plantation, natural ponds, natural channels, artificial channels, dry grasslands, bare soils, and buildings. These habitats were recorded during the field surveys and/or classified in the image analysis.
Level 1 Level 2 Level 3 Level 4 Level 5
permanent lakes - natural permanent freshwater lakes
- artificial permanent freshwater lakes
Freshwater Lacustrine Lakes (>8 ha)
lakes
permanent ponds
- natural permanent freshwater ponds
- freshwater aquacultural ponds - sewage treatment ponds - farm ponds
- cooling ponds Ponds (<8
ha)
seasonal ponds - natural seasonal freshwater ponds
- artificial seasonal ponds
Permanent - (grass) permanent flooded grassland - (sedges) permanent freshwater marshes - (trees/shrubs) permanent swamps Palustrine
Seasonal - (grass) seasonal flooded grassland
- (grass) artificially seasonally flooded plantation - (sedges) seasonal flooded marshes
- (trees/shrubs) seasonal flooded swamps - (trees/shrubs) artificially seasonally flooded plantation
Table 2
.
Extracted Mekong lower basin wetland classification system. Source: Mekong River commission (2001).The satellite image classification were not considered to be sufficiently reliable to identify wetland vegetation species. Based on the Mekong wetland classification scheme and the study on the recent characteristics of the area, the wetland classification classes in Tram chim park are aggregated and proposed as follows. (Table 3)
(1) Flooded forest (2) Swamp/scrub (3) Reservoirs (4) Plantation
(5) Buildings/settlement (6) Plant submergence (7) Rice fields, other annuals (8) Bare land
Code Types Description
1 Flooded forest >5 m melaleuca, wetland with less than 75% open water, woody
vegetation often more than 1 m high covering more than
2 Swamp/shrub woody <5 m, wetland dominated by shrubs, ford or emergent
plants with less than 75% open water. The area may be
flooded or have periodic or persistent surface water.
3 Reservoirs Lake, canal, channel, reservoir and ponds, without any wetland
plants
4 Plantation flooded/annuals grasslands
5 Settlement built-up and exposed areas
6 Grass
submerge
Seasonally inundated grasslands
7 Rice fields Rice fields annuals
8 Bare land Dry land for vegetative and other uses
Table 3. Classes in the study area.
In this research, automated classification and knowledge based classification of the proposed classification scheme will be compared. The methods follow the same classification scheme presented in the table above.
3.4.2 Image preparation
The LANDSAT imagery was accessed according to the following tasks order:
− image import: Landsat band images in TIFF format was transferred into *.img file.
− Geometric goodness: The image product was checked to be sure it was registered to Universal Transverse Mercator (UTM) World Geodetic System 1984 (WGS84) coordinate system, zone 48 (North). Then no geometric correction was necessary.
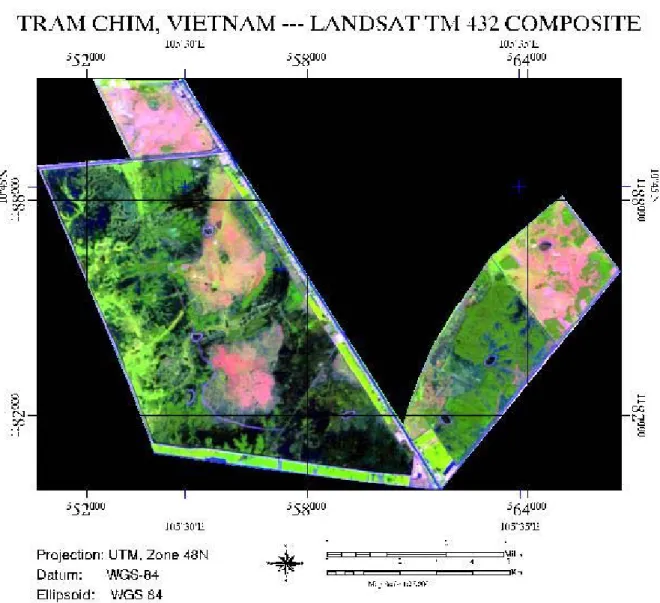
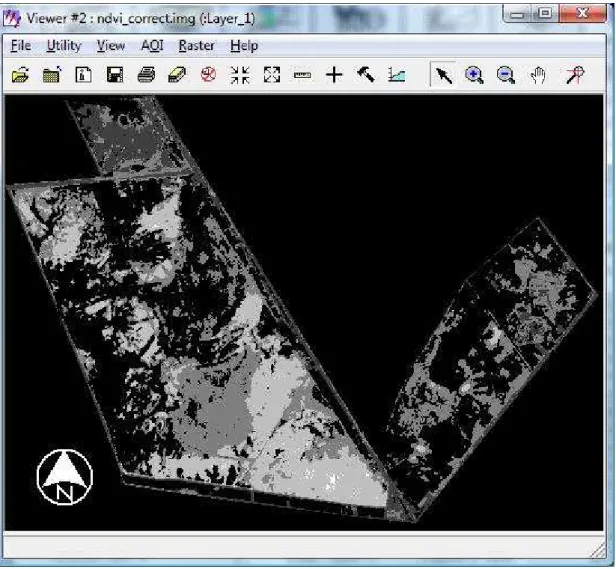
− Image subset: the image was clipped to the limit of the wetland national park area surrounded by the dike system.(Figure 5)
− Radiometric correction was not implemented thanks to the good image quality over the study area.
Figure 5. The subset composite image of the study area represented in V-shape layout
It is necessary to create the hypothetical features or additional parameter to complement the insufficient input information
3.4.3 Calculation of Normalized Difference Vegetation Index (NDVI)
the original spectral reflectance data and associates with vegetation canopy characteristics such as biomass, leaf area index and percentage of vegetation cover. (Huete et al. 2002). It gives an approximation of the difference in the vegetation rate. The lighter gray of digital NDVI values indicates the higher vegetated amount of that pixel in the image matrix.
The NDVI ratio reduces many forms of multiplicative noise (e.g. Sun illumination, cloud shadows, topographic variation) and is an alternative measure of vegetation amount and condition (Jensen, 2005).
NDVI image was derived by ERDAS computation. (Figure 6). Visual comparing between NDVI image and reference map revealed that higher NDVI values with lighter gray indicate greater plant cover (vegetation density) which coincides with the Melaleuca forest area in the reference map.
3.5 Classification procedures
Classification mission is to sort the pixels into a finite number of individual classes or categories of data. This process based on the multispectral brightness values of pixels. When a set of criteria is satisfied the pixel is assigned to the class that corresponds to those criteria. (Jensen, 2005).
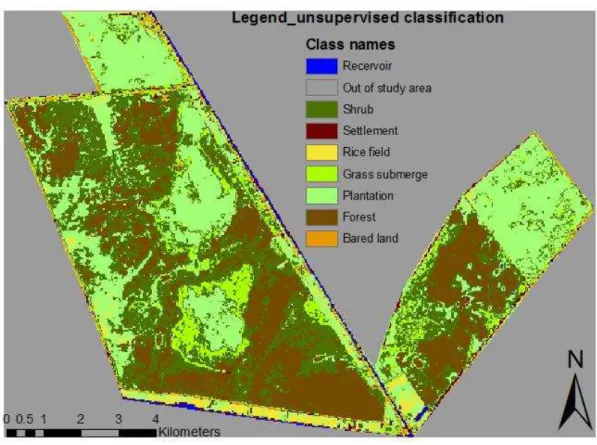
3.5.1 Unsupervised classification
Figure 7. Classified image under unsupervised classification technique.
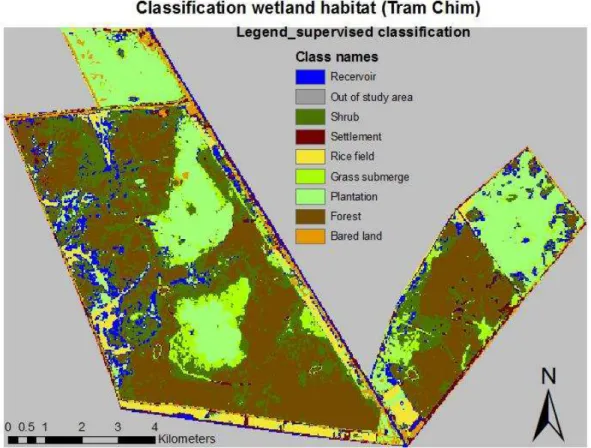
3.5.2 Hybrid classification
Figure 8. Classified image with supervised classification technique. Preliminary evaluation
Figure 9. Visual comparison techniques. (a) referenced raster data, (b) referenced vector data, (c) interpreted data, (d) overlayed compared output. (Figure was adapted to Wasser (2004)).
classification became misclassified in the hybrid classification despite of the higher overall accuracy achievement of the hybrid classification method.
3.5.3 Knowledge based classification
3.5.3.1
Knowledge
base
establishment
Rules guiding humans in their decision-making are relatively heuristic. Upon the reading of the previous studies, the interpreter derives the information using the semantic knowledge about a specific scene. Rationally, the analyst does considerable experiment to test the characteristics or the reflective representation of the object. The hypothesis may applicable to other applications. For example, it is discovered that soil high in organic matter result influence on area recognition (Lyon 2001). These areas are presented from very dark toned and darker than plants in the visible part of the spectrum. The knowledge derived might be the recognition of a specific plant in the area which contains rich organic soil and shown as dark tone on the image. Mastuyama took an example from Yaki to illustrate the building of knowledge: the rule “since the of grasses can be green or yellow, merge green regions with neighbouring yellow regions” incorporates domain-specific knowledge into the research (Inampudi 2002).
3.5.3.2
Developing the rule base by expert classifier in Erdas
Imagine
A rule can be defined as a list of conditional statements that determine the informational contents of a scientific hypothesis.[Chaudhuri 2004]. In Erdas Imagine 9.1, the Expert Classifier make platform for rules and hypothesis in a hierarchical manner describing a final set of target informational class. The Expert Classifier has two components, one is the Knowledge Engineer and the other is Knowledge Classifier. The first component provides a graphical user interface to build the knowledge base. A tree diagram represent the class definitions known as hypothesis, rules (conditional statements of variables), and variables (raster, vector, or scalar). The Knowledge Classifier execute the knowledge rules created in the Knowledge Engineer module and classify the image.
standard deviation of the pixel spectral reflectance value. Rules for forest wetland class:
if Band 3 >= 15 AND Band 3 < 96 AND NDVI >= -0.25 AND NDVI < 0.132 AND in the class 2 (denoted as forest in hybrid classification) then forest
if Band 3 > 25 AND Band 3 < 66 AND NDVI <-0.231 AND in the class 1 which was denoted as water / reservoir then reservoirs.
If Band 3 >= 54 AND NDVI > 0.2 AND in the class of bare land then bare land.
The descriptive illustration of the rule construction in Erdas Imagine is as the figure 11 below
Figure 10. Rules built in the Expert Classifier in ERDAS Imagine.
3.5.3.3
Apply the rule
Figure 11
. Classification with knowledge -based classifier which is combined with number of unsupervised classification classes.4. RESULT AND DISCUSSION
Accuracy of classification may be defined as the degree or percentage of correspondence between the user’s observation on remote sensing images and the reality (Jensen, 2005). For the assessment of the classification accuracy, the classified data have to be compared with ground truth data. This information could either be gathered by a field visit or with the aid of image data which shows the test site most accurately. As for the test of the site previously established wetland map and topographical map of 1:25000 are available and because of lack of the time and limited facilities, the option of collecting GPS point in the field checking was abandoned. The comparison was conducted between the images and maps by visual inspection and collecting check points from Goggle image.
In a pixel-based accuracy assessment approach, pixels randomly selected in the reference image are compared with classified pixels to build the statistical background. The software Eras Imagine offers two possibilities for accuracy assessment. In the first case the software generate random point in the classified image, whose class value are input for the reference pixel. The software then compares these classes to the classification result and computes the accuracy. In the second case, the user imports a classified thematic layer prepared from any ground truth data which serves as basis for accuracy assessment.
An error matrix is a table of numbers set out in rows and columns, which represent the number of reference units assigned to a particular class relative to the class verified by the ground truth. (Wasser 2004). In the matrix table, the classification accuracy is described in different ways:
• The overall accuracy is the relationship of the correctly classified objects to the total number of the points of reference.
• The user’s accuracy is calculated by the division of the correctly classified objects through the number of all classified objects per class, thus shows if an object was assigned according to the class in reality. Information about the reliability of the classified maps is revealed.(Jensen. 2005). Producer’s accuracy is the probability of a reference pixel being correctly classified as a particular information class on the classified map. It is obtained by dividing the total number of correct pixels in a category by the total number of pixel of that category. The producer’s accuracy does not consider those objects that are classified incorrectly to a class.(Jensen. 2005, Wasser. 2004)
was not proved since field visit was not performed. The drawback of accuracy assessment in the study area is associated with obtaining ground truth data. No field work was done throughout the study. All the reference data was derived from maps in *.jpg format and from internet resources. The most of testing samples were supported by using Google Earth image. (Figure 4). The data points was selected and exported to .csv format. Then the geographical coordinates were converted into projected coordinates in order to introduce in the accuracy assessment tool of Erdas imagine.
The classification accuracy of the habitat map created from Landsat multispectral image data was tested against the reference points imported in Erdas imagine package. A total of 149 sample points stratified by the subset area were generated across the satellite image of Google Earth, converted into X, Y co-ordinates. Table 4-5 show the user’s and producer’s accuracies for the two different classifiers.
Table 4. Accuracies of unsupervised classifications
Wetland types F SH W SE GS RF BL Total User's accuracy(%)
forest 48 10 0 0 0 0 0 59 81
shrub 14 22 1 0 0 0 0 37 59
water 2 1 5 0 0 0 0 8 62
settlement 2 0 0 1 0 0 0 3 33
grass submerge 14 4 0 0 4 0 0 22 18
rice field 1 0 0 0 0 0 0 1 0
bared land 11 2 1 0 0 0 5 19 26
Column Total 92 39 7 1 4 0 5
52 56 71 100 100 0 100 Overall accuracy 57%
Kappa Statistics = 0.36 n=149
Table 5.
Accuracies of supervised classification
Kappa statistics is a discrete multivariate technique used in accuracy assessment which uses Khat statistic as a measure of agreement or accuracy between classified map and reference data (Jensen, 2005). The Kappa analysis tests if a land-use or land-cover map is significantly better than if the map had been generated by (random) chance (Congalton, 1996). The obtained Kappa of unsupervised classification with 0,36 represented poor agreement between wetland classified map and reference data. Kappa statistics of supervised classification method reached a moderate agreement of 0.56.
Table 6. Area and and proportion of thematic layers of wetland habitats relatively compared to the total area of Tram chim (from hybrid classification result).
The result of applying automated classification techniques to Landsat ETM was a digital wetland habitat map covering the National Park of Tram chim study area. As illustrated in table 6, nearly 35 % of the study area was mapped as forest class, 20% as shrub and plantation of grass. Bare land accounts for the least area with proportion of 3.4 %. Another indicator class of wetland habitat is grass submerge
Wetland types GR W BL SH F GS SE RF Total User's accuracy(%)
grass 19 1 1 0 1 1 0 0 23 83
water 0 0 1 3 5 0 0 0 9 0
bared land 0 0 2 0 0 1 0 0 3 67
shrub 1 10 9 6 1 1 0 0 28 21
forest 0 3 0 2 54 1 0 0 60 90
grass submerge 0 0 1 1 0 8 0 0 10 80
settlement 0 0 0 0 0 0 3 0 3 100
rice field 0 0 2 0 0 0 1 10 13 77
Total 20 14 16 12 61 12 4 10
95 0 13 50 89 67 75 100 Overall accuracy =68%
Kappa Statistics =0.56 n=149
Producer's Accuracy (%)
Classes Area (ha) Proportion (%)
plantation 1703.52 21.29
water 568.53 7.11
bared land 271.62 3.4
forest 2748.06 34.35
grass submerge 613.71 7.67
settlement 333.9 4.17
rice field 342.81 4.29
class which accounts for 7.67% over the total area.
The overall accuracy of hybrid classification method had 11% slightly improvement over unsupervised classification method. This accuracy level ranged from 57% to 68% is much lower than the minimum 85% accuracy suggested by remote sensing researchers. However, it is evident that the automated classification methodology, the complexity of wetland classification scheme remains the open problems. The issues of reason led to the low accuracies will be addressed and explained more detailed in the concern and limitation section.
In unsupervised classification, the majority of the error is from the water class. This is interestingly discovered when it is checked in reference map that water bodies are distributed limitedly in the area, inundated vegetation dominated the surface of the park. The selected testing points failed in assessing its accuracy, affecting the overall accuracy assessment of the analysis.
In supervised classification method, forest communities were classified more accurately than shrub communities. 90 percent of pixels that were classified as Melaleuca forest were indeed 89 percent classified as such in the reference habitat map. For other habitat, the accuracy varies considerably from 21 percent for shrub to 83 percent for grass. During classification, similarities cause errors. The most confusion percentage happened between the class of water bodies, shrub and bare land, resulting 0%, 21%, and 67% respectively.
Although the performance of the hybrid approach improved discrimination of wetland types, the misclassification of water bodies has seriously affected the final accuracy assessment results.
By combining the results from unsupervised classification with the rules applied for band thresholds and NDVI variable, the classification of knowledge-based experiment was carried out. Visual inspection revealed that the classification did some refinement to the class of water bodies and forest despite of disability in detecting bare land as set in the rule base.
Although unsupervised classification may not produce the highest wetland types classification accuracies, it was selected to determine how well an automated classification method would achieve in discriminate wetland habitat types. This method produced 57% accuracy over the study area.
resulting mixture of ground features, such as water and vegetation in the wetland settings. Especially, the spectral signatures of pixel representing water communities are confused with grass in the background. This account for relatively low accuracy of inundated grass, thus making the 30m spatial resolution Landsat limited effect. Another practical difficulties are the lack of field work checking to judge the ground signal of the thematic classes. The verification data for this 2005 image might have caused bias due to the absence of field visit data.
Despite of the difficulties, the spectral information of the Landsat image data allowed the establishment of the wetland habitat map in the area and can be developed into higher levels. This imply that first step of investigation can be implemented using automated classification of Landsat multispectral data.
Research concerns and limitations
The classified map from in this research need much improvements to meet the goal of utilization in other scientific investigations and ecological applications. The main factors which affected the result are described as below.
Landsat ETM imagery with coarse resolution is the most important factor that influenced the accuracy of the classified map. The imagery is not applicable to establish map of scale of 1:25000. The homogeneity of 3*3 pixel at 30 meters pixel level which depict the high generalized classification in the study area. It was hard to bound accurately a homogeneous class of wetland habitats due to the coarse 30m pixel size of the image. The resolution of the image also affect the accuracy of collecting the complement training samples. The mixed pixel phenomena contributed errors for the classification.
The image acquisition problem: the most matched imagery to differentiate the wetland types such as forest, inundated grass and shrub categories is subject to rainy season which last from June to late December. The acquired image is on January which is at the beginning of dry season.
Ideally the set of training data and testing data should be collected from the field survey, the high resolution image data, or aerial photographs. With the limited facilities, the study was done under the limitations of those factual information. The low acceptable classification results has also related to the above reference data problem. The errors were inherent in the previously established wetland maps used in the study. It was lack of map quality information.
5. CONCLUSION AND FUTURE RESEARCH
5.1 Conclusion
A thematic wetland map of the Tram chim national park was obtained from this study. The overall accuracy of supervised classification was 68 % which was rather low. However, the automated unsupervised classification technique proved to be a good start of the classification process. The Landsat wetland classes were further derived from the hybrid classification model taking advantages of the classes from unsupervised classification to input into supervised classier to discriminate wetland forest, shrub and other wetland types. As the overlap among the wetland types are large, wetland classes from Landsat satellite image classification alone was limited to shallow water with emergent/submergence plant around the perimeter of water bodies, the spectral signature of inundated shrub, grass and water bodies are difficult to distinguish one from another, even if the feature of water class was expected to differentiate easily.
From the experiment of knowledge-based classification, it is appeared that the cluster results from unsupervised classification or other automated classification can be coupled with additional data to help the analyst predict the thematic classes. The classifier enable the analyst an easily modified and understandable rules built from domain spectral knowledge. The expensive operations can be avoided by eliminating the bands involved in the classification procedures. The model variables can vary among study sites. Equipped with landscape understanding and the spectral essence of the interested ecological objects, the intuitive and sensitive experiment focusing on how to weight the variables potentially yield good classification results.
Interpreting Landsat ETM images hierarchically can at least provide us partial understanding for some regions. However, toward the objective of mapping at the scale of 1:25000, Landsat ETM was insufficient for differentiating wetland habitat classes. Further investigation should be implemented with the potential to use higher resolution sensors such as IKONOS, Quickbird. Wetland maps of this spatial resolution would result more accurate and detailed wetland types as well as enable calculation of wetland areas in case of change detection. For the operational use, the economic conditions will play important role in the analysis. In fact, it is necessary to conduct research on economic aspect of the mapping with space images.
potential for contributing an automated and repetitive classification method toward map generation and updating in a way faster than conventional techniques in contrast to the manual interpretation. However, the researcher need to be more aware of the limitation of the lack of spatial resolution imagery as well as the reliability of the reference data set.
5.2 Future recommendation
Finer resolution imagery or the integration of multisource images should complement to Landsat image single usage.
Regarding the hybrid classification method, future additions to this research will include the reliable ground truth samples in the form of points, lines and polygons from areas that were not possible to visit. More points for accuracy assessment should be added, ancillary additional data quality need to be examined before transformation into computer-accessible format.
Understanding of distribution pattern of habitats types helps researcher to generate good rules. Incorporation geomorphology layers of more hydrographic and soil data will generate more spatial rules, enhance the goodness of knowledge base and improve the classification accuracy for wetland habitat.