Genetic characterization of Bhutanese native chickens based on an analysis
of Red Junglefowl (
Gallus gallus gallus
and
Gallus gallus spadecieus
),
domestic Southeast Asian and commercial chicken lines
(
Gallus gallus domesticus
)
Nedup Dorji
1,2, Monchai Duangjinda
1,3,4and Yupin Phasuk
11
Department of Animal Science, Faculty of Agriculture, Khon Kaen University, Khon Kaen, Thailand.
2Faculty of Animal Husbandry, College of Natural Resources, Royal University of Bhutan, Bhutan.
3Center of Excellence on Agricultural Biotechnology, Bangkok, Thailand.
4
Research and Development Network Center for Animal Breeding, Khon Kaen University, Khon Kaen,
Thailand.
Abstract
The genetic diversity of Bhutanese chickens needs to be understood in order to develop a suitable conservation strategy for these birds in Bhutan. In this, work, we used microsatellite markers to examine the genetic diversity of Bhutanese chickens. Four Bhutanese chicken varieties (Black plumage, Frizzle, Naked neck and Red Junglefowl-like, corresponding to Yuebjha Narp, Phulom, Khuilay and Seim, respectively), two subspecies of Red Junglefowl (Gallus gallus gallus and Gallus gallus spadecieus), two varieties of Thai native chickens (Pradhu Hang Dam and
Chee;Gallus gallus domesticus) representing the Southeast Asian domestic chicken, and two commercial lines
(Broiler and Single Comb White Leghorn) were genotyped with 18 microsatellites that included 16 loci recommended by the FAO/ISAG for investigations of genetic variability in chickens. All loci were polymorphic, with the number of al-leles ranging from six (MCW0111) to 23 (MCW0183). Substantial genetic variation was observed in all populations, with the Bhutanese native chicken Yuebjha Narp (Black plumage chicken) showing the lowest genetic variability. De-spite extensive intrapopulation variation, the genetic differentiation among 10 populations was moderate. A neigh-bor-joining tree revealed the genetic relationships involved while principal component analysis showed that Bhutanese native chickens should be given priority in conservation efforts because of their genetic distinctiveness. Chee chickens are especially valuable as a reservoir of predomestic diversity, as indicated by their greater genetic variation and their position in the phylogenetic tree.
Key words:conservation genetics, genetic comparisons, genetic variability, microsatellites. Received: September 10, 2011; Accepted: March 26, 2012.
Introduction
Domestic chickens are believed to have originated in Southeast Asia, with Thai native chickens being regarded as the original domesticated chickens (Hillelet al., 2003). The decrease in the genetic diversity of native chicken pop-ulations described in recent genetic studies has raised con-cern because the unique genotypes and traits of native populations are at risk of being lost, with a consequent threat to a well-established food source (Nassiri et al., 2007). This situation suggests that the management of na-tive chicken genetic resources should be given greater prio-rity.
Bhutanese native chickens are of socio-cultural and economic importance to the livelihood of many rural popu-lations. For instance, these birds are slaughtered to please local deities, feed guests, and supplement the diet (with eggs and meat) of women during pregnancy and after birth (Nidup et al., 2005). For these reasons, native chickens continue to thrive despite the introduction of several breeds and strains of exotic chickens by the Bhutanese govern-ment. Native chickens constitute about 95% of the chicken population in Bhutan (Nidup and Tshering, 2007). The phenotypic characteristics (Nidup et al., 2008), blood group polymorphism (Yamamotoet al., 2007) and mito-chondrial DNA sequences suggest that Bhutanese native chickens are genetically diverse (Nidupet al., 2005). How-ever, they have not been genotyped using microsatellite markers recommended by the Food and Agriculture Orga-nization and International Society for Animal Genetics
www.sbg.org.br
Send correspondence to Monchai Duangjinda. Research and De-velopment Network Center for Animal Breeding, Department of Ani-mal Science, Faculty of Agriculture, Khon Kaen University, 40002 Khon Kaen, Thailand. E-mail: monchai@kku.ac.th.
(FAO/ISAG). The genetic diversity of native chickens needs to be thoroughly assessed in order to ensure sustain-able poultry production.
According to Nidupet al.(2005), there are 13 strains of native chickens in Bhutan. However, the FAO Domestic Animal Diversity Information System lists only 10 strains. Currently, based on their socio-economic importance and popularity among farmers, four common strains may be tentatively considered to represent the general Bhutanese chicken population. Seim (Red Junglefow-like) is a com-monly reared breed that is believed to be an immediate de-scendent of Red Junglefowl (Nidup et al., 2008) while Yuebjha Narp (Black plumage) is considered to have me-dicinal values. Khuilay (Naked neck) chickens are gener-ally found in warmer regions of the country and this is consistent with the suggestion that these birds are heat-tolerant (Yunis and Cahaner, 1999). On the other hand, Phulom (Frizzle) chickens are specifically reared by some castes in southern Bhutan. Previous studies have examined genetic variations in Black plumage (Granevitze et al., 2007) and Naked neck (Nassiriet al., 2007; Piranyet al., 2007) chicken populations in several countries. Some Bhu-tanese chickens resemble to their ancestor (Red Jungle-fowl) while others resemble commercial lines.
In the last decade, the investigation of population variations has involved multi-allele markers. In particular, microsatellites have become a powerful tool for studying population genetics because of their unique characteristics, such as random distribution over the genome, codominant inheritance, high mutational rate and high reproducibility (Weigend and Romanov, 2001; Hillelet al., 2003). In this
study, we used microsatellites to investigate the genetic variation among Bhutanese native chickens and to assess their genetic relatedness to Red Junglefowl, Thai native chickens and commercial lines. This information should provide a basis for developing effective conservation pro-grams.
Materials and Methods
Chicken strains and sample sizes
Two hundred and eighty-eight individuals belonging to four strains of Bhutanese native chickens (Seim, n = 30; Yuebjha Narp, n = 24; Khuilay, n = 25; Phulom, n = 26), two strains of Thai native chickens (Pradhu Hang Dam, n = 30; Chee, n = 32), two subspecies of Red Junglefowl (Gallus gallus gallus, n = 31; Gallus gallus spadiceus, n = 30), and two commercial lines (Broiler, n = 30; White Leghorn, n = 30) were studied (Table 1). The minimum sample size suggested by Tadanoet al.(2007) was used in this study. The Mendelgang and Deorali (Bhutan) strains were also sampled because of an expected high genetic variation compared to other strains.
Blood samples (1.5 mL) were drawn from the ulnar vein into a microtube containing 0.5 M EDTA and DNA was isolated as described in Goodwinet al. (2007). The blood samples from Red Junglefowl were collected at the Department of National Parks, Wildlife and Plant Conser-vation (DNP), and those from Pradhu Hang Dam and Chee at the Research and Development Network Center for Ani-mal Breeding (Native chicken) and the Department of Livestock Development, respectively; samples from
com-Table 1
-Characteristics of Bhutanese and Thai native chickens and subspecies of Red Junglefowl used in this study.
Strains Distribution Morphological features
Comb type Plumage Shank and Beak
Seim (Red Junglefowl-like)
Throughout Bhutan Rose, pea, single Red junglefowl-like, greenish, tailed, sickle-shaped feathers; male are golden brown, sometimes reddish brown saddle; female are brownish red with dark-greenish stripe on each feather.
Black, yellowish
Yuebjha Narp (Black plumage)
Southwestern and western Bhutan
Rose, pea Both sexes are entirely black; name derived from mor-phology.
Blackish, slate
Khuilay (Naked neck)
Southern and southwestern Bhutan
Rose, pea, single Generally soft-feather red, diverse plumage color,e.g., white, partridge; featherless at neck.
Yellowish, whitish
Phulom (Frizzle)
Southwestern and southern Bhutan
Rose, pea Feathers face outwards (various colors as in Seim, black).
Yellowish, black
Pradhu Hang Dam
Northeastern Thailand Pea Both adults are completely black. Black
Chee Central Thailand Pea Entire plumage is white in adults of both sexes. Yellowish
G. g. gallus Northeastern Thailand Single Male has yellowish hackles, dark green sickle-shaped feathers; females are dull brown; white ear lobe.
Slate, grey, yellowish
G. g. spadiceus Northern Thailand Single Male has uniform golden yellow cover from neck to lower back; tail feathers are greenish black with white patches; females are dark brown with yellowish plum-age designed for camouflplum-age; red ear lobe.
mercial lines were collected at private poultry companies in Thailand.
Microsatellite genotyping
Eighteen microsatellite combinations from the FAO/ISAG list and Nassiriet al.(2007) were used; these microsatellites were also used in the AVIANDIV project (Hillelet al., 2003). Microsatellite loci amplification was done by polymerase chain reaction (PCR) with specific primers and annealing temperatures (Table 2). The electro-phoretic bands of the PCR products were scored using a SYNGENE Gel documentation system (Syngene Inc., UK).
Data and statistical analyses
The alleles were analyzed to determine the mean number of alleles per locus and the observed (HO) and ex-pected (HE) heterozygosities. The Chi-square test was used to assess Hardy-Weinberg equilibrium (HWE). The fixa-tion coefficient of an individual within a subpopulafixa-tion (FIS) and the fixation coefficient of a subpopulation within the general population (FST) were estimated using GE-NEPOP v. 4.0.10 (Raymond and Rousset, 1995; Rousset, 2008). A neighbor-joining method (Saitou and Nei, 1987) in the Numerical Taxonomy System (NTSYSpc) v. 2.10 package was used to construct a phylogenetic tree based on
Nei’s unbiased genetic distance (Nei, 1978). Principal component analysis – PCA (SAS, 1998) based on individ-ual Dice genetic distances was used to visindivid-ualize the genetic relationships and detect geographical clines that were not apparent from the phylogenetic tree. Numerical data were expressed as the mean±SD with p < 0.05 indicating signif-icance.
Results
Microsatellite polymorphism and population diversity
The genetic variability of the microsatellite loci is summarized in Table 2. 255 alleles were detected across 18 loci in ten chicken populations, with a mean number of al-leles per locus (MNA ± SD) of 14.17 ± 4.37. Locus MCW0183 was highly polymorphic with 23 alleles while MCW0111 had the lowest polymorphism (6 alleles per lo-cus). Averaged over the 18 loci for each population, the HO and HEranged from 0.262 (MCW0248) to 0.791 (LEI0094) and 0.669 (MCW0111) to 0.898 (LEI0094), respectively. For all loci, the mean HEwas higher than the mean HO (Ta-ble 2), which suggested sampling bias or a possi(Ta-ble in-breeding mating system.
Table 3 summarizes the genetic variation across pop-ulations. This variation was greatest for Chee (MNA±SD,
Table 2- Characteristics of the 18 microsatellite markers used in this study and the number of alleles observed at each locus.
Locus Tm (°C)a Alleles per locus Heterozygosity F-statistics
Observed Expected FISb FSTc FITd
ADL112 60 15 0.620 0.790 0.344 0.050 0.371
ADL0147 57 12 0.540 0.821 0.400 0.067 0.440
ADL0268 60 8 0.478 0.785 0.238 0.077 0.296
ADL0372 60 10 0.426 0.782 0.394 0.073 0.439
LEI0094 60 21 0.791 0.898 0.152 0.067 0.209
LEI0166 60 18 0.633 0.859 0.223 0.099 0.300
MCW0014 60 16 0.675 0.865 0.181 0.045 0.218
MCW0034 60 16 0.739 0.879 -0.227 0.062 -0.151
MCW0037 60 13 0.601 0.791 0.232 0.089 0.250
MCW0069 60 13 0.494 0.786 0.177 0.136 0.337
MCW0081 60 15 0.496 0.832 0.236 0.062 0.284
MCW0104 60 18 0.363 0.797 0.668 0.171 0.725
MCW0111 60 6 0.318 0.669 0.456 0.151 0.538
MCW0123 60 12 0.487 0.802 0.428 0.113 0.493
MCW0183 60 23 0.307 0.867 0.624 0.072 0.651
MCW222 60 15 0.535 0.846 0.578 0.082 0.612
MCW0248 62 15 0.262 0.814 0.857 0.039 0.863
MCW295 60 9 0.377 0.763 0.572 0.049 0.584
Mean±SD - 14.17±0.93 0.508±0.150 0.814±0.053 0.363±0.247 0.084±0.037 0.414±0.233
a
10.83±0.85; HO, 0.58±0.04; HE, 0.84±0.02) and Khuilay (MNA±SD, 9.50±0.68; HO, 0.49±0.04; HE, 0.83±0.02) varieties. In contrast, Phulom (MNA±SD, 8.50±0.57; HO, 0.55±0.04; HE, 0.81±0.01) and Yuebjha Narp (MNA± SD, 7.94±0.40; HO, 0.44±0.05; HE, 0.79±0.02) varieties showed the lowest genetic variation compared to the com-mercial lines.
The Wright fixation indices for FIS ranged from
-0.227 (MCW0034) to 0.857 (MCW0248), FST ranged
from 0.039 (MCW0248) to 0.171 (MCW0104), and FIT ranged from -0.151 (MCW0034) to 0.863 (MCW0248),
with means of 0.363 ± 0.247, 0.084 ± 0.037 and
0.414±0.233, respectively (Table 2). A high positive FIS indicated a high degree of observed homozygosity (MCW0248) while there was excessive heterozygosity at locus MCW0034, as indicated by the negative FISvalue. Significant deviations from HWE (p < 0.5) were observed across 10 populations at locus MCW0295. High selection
pressure resulted in seven loci that deviated from HWE in the Broiler strain (ADL112, ADL0268, ADL0372, MCW0037, MCW0069, MCW0111 and MCW0123). De-viation of HWE was also found in Red Junglefowl (MCW0111), Chee (ADL112) and Khuilay and White Leg-horn (MCW0248).
Genetic relationship and phylogenetic tress
Table 4 shows the dissimilarity matrices between pairs of populations. A neighbor-joining tree based on Nei’s unbiased genetic distance matrices revealed that Khuilay (Bhutanese naked neck) was most closely related to Pradhu Hang Dam (Thai native black). The other three Bhutanese strains, Seim (Red Junglefowl-like), Yuebjha Narp (Black plumage) and Phulom (Frizzle), were in a sep-arate group with a node connected to Pradhu Hang Dam. These findings indicated that Bhutanese native chickens should be classified as being genetically close to Southeast Asian domestic chickens; they also showed that Bhutanese Table 3- Genetic variability estimates for 18 microsatellite loci in ten chicken populations.
Population Alleles per locus Heterozygosity dHWEb
Observed Expected
Gallus gallus spadiceus 9.28±0.66 0.47±0.06 0.81±0.02 3
Gallus gallus gallus 9.50±0.59 0.52±0.06 0.82±0.01 2
Seim (Red Junglefowl-like) 9.33±0.72 0.51±0.06 0.82±0.01 0
Yuebjha Narp (Black plumage) 7.94±0.40 0.44±0.05 0.79±0.02 0
Khuilay (Naked neck) 9.50±0.68 0.49±0.05 0.83±0.02 2
Phulom (Frizzle) 8.50±0.57 0.55±0.04 0.81±0.01 0
Pradhu Hang Dam (Black chicken) 9.78±0.69 0.59±0.06 0.83±0.02 0
Chee (White chicken) 10.83±0.85 0.58±0.04 0.84±0.02 2
Broiler 9.28±0.77 0.49±0.06 0.82±0.02 8
White Leghorn 8.67±0.82 0.45±0.06 0.78±0.02 2
The values are the mean±SD.aMean number of alleles per locus;bnumber of loci deviating from Hardy-Weinberg equilibrium.
Table 4- Genetic distances estimated for 10 chicken populations based on allele frequencies.
GS GG SM YN KL PL PD CH BR WH
GS 0.000 GG 0.270 0.000
SM 0.443 0.382 0.000 YN 0.515 0.344 0.418 0.000
KL 0.319 0.272 0.326 0.391 0.000 PL 0.370 0.470 0.350 0.393 0.394 0.000 PD 0.245 0.283 0.346 0.357 0.204 0.401 0.000
CH 0.241 0.237 0.433 0.521 0.392 0.559 0.382 0.000 BR 0.233 0.283 0.381 0.447 0.267 0.439 0.203 0.279 0.000
WH 0.390 0.199 0.413 0.483 0.296 0.465 0.344 0.297 0.372 0.000
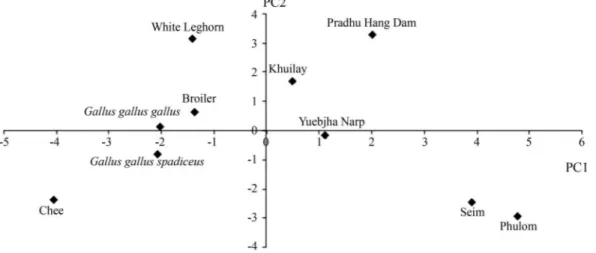
native chickens and Thai native chickens (G. g. domesticus) were related toG. g. spadiceus, the red earlobe Red Junglefowl (Figure 1). The relatedness of Khuilay and Pradhu Hang Dam and the separate genetic group formed by the other Bhutanese native chickens were confirmed in the PCA plot. This plot also showed that commercial broil-ers and the developing line White Leghorn were related to G. g. gallus, the white earlobe Red Junglefowl (Figure 2).
Discussion
Microsatellite allele diversity and population diversity
The results of this study indicate that the selected loci were reliable and informative because more than four al-leles per locus were examined (Nassiriet al., 2007, 2009). Correspondingly, the estimated genetic distances were pre-cise because the standard error was likely to be low (Nassiri et al., 2007). The HEfor all loci was > 0.50 and supported the effectiveness of the selected loci.
The MNA per locus calculated for 10 chicken popula-tions was 14.17± 0.93 and was similar to the value of
14.00±1.69 recorded in 20 chicken breeds based on 14 markers shared with our study (Rosenberget al., 2001). In contrast, our value was greater than the 10.00±1.12 re-ported for 52 chicken populations with 12 shared markers from a set of 22 markers (Hillelet al., 2003), 10.11±0.59 reported for six South African local chicken lines based on nine shared markers (van Marle-Kösteret al., 2008) and 10.33±4.33 reported for six Indian chicken populations based on three markers shared with our study (Piranyet al., 2007). Population-specific alleles and/or allele scoring bias (allele dropout, null alleles) could explain these discrepan-cies in the number of alleles/locus (Nassiriet al., 2007).
Although genetic analyses can reveal the extent of biodiversity in chicken breeds (Nassiriet al., 2007; Semik and Krawczyk, 2011) additional information on specific adaptations, distinct phenotypes, performance level, de-mography (including effective population size, and geo-graphical distribution), and descriptive databases are required for adequate assessment of each breed when de-ciding on conservation and breeding programs (Groeneveld et al., 2010).
Figure 1- A phylogenetic tree based on Nei’s genetic distance DA 309 (Nei, 1978) for ten chicken populations.
The high number of alleles at various loci and the fairly high FISvalues may partly reflect the influence of en-vironmental factors and geographical barriers. Although the mean FISvalue was high, there was no significant devia-tion from HWE in native chickens and Junglefowl chick-ens. On the other hand, eight loci in Broilers and two in White Leghorn deviated from HWE indicating that decades of intensive selection for morphology and production in commercial populations had resulted in genetic subdivi-sion. Some of the loci identified here may be associated with genes that were lost through genetic drift; this could explain why some loci showed strong genetic differentia-tion while others showed only slight drift. However, the mean FSTvalue indicated that subpopulation division was moderate, with 8.4% of the total genetic variation being caused by interpopulation differences while 91.6% corre-sponded to intrapopulation differences.
Comparable population variations were observed for Seim and Khuilay in relation to the original and ancestor fowl populations. Seim chickens are commonly reared by Bhutanese farmers whereas the Khuilay variety has a highly diversified plumage color (soft-red, white, black, partridge and speckled), with possible gene flow from In-dian Naked neck populations. The major concern here relates to the Yuebjha Narp variety, which showed low variation. Possible reasons for this reduced variability in-clude lower morphological diversity and finite population sizes (~20-25 individuals per village). As expected, the HE across the loci for the two subspecies of Red Junglefowl was greater than for White Leghorn and higher than that re-ported by Hillelet al.(2003) and Granevitzeet al.(2007). As shown here, the wild progenitor of domestic chickens contains considerable genetic variation, as also re-ported for Red Junglefowl in northern India (Mukeshet al., 2011). The wild ancestors of major livestock species are important reservoirs of genetic diversity reservoirs but are either extinct or low in numbers (Hanotte and Jianlin, 2005). Consequently, there is a need for a concerted effort to conserve the putative wild ancestors of present-day chickens, particularly because of the increasing habitat loss and fragmentation, as well as poaching, that threaten the wild varieties with extinction. In contrast, commercial lines have been developed from only a few breeds and therefore have a less varied genetic background,i.e., they have less genetic variation than native and Junglefowl populations. Interestingly, the genetic variation seen here was similar to that reported elsewhere (Piranyet al., 2007).
Genetic relationship and phylogenetic trees
The neighbor-joining (NJ) tree constructed from microsatellite data showed that the two Red Junglefowl subspecies, Gallus gallus gallus and Gallus gallus spadiceus, belonged to different subpopulations. The relat-edness of Bhutanese Khuilay (Naked neck) and Thai Pra-dhu Hang Dam revealed the importance of genetic
background in determining heat tolerance. Several reports have demonstrated an association between heat tolerance in Naked neck chickens (Merat, 1986; Yunis and Cahaner 1999;Patra et al., 2002) and the occurrence of heat shock protein 70 (HSP70; Mazzi et al., 2003; Duangdeun, C., 2008, MSc thesis, Khon Kaen University, Thailand). In ad-dition, the highest frequency (~50%) of the HSP70 geno-type associated with heat tolerance was found in Pradhu Hang Dam (Tunim et al., 2010). The phylogenetic tree showed that Khuilay and Broiler chickens were sufficiently genetically similar to suggest that Khuilay chickens may be suitable for meat production, with the advantage that they are heat tolerant. The NJ tree and PCA plot confirmed that Bhutanese Seim (Red junglefowl-like), Yuebjha Narp (Black plumage), and Phulom (Frizzle) varieties were dis-tinguishable from another chicken strains; this distinction highlights the importance of genetic diversity among Bhu-tanese native chickens. The Thai Chee breed may be partic-ularly valuable as a source of genetic variability because it is close to the root of the phylogenetic tree.
The PCA plot provided useful information when the NJ method could not differentiate among closely related chicken populations. This plot showed that three of the Bhutanese native varieties formed a group that fell in a dif-ferent quadrant from Thai native chickens (G. g. domesticus), Red Junglefowl (G. gallus) and commercial lines (G. g. domesticus). This divergence may reflect envi-ronmental adaptation and breeding history (mating system) that affected the genetics of Bhutanese chickens.
In conclusion, this preliminary study of four Bhuta-nese native chicken varieties based on 18 microsatellite loci clearly demonstrated the genetic diversity of these chickens and reinforced the socio-cultural and economic importance of native chickens in Bhutan. In addition, the PCA analysis showed that Bhutanese native chickens are important con-tributors to the general poultry gene pool.
Acknowledgments
References
Goodwin W, Adrian L and Sibte H (2007) An Introduction to Fo-rensic Genetics. John Wiley and Sons, London, 151 pp. Granevitze Z, Hillel J, Chen GH, Cuc NTK, Feldam M, Eding H
and Weigend S (2007) Genetic diversity within chicken populations from different continents and management his-tories. Anim Genet 38:576-583.
Groeneveld LF, Lenstra JA, Eding H, Toro MA, Scherf B, Pilling D, Negrini R, Finlay EK, Jianlin H, Groeneveld E, et al.
(2010) Genetic diversity in farm animals – A review. Anim Genet 41(Suppl 1):6-31.
Hanotte O and Jianlin H (2005) Genetic characterization of live-stock population and its use in conservation decision-making. The role of biotechnology. Proceedings of the Inter-national Workshop, 5-7 March 2005, Villa Gualino, Turin, Italy, pp 131-136.
Hillel J, Martien AM, Groenen AM, Boichard MT, Abraham B, Korol AB, David L, Kirzhner VM, Burke T, Barre-Dirief A,
et al.(2003) Biodiversity of 52 chicken populations assessed by microsatellite typing of DNA pools. Genet Select Evol 35:533-57.
Mazzi CA, Ferro JA, Ferro MT, Savino VJM, Coelho AAD and Macari M (2003) Polymorphism analysis of the hsp70 stress gene in broiler chickens (Gallus gallus) of different breeds. Genet Mol Biol 26:275-281.
Merat P (1986) Potential usefulness of the Na (Naked neck) gene in poultry production. World’s Poult Sci J 42:124-142. Moiseyeva IG, Romanov MN, Nikiforov AA, Sevastyanova AA
and Semyenova SK (2003) Evolutionary relationships of Red Junglefowl and chicken breeds. Genet Select Evol 35:403-423.
Mukesh T, Kalasi RS, Mandhan RP and Sathyakumar S (2011) Genetic diversity studies of Red Junglefowl across its distri-bution range in northern India. Asian J Biotechnol 3:293-301.
Nassiri MTB, Hamid Z and Tavakoli S (2007) The investigation of genetic variation at microsatellite loci in Mazandran na-tive chickens. J Poult Sci 6:675-678.
Nassiry MR, Javanmard A and Tohidi R (2009) Application of statistical procedures for analysis of genetic diversity in do-mestic animal populations. Am J Anim Vet Sci 4:136-141. Nidup K and Tshering P (2007) Status of the family poultry
pro-duction and HPAI in Bhutan. Proceedings of the 8thAsian Pacific Poultry Conference of the World’s Poultry Science Association, Bangkok, pp 78-83.
Nidup K, Penjor A, Dorji P, Gurung R, Arasta P and Moran C (2005) Genetic structure of the native chickens of Bhutan. SAAR J Agric 3:69-89.
Nidup K, Penjor A and Dorji P (2008) Poultry. In: Dorji TY and Tamang S (eds) Animal Genetic Resources of Bhutan. Kuensel Cooperation, Thimphu, pp 26-47.
Nei M (1978) Estimation of heterozygosity and genetic distance from a small number of individuals. Genetics 89:583-590. Patra BN, Bais RKS, Prasad RB and Singh BP (2002)
Perfor-mance of naked neck versus normally feathered colored
broilers for growth, carcass traits and blood biochemical pa-rameters in tropical climate. Asian-Australasian J Anim Sci 15:1776-1783.
Pirany N, Romanov NMN, Ganpule SP, Govindaiah D and Dod-dananjat P (2007) Microsatellites analysis of genetic bio-diversity in India chicken populations. J Poult Sci 44:19-28. Raymond M and Rousset F (1995) GENEPOP ver. 1.2:
Popula-tion genetics software for exact tests and ecumenicism. J Hered 86:248-259.
Rosenberg NA, Burke T, Elo K, Feldman MW, Groenen MAM, Hillel J, MäkiTanila A, Tixier-Boichard M, Vignal A, Wim-mers K,et al.(2001) Empirical evaluation of genetic cluster-ing methods uscluster-ing multilocus genotypes from 20 chicken breeds. Genetics 159:699-713.
Rousset F (2008) Genepop’007: A complete reimplementation of the Genepop software for Windows and Linux. Mol Ecol Res 8:103-106.
Saitou N and Nei M (1987) The neighbor-joining method: A new method for reconstructing phylogenetic trees. Mol Biol Evol 4:406-425.
Semik E and Krawczyk J (2011) The state of poultry genetic re-sources and genetic diversity of hen populations. Ann Anim Sci 11:181-191.
SAS Statistical Analysis Software (1998) User’s Guide: ver. 6.12. SAS Institute Inc., Cary, NC.
Tadano R, Sekino M, Nishibori M and Tsudzuki M (2007) Micro-satellite marker analysis for the genetic relationships among Japanese long-tailed chicken breeds. J Poult Sci 86:460-469. Tunim S, Duangjinda M and Katavatin S (2010) Study of HSP 70 gene polymorphism in various strains of Thai native chick-ens. Khon Kaen Agric J 38(Supplement):71-75.
van Marle-Köster E, Hefer CA, Nel LH and Groenen MAM (2008) Genetic diversity and population structure of locally adapted South African chicken lines: Implications for con-servation. S Afr J Anim Sci 38:271-281.
Weigend S and Romanov MN (2001) Current strategies for the as-sessment and evaluation of genetic diversity in chicken re-sources. World’s Poult Sci J 57:275-288.
Yamamoto Y, Nishibori M, Kinoshita K, Tsunda K, Nimkawa T, Mannen H, Tshering C and Dorji T (2007) Composition of the genes controlling blood groups and morpho-genetic traits of Bhutanese native chickens and its phylogenetic study. Report Soc Res Native Livestock 24:167-178. Yunis R and Cahaner A (1999) The effects of naked-neck (Na)
and frizzle (F) genes on growth and meat yield of broilers, and their interactions with ambient temperatures and poten-tial growth rate. Poult Sci 78:1374-1382.
Internet Resources
FAO Domestic Animal Diversity Information System, http://dad.fao.org/ (January 13, 2011).
Associate Editor: Alexandre Rodrigues Caetano