Auditory evoked potentials: predicting speech
ther-apy outcomes in children with phonological
disor-ders
Renata Aparecida Leite, Hayde´e Fiszbein Wertzner, Isabela Crivellaro Gonc¸alves, Fernanda Cristina Leite Magliaro, Carla Gentile Matas
Faculdade de Medicina da Universidade de Sa˜o Paulo (FMUSP), Physiotherapy, Communications Sciences and disorders and Occupacional Therapy, Sa˜o Paulo/SP, Brazil.
OBJECTIVES: This study investigated whether neurophysiologic responses (auditory evoked potentials) differ between typically developed children and children with phonological disorders and whether these responses are modified in children with phonological disorders after speech therapy.
METHODS:The participants included 24 typically developing children (Control Group, mean age: eight years and ten months) and 23 children clinically diagnosed with phonological disorders (Study Group, mean age: eight years and eleven months). Additionally, 12 study group children were enrolled in speech therapy (Study Group 1), and 11 were not enrolled in speech therapy (Study Group 2). The subjects were submitted to the following procedures: conventional audiological, auditory brainstem response, auditory middle-latency response, and P300 assessments. All participants presented with normal hearing thresholds. The study group 1 subjects were reassessed after 12 speech therapy sessions, and the study group 2 subjects were reassessed 3 months after the initial assessment. Electrophysiological results were compared between the groups.
RESULTS:Latency differences were observed between the groups (the control and study groups) regarding the auditory brainstem response and the P300 tests. Additionally, the P300 responses improved in the study group 1 children after speech therapy.
CONCLUSION: The findings suggest that children with phonological disorders have impaired auditory brainstem and cortical region pathways that may benefit from speech therapy.
KEYWORDS: Central Auditory Pathway Disorders; Auditory Brainstem Evoked Response; Auditory Evoked Potentials; P300 Event-Related Potentials; Articulation Disorders.
Leite RA, Wertzner HF, Gonc¸alves IC, Magliaro FC, Matas CG. Auditory evoked potentials: predicting speech therapy outcomes in children with phonological disorders. Clinics. 2014;69(3):212-218.
Received for publication onJuly 29, 2013;First review completed onAugust 16, 2013;Accepted for publication onSeptember 11, 2013 E-mail: [email protected]
Tel.: (55 11) 3091-8411
& INTRODUCTION
Phonological disorders are the most common speech and language impairments in children, with a prevalence of 8 to 9% (1). Auditory evoked potential (AEP) investigations in children with phonological disorders have shown that these children have altered auditory brainstem responses (ABR) (2) and P300 potentials (3), suggesting the involvement of the central auditory pathway.
Motivated by an interest in identifying auditory proces-sing deficits in children with speech and language disorders
and in monitoring the rehabilitation process, AEPs have been used to assess the auditory pathway in children with language impairments. In fact, many authors have emphasized the importance of using AEPs to promote comprehension of the underlying language impairment neurophysiology and to identify the many changes that occur along the central auditory pathway, some of which are not clinically manifested (4,5).
The AEPs provide information about the neural activity and functional integrity of the auditory pathway in response to an acoustic signal. They are classified as early, middle, and late, according to response latencies (6).
The ABR test is a noninvasive objective test that registers the responses generated by the synchronous firing of structures in the nuclei along the auditory brainstem. This potential is composed of a set of seven waves that appear from 0 to 10 ms after acoustic stimulus presentation (7). The auditory middle-latency response (AMLR) test is composed of a set of positive and negative waves (Na, Pa, Nb, Pb, Nc, Copyrightß2014CLINICS– This is an Open Access article distributed under
the terms of the Creative Commons Attribution Non-Commercial License (http:// creativecommons.org/licenses/by-nc/3.0/) which permits unrestricted non-commercial use, distribution, and reproduction in any medium, provided the original work is properly cited.
No potential conflict of interest was reported.
and Pc) that follow the ABR and are present until 80 ms after acoustic stimulus presentation (8). The generators of these waves include the auditory structures of the middle brainstem, reticular formation, sensory nuclei of the thalamus, and the primary auditory cortex (9). The P300 cognitive potential is an endogenous long-latency auditory evoked potential that appears approximately 300 ms after acoustic stimulus presentation (10). P300 generators are relatively diffuse across the brain and include the auditory cortex, centroparietal cortex, hippocampus, and the frontal cortex (11).
Studies have shown that speech sound perceptions can be modified with training (12-14). Additionally, considering that AEP changes occur before behavioral sound perception improvements, it is possible, through electrophysiologic recordings, to evaluate modifications that occur after speech therapy by practicing a skill or by frequent stimulus exposure due to neuronal plasticity.
Therefore, the aims of the present study were to investigate whether neurophysiologic responses (AEPs) differ between typically developing children and children with phonological disorders and whether these responses are modified in children with phonological disorders after speech therapy.
& MATERIALS AND METHODS
Study design
This prospective research was developed in the Department of Communication Sciences and Disorders Auditory Evoked Potential and Phonology laboratories at the Universidade de Sa˜o Paulo School of Medicine (FMUSP). The project was approved by the institutional Research Ethics Committee (CAPPesq - HC FMUSP) under protocol number 236/03.
Participants
The participants were 47 native Portuguese-speaking children (19 male and 28 female) aged between 8 and 11 years (mean age = eight years and 11 months) who had normal bilateral hearing (pure tone thresholds#15 dB HL for octaves 250-8000 Hz) and type A tympanometry curves (15). The parents or legal guardians of the children signed a free and informed consent form, which allowed participa-tion in the study. The subjects were divided into control (CG) and study groups (SG). The CG comprised 24 typically developing children (five male and 19 female), with a mean age of eight years and 11 months. The SG comprised 23 children with phonological disorders (14 male and nine female), with a mean age of eight years and 10 months. This group was divided into two subgroups: SG1, which was composed of 12 children who were enrolled in speech therapy sessions, and SG2, which was composed of 11 children who were not enrolled in speech therapy but were on the Phonology Lab outpatient care waiting list. Subjects from both subgroups were given an initial electrophysiolo-gical evaluation and a second electrophysioloelectrophysiolo-gical evalua-tion after three months. One child from SG1 abandoned the speech therapy and was not reassessed, and two children from SG2 did not return for their second evaluation.
The SG subjects were referred for electrophysiological assessments by the Phonology Lab and were diagnosed with phonological disorders prior to inclusion in the study. The CG subjects were referred by an elementary school.
Additionally, the CG subjects were selected based on the following criteria: no language and speech disorder com-plaints, no previous enrollment in a speech therapy session, adequate performance in phonology and fluency (16) tests, and adequate performance in reading and writing screening tests.
Stimuli and recording parameters
The children were tested in a soundproof booth. Five silver electrodes were used for the AEP recordings (impedance ,5 kV), which were placed according to the International 10-20 Electrode System (IES) (17). Trials in which artifacts were measured in excess of ¡45mV were rejected from the averaged response calculations. The stimulus was delivered by a PC-based stimulus delivery system (Traveler Express; Bio-logic Systems Corp., Mundelein, IL, USA) using supra-aural earphones (TDH-39).
For the ABR test, a 19.1 clicks per second rate with a 0.1 ms duration was used with a 12 dB/octave filter slope, 100-3000 Hz band pass filter, and 2000 sweeps. Stimuli were presented at 80 dBnHL. The ABR recordings were dupli-cated for reliability. The peaks were marked, and their latencies (waves I, III, and V) and interpeak latencies (I-III, III-V, and I-V) were analyzed.
AMLRs were elicited by click stimuli (rarefaction polarity with a 0.1 ms duration) presented at 70 dBnHL at a 9.9 clicks/s rate. Additionally, a 10-150 Hz band pass filter was used to collect 1000 sweeps. Peaks were marked, and their latencies (waves Na and Pa) and amplitudes (Na-Pa) were calculated.
The P300 testing was performed using tone burst stimuli (alternating polarity, plat 30.00, and a 10.0 rise/fall) at 75 dBnHL and a 1.1 stimuli per second rate. The frequent (80%) stimulus was a 1000 Hz tone, and the rare (20%) stimulus was a 1500 Hz tone. Frequent and rare stimuli were randomized so there was no predictable sequence during the test. A 1-30 Hz band pass filter was used to record 300 stimuli. Each subject was instructed to identify the rare stimuli by raising a hand every time it appeared. The subjects responses to frequent and rare events were time-locked, sorted, and averaged separately. The peak was selected, and its latency (P300) was calculated.
Therapeutic model
The therapeutic model used in the Phonology Lab was adapted from the cycles approach proposed by Hodson and Paden (1991) (18). This approach predicts that phonological acquisition in children with phonological disorders will be gradual, as in typically developing children. During the 12-week cycle, some phonological processes were selected, and minimal pairs to each target sound were presented in weekly sessions. The target phonological process selected was usually the one with the greatest occurrence. Additionally, target sound articulation training was per-formed at the beginning of each session, along with hearing training, which involved delivering the target sound through an earphone.
Data collection and analyses
Speech and language tests
for Brazilian Portuguese and is commonly used for diagnostics in the Phonology Lab. For the CG, phonology and fluency subtests were used. For the SG, vocabulary, pragmatics, phonology, and fluency subtests were used. Additionally, other tests were used to analyze continuous speech, oral motor skills, and phonological processing. The speech samples collected were recorded and later tran-scribed and analyzed.
Electrophysiological evaluations
All electrophysiological evaluation procedures were performed on the same day to avoid interference. After the first electrophysiological evaluation, which included ABR, AMLR, and P300, the SG1 children were admitted to a speech therapy program, which consisted of 12 weekly 45-minute therapy sessions. The established session number represented the period of best progress with the least amount of absences and therefore involved a greater number of consecutive sessions. Children from this sub-group underwent a second electrophysiological evaluation after 12 speech therapy sessions (three months). The SG2 children were also given a second electrophysiological evaluation after a three-month period to ensure that any AEP result improvements observed in the SG1 children were due to neuronal plasticity rather than to maturational aspects.
One child from SG1 abandoned speech therapy and was not reassessed, and two children from SG2 did not return for their second evaluation.
Experienced evaluators manually marked the waves I, III, and V ABR latencies, the AMLR Na-Pa amplitude, and the P300 latency. The evaluators were blinded to the subjects’ identities and diagnostic categories. The mean, median, and standard deviation (SD) values were obtained for the ABR, AMLR, and P300 parameters for both the CG and SG groups. The measures were compared between groups.
Statistical analysis
The ANOVA test was used for the latency and amplitude measurement statistical analyses. Differences between the group and subgroup responses were considered significant whenp#0.05.
& RESULTS
Auditory brainstem response (ABR)
No significant differences were observed between the right and left ears in either group regarding the latency values for waves I, III, and V and interpeaks I-III, III-V, and I-V. Thus, the mean latency values (absolute and interpeak intervals) for each group were determined and compared between the groups.
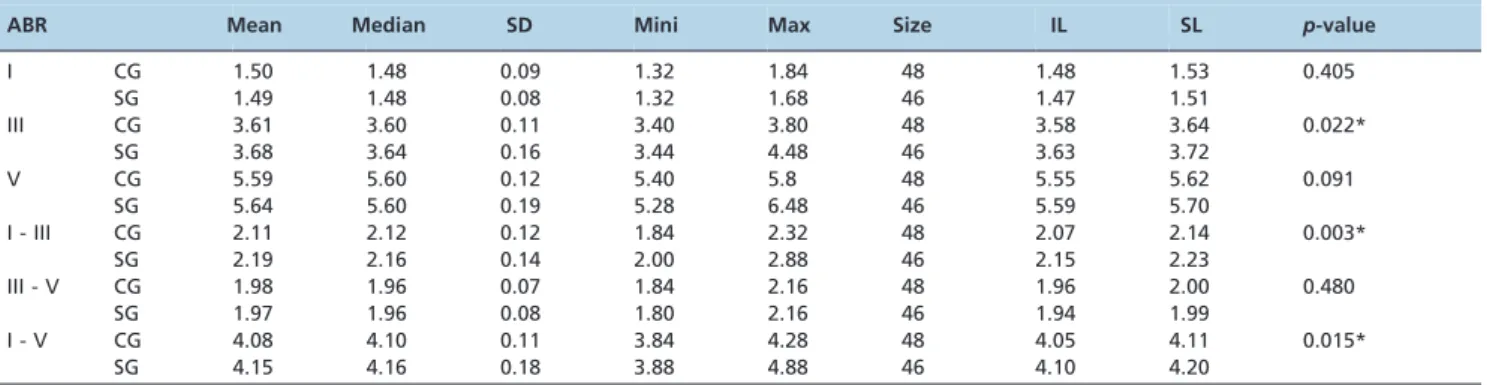
The means, medians, and SD for each wave and the interpeak values for both groups are displayed in Table 1. Statistical analysis showed that the latency values for wave III (p= 0.022) and interpeaks I-III and I-V (p= 0.003 and
p= 0.015, respectively) obtained at the first electrophysio-logical evaluation were significantly longer in the SG compared with the CG.
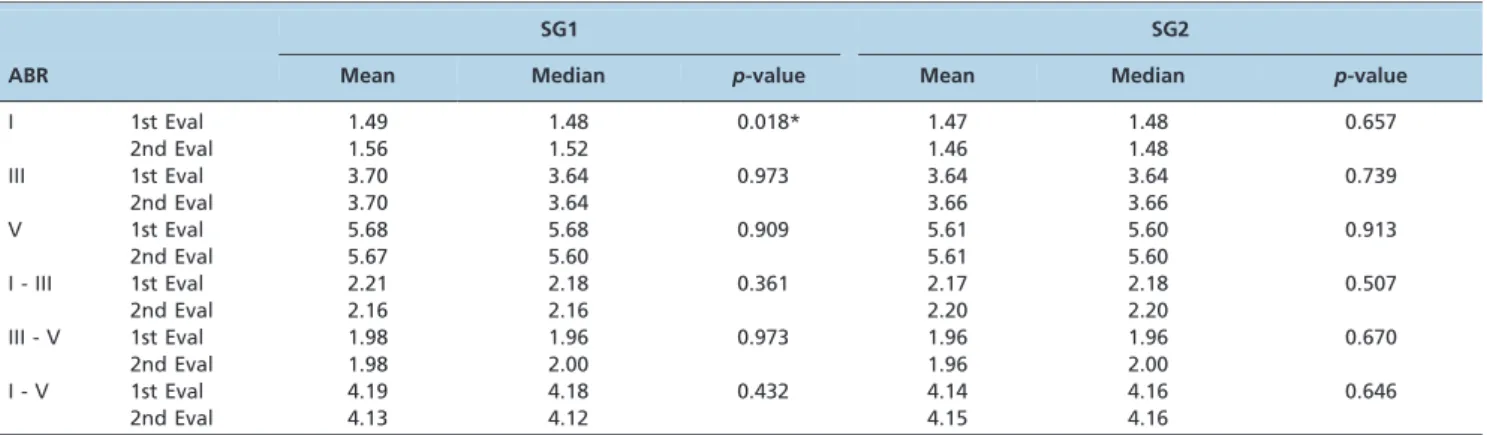
The ABR latency values recorded in the first and second electrophysiological evaluations for subgroups SG1 and SG2 are displayed in Table 2. Statistical analyses demonstrated that the wave I latency in SG1 was significantly shorter in the first electrophysiological evaluation in comparison with the second evaluation. In SG2, no significant latency value differences were observed between the two evaluations (Table 2).
Auditory middle latency response (AMLR)
There were no group differences for AMLR regarding the Na-Pa amplitudes measured during the first electrophysio-logical evaluation (Table 3).
There were also no significant differences observed within the subgroups (SG1 and SG2) between the first and
Table 1 -Control (CG) and study (SG) group comparisons regarding the wave I, III, and V and I-III, III-V, and I-V interpeak ABR latencies.
ABR Mean Median SD Mini Max Size IL SL p-value
I CG 1.50 1.48 0.09 1.32 1.84 48 1.48 1.53 0.405
SG 1.49 1.48 0.08 1.32 1.68 46 1.47 1.51
III CG 3.61 3.60 0.11 3.40 3.80 48 3.58 3.64 0.022*
SG 3.68 3.64 0.16 3.44 4.48 46 3.63 3.72
V CG 5.59 5.60 0.12 5.40 5.8 48 5.55 5.62 0.091
SG 5.64 5.60 0.19 5.28 6.48 46 5.59 5.70
I - III CG 2.11 2.12 0.12 1.84 2.32 48 2.07 2.14 0.003*
SG 2.19 2.16 0.14 2.00 2.88 46 2.15 2.23
III - V CG 1.98 1.96 0.07 1.84 2.16 48 1.96 2.00 0.480
SG 1.97 1.96 0.08 1.80 2.16 46 1.94 1.99
I - V CG 4.08 4.10 0.11 3.84 4.28 48 4.05 4.11 0.015*
SG 4.15 4.16 0.18 3.88 4.88 46 4.10 4.20
CG = Control Group. SG = Study Group.
ABR = Auditory Brainstem Response. *Statistically significant values (p
,0.05). SD = Standard Deviation.
second electrophysiological recorded measurements (Table 4).
Cognitive potential (P300)
No significant differences were observed between the right and left ears in either group regarding the P300 wave latencies. The mean latency was therefore determined for each group for comparisons between groups.
The P300 latency mean, median, and SD values for both groups (CG and SG) are displayed in Table 5. Statistical analysis demonstrated that the wave latency recorded in the first electrophysiological evaluation was significantly longer in the SG than in the CG.
The comparison between P300 wave latency results measured in the first and second electrophysiological evaluations demonstrated significant differences only in SG1, whereby shorter latency values were observed after speech therapy. There was no significant difference between the first and second evaluations in SG2, however (Table 6).
& DISCUSSION
Auditory brainstem response (ABR)
In the ABR latency measurements (wave III and I-III and I-V interpeaks), the SG children presented longer latencies compared with their controls, which suggested an encoding delay at the cochlear nucleus region for the SG (Table 1). These results corroborate previous literature findings that demonstrated that children with phonological disorders have longer ABR wave latencies (waves I, III, and V) compared with typically developing individuals (2). This observation supports our hypothesis that these subjects present abnormal neural synchrony at the brainstem level.
Some studies have demonstrated different results when comparing click ABR results between normal children and those diagnosed with language disorders (i.e., lower amplitudes for waves I, III, and V compared with the control group) (19), learning difficulties (i.e., shorter latencies for wave V and interpeak III-V than the control group) (20), and specific language impairments (i.e.,
Table 3 -The control (CG) and study (SG) group comparisons regarding the AMLR Na-Pa amplitudes in the C3/A1, C4/A1, C3/A2, and C4/A2 modalities.
C3/A1 C4/A1 C3/A2 C4/A2
CG SG CG SG CG SG CG SG
Mean 1.83 2.17 2.08 1.99 1.96 1.91 2.51 2.15
Median 1.59 1.65 1.77 1.75 1.19 1.25 1.54 1.76
Standard Deviation 1.01 2.07 1.44 1.36 2.36 1.90 3.19 2.14
Minimum 0.78 0.36 0.45 0.22 0.27 0.23 0.30 0.20
Maximum 4.78 10.69 6.60 6.76 10.11 8.63 13.46 11.06
Size 24 23 24 23 24 23 24 23
Inferior Limit 1.43 1.32 1.50 1.44 1.01 1.13 1.23 1.27
Superior Limit 2.24 3.01 2.66 2.55 2.90 2.69 3.78 3.02
p-value 0.480 0.832 0.938 0.656
A1 = left mastoid. A2 = right mastoid.
C3 = left temporo-parietal junction. C4 = right temporo-parietal junction. CG = Control Group.
SG = Study Group.
Table 2 -The comparisons between the first and second evaluations regarding the wave I, III, and V and I-III, III-V, and I-V interpeak ABR latencies for subgroups SG1 and SG2.
SG1 SG2
ABR Mean Median p-value Mean Median p-value
I 1st Eval 1.49 1.48 0.018* 1.47 1.48 0.657
2nd Eval 1.56 1.52 1.46 1.48
III 1st Eval 3.70 3.64 0.973 3.64 3.64 0.739
2nd Eval 3.70 3.64 3.66 3.66
V 1st Eval 5.68 5.68 0.909 5.61 5.60 0.913
2nd Eval 5.67 5.60 5.61 5.60
I - III 1st Eval 2.21 2.18 0.361 2.17 2.18 0.507
2nd Eval 2.16 2.16 2.20 2.20
III - V 1st Eval 1.98 1.96 0.973 1.96 1.96 0.670
2nd Eval 1.98 2.00 1.96 2.00
I - V 1st Eval 4.19 4.18 0.432 4.14 4.16 0.646
2nd Eval 4.13 4.12 4.15 4.16
ABR = Auditory Brainstem Response. *Statistically significant values (p
,0.05). 1st Eval = 1st evaluation.
increased waves III and V latencies compared with the control group) (21). Among these findings, longer latencies and reduced wave amplitudes were more frequently observed. Such findings show that children with phonolo-gical disorders present lengthening of ABR waves’ latencies more often than typically developing children, suggesting different brainstem auditory pathway functions. We empha-size that the wave III and the I-III and I-V interpeak latencies in children with phonological disorders are within the normal range.
The comparison between ABR waves and interpeak latencies obtained before and after the speech therapy sessions verified a significant difference only for the SG1 wave I latency. In contrast, no differences were observed in SG2 for the variables analyzed (Table 2). Notably, the wave I latency was within the normal limits in both assessments for all SG1 individuals. It is believed, therefore, that this ABR difference pre and post therapy in the SG1 can actually be considered a normal latency lengthening and should not be regarded as a change due to stimulation.
Auditory middle latency response (AMLR)
There was no significant differences between groups regarding the obtained AMLR results. These results, however, do not corroborate the literature findings, which report that children with speech and language disorders or learning difficulties present altered AMLR amplitudes (19,22) and Pa latency values (23).
A potential limitation of the present study is that the subjects were not given auditory processing behavioral assessments. It is possible, therefore, that the CG children also presented with auditory processing disorders, which could have been responsible for the AMLR result altera-tions.
Considering the mean age of both groups, the altered AMLR results might have been due to maturation in the auditory pathway (24,25). AMLR alterations in children younger than 10 years old do not necessarily indicate abnormality because the Na and Pa waves are not fully formed until 10-12 years of age (25). As previously mentioned, the adult AMLR standard is reached between 8 and 10 years of age (24); therefore, findings obtained in younger children should be carefully interpreted. Thus, caution should be used in AMLR data evaluations for diagnostic purposes in children entering the maturation phase.
Cognitive potential (P300)
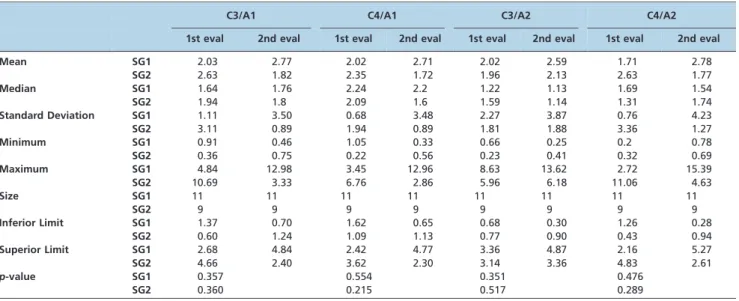
Several studies have employed different long-latency auditory evoked potential types to evaluate children with language disorders, often finding latency and amplitude alterations (8,19,22,26,27). Our results indicated that chil-dren with phonological disorders have abnormal auditory pathway neural coding. These results corroborate literature findings that reported longer latencies and decreased P300 amplitudes in children with phonological disorders (3). Another study observed that this population presented increased P300 latencies and decreased N2 component Table 4 -The comparisons between the first and second evaluations regarding the AMLR Na-Pa amplitude for subgroups SG1 and SG2 in the C3/A1, C4/A1, C3/A2, and C4/A2 modalities.
C3/A1 C4/A1 C3/A2 C4/A2
1st eval 2nd eval 1st eval 2nd eval 1st eval 2nd eval 1st eval 2nd eval
Mean SG1 2.03 2.77 2.02 2.71 2.02 2.59 1.71 2.78
SG2 2.63 1.82 2.35 1.72 1.96 2.13 2.63 1.77
Median SG1 1.64 1.76 2.24 2.2 1.22 1.13 1.69 1.54
SG2 1.94 1.8 2.09 1.6 1.59 1.14 1.31 1.74
Standard Deviation SG1 1.11 3.50 0.68 3.48 2.27 3.87 0.76 4.23
SG2 3.11 0.89 1.94 0.89 1.81 1.88 3.36 1.27
Minimum SG1 0.91 0.46 1.05 0.33 0.66 0.25 0.2 0.78
SG2 0.36 0.75 0.22 0.56 0.23 0.41 0.32 0.69
Maximum SG1 4.84 12.98 3.45 12.96 8.63 13.62 2.72 15.39
SG2 10.69 3.33 6.76 2.86 5.96 6.18 11.06 4.63
Size SG1 11 11 11 11 11 11 11 11
SG2 9 9 9 9 9 9 9 9
Inferior Limit SG1 1.37 0.70 1.62 0.65 0.68 0.30 1.26 0.28
SG2 0.60 1.24 1.09 1.13 0.77 0.90 0.43 0.94
Superior Limit SG1 2.68 4.84 2.42 4.77 3.36 4.87 2.16 5.27
SG2 4.66 2.40 3.62 2.30 3.14 3.36 4.83 2.61
p-value SG1 0.357 0.554 0.351 0.476
SG2 0.360 0.215 0.517 0.289
A1 = left mastoid. A2 = right mastoid.
C3 = left temporo-parietal junction. C4 = right temporo-parietal junction.
Table 5 -The control (CG) and study (SG) group comparisons regarding the P300 latencies in the first electrophysiological evaluation.
P300 Control Group Study Group
Mean 341.29 373.20
Median 330.00 382.00
Standard Deviation 46.68 59.50
Minimum 282.00 266.00
Maximum 484.00 464.00
Size 48 45
Inferior Limit 328.09 355.82
Superior Limit 354.50 390.58
p-value 0.005*
*Statistically significant values (p
amplitudes, suggesting that neurophysiologic functioning in these children differs from that of typically developing children (27).
Nevertheless, other authors observed no significant Mismatch Negativity differences between children with and without phonological disorders. Notably, this evalua-tion also tests long latency auditory-evoked potentials (28). Additionally, another study reported altered results in children with learning difficulties (22). The authors of the latter study suggested that these alterations could be related to auditory discrimination difficulties that are due to a central auditory pathway deficit and therefore do not depend on the child’s voluntary response or attention.
Another study indicated correlations between the tem-poral aspects of brainstem-evoked responses and cortical asymmetry for the processing of speech sounds (29). These results reinforced the idea that the timing deficits reflected by electrophysiological brainstem measurements could affect cortical acoustic information processing.
In the present research, as in the others studies, increased latency values were the most frequent P300 alteration observed in children with language disorders (8,30).
Cortical auditory processing may be modified by several stimuli types, and these modifications can be quantified by AEP measures (31). Our results indicated modifications in the cortical auditory region, as evidenced by decreased P300 values only in the children who received speech therapy. Likewise, a previous study reported P300 wave latency improvements in children with central auditory processing disorders that received therapeutic interventions (32).
The P300 modifications observed after speech therapy can also be attributed to the neuronal plasticity phenomenon (33). According to the literature, three plasticity types can occur in the auditory pathway, including developmental plasticity, compensatory plasticity (resulting from an injury to the auditory pathway), and learning-related plasticity (14). The shorter P300 latency observed only in the group given speech therapy suggests that the plasticity type evidenced in the present study was learning-related plasticity.
Our P300 findings corroborate other studies (12,34) that suggest that speech perception skills can be improved by training and that post-training improvements may be assessed by measuring auditory evoked potentials (12). Several perceptual learning studies have shown that auditory behavioral training improves auditory discrimination skills
due to the expansion of cortical representations to the stimuli used during training (34).
The present study results indicate that children with phonological disorders present longer P300 latencies com-pared with typically developing children. This suggests that the cortical auditory pathway functions differently in children with phonological disorders and that they can benefit from speech therapy to improve their auditory abilities.
The Auditory Brainstem Response (ABR) and P300 results in the present study suggest that children with phonolo-gical disorders have auditory pathway impairments in the brainstem and cortical regions. Furthermore, the P300 potentials may improve with speech therapy.
& ACKNOWLEDGMENTS
This study received financial support in the form of a Masters research grant from the Sa˜o Paulo Research Foundation (Fundac¸a˜o de Amparo a` Pesquisa do Estado de Sa˜o Paulo - FAPESP; process no. 03/02722-1).
& AUTHOR CONTRIBUTIONS
Leite RA, Matas CG, and Magliaro FC participated in manuscript conception, design, data analysis and interpretation, drafting, and final approval of the published version. Leite RA, Matas CG, Magliaro FC, Gonc¸alves IC, and Wertzner HF participated in drafting the manuscript and critically revising it for important intellectual content. Leite RA participated in data acquisition. Additionally, we confirm that all authors sufficiently participated in the conception and design of the work, data analysis, and manuscript writing, and they take public responsibility for it.
& REFERENCES
1. Law J, Boyle J, Harris F, Harkness A, Nye C. Prevalence and natural history of primary speech and language delay: findings from a systematic review of the literature. Int J Lang Commun Disord. 2000;35(2):165-88.
2. Gonc¸alves IC, Wertzner HF, Samelli AG, Matas CG. Speech and non-speech processing in children with phonological disorders: an eletro-physiological study. Clinics. 2011;66(2):293-8, http://dx.doi.org/10. 1590/S1807-59322011000200019.
3. Leite RA, Wertzner HF, Matas CG. Long latency auditory evoked potentials in children with phonological disorder. Pro´-Fono Revista de Atualizac¸a˜o Cientı´fica. 2010;22(4)561-6, http://dx.doi.org/10.1590/S0104-56872010000400034.
4. Wible B, Nicol T, Kraus N. Correlation between brainstem and cortical auditory processes in normal and language-impaired children. Brain. 2005;128(2):471-23.
5. Abrams D, Kraus N. Auditory pathway representation of speech sound in humans. In: Katz J, Hood L, Burkard R, Medwetsky L (Ed). Handbook of Clinical Audiology. Baltimore: Lippincott. Williams & Wilkins; 2009. p.611-26.
Table 6 -The comparisons between the first and second evaluations regarding the P300 latencies for subgroups SG1 and SG2.
P300 SG1 SG2
1st evaluations 2nd evaluations 1st evaluations 2nd evaluations
Mean 394.73 361.82 349.65 358.00
Median 407 363 330.00 336.00
Standard Deviation 54.24 37.66 60.68 54.94
Minimum 306 300 266.00 280.00
Maximum 464 430 442.00 472.00
Size 22 22 17 17
Inferior Limit 372.06 346.08 320.80 331.88
Superior Limit 417.39 377.56 378.49 384.12
p-value 0.024* 0.677
*Statistically significant values (p
6. Picton TW, Hillyard AS, Kraus HI, Galambos R. Human auditory evoked potentials. Electroencephalor Clin Neurophysiol. 1974;36(2):179-90, http:// dx.doi.org/10.1016/0013-4694(74)90155-2.
7. Durrant JD, Ferraro JA. Potenciais auditivos evocados de curta lateˆncia: eletrococleografia e audiometria de tronco encefa´lico. In: Musiek FE, Rintelmann WF. Perspectivas atuais em avaliac¸a˜o auditiva. Sa˜o Paulo: Manole; 2001. p.193-238.
8. Musiek FE, Lee WW. Potenciais auditivos de me´dia e longa lateˆncia. In: Musiek FE & Rintelmann WF. Perspectivas Atuais em Avaliac¸a˜o Auditiva. Barueri: Manole; 2001. p.239-67.
9. Kraus N, Kileny P, McGee T. Potenciais auditivos evocados de me´dia lateˆncia (MLR). In: Katz J. Tratado de Audiologia Clı´nica 4aed. Sa˜o
Paulo: Manole; 1999. p.384-402.
10. Sutton S, Braren M, Zubin J, John ER. Evoked potential correlates of stimulus uncertainty. Science. 1965;150(3700):1187-8, http://dx.doi.org/ 10.1126/science.150.3700.1187.
11. McPherson DL. Late potentials of the auditory system (evoked potentials). San Diego: Singular Press; 1996.
12. Kraus N. Speech sound perception, neurophysiology, and plasticity. Int J Pediatr Otorhinolaryngol. 1999;47(2):123-9, http://dx.doi.org/10. 1016/S0165-5876(98)00130-X.
13. Kraus N. Auditory pathway encoding and neural plasticity in children with learning problems. Audiol Neurootol. 2001;6(4):221-7, http://dx. doi.org/10.1159/000046837.
14. Musiek FE, Shinn JMS, Hare CMA. Plasticity, auditory training, and auditory processing disorders. Semin Hear. 2002;23:265-75, http://dx. doi.org/10.1055/s-2002-35862.
15. Loyd LL, Kaplan H. Audiometric interpretation: a manual of basic audiometry. Baltimore: University Park Press; 1978.
16. Andrade CR, Be´fi-Lopes DM, Fernandes FDM, Wertzner HF. ABFW teste de linguagem infantil nas a´reas de fonologia, vocabula´rio, flueˆncia e pragmatica. Carapicuiba. Pro´-Fono; 2000.
17. Jasper HH. The ten-twenty electrode system of the international federation. Electroenc Clin Neurophysiol. 1958;10:371-5.
18. Hodson BW, Paden EP. Targeting intelligible speech: a phonological approach to remediation. 2aed. Texas: Austin; 1991. p.190.
19. Mason SM, Mellor DH. Brain-stem, middle latency and late cortical evoked potentials in children with speech and language disorders. Electroencephalogr Clin Neurophysiol. 1984;59:297-309, http://dx.doi. org/10.1016/0168-5597(84)90047-9.
20. Purdy SC, Kelly AS, Davies MG. Auditory brainstem response, middle latency response, and late cortical evoked potentials in children with learning disabilities. J Am Acad Audiol. 2002;13(7):367-82.
21. Basu M, Krishnan A, Weber-Fox C. Brainstem correlates of temporal auditory processing in children with specific language impairment. Developmental Science. 2010;13(1):77-91, http://dx.doi.org/10.1111/j. 1467-7687.2009.00849.x.
22. Kraus N, McGee TJ, Carrel TD, Zecker SG, Nicol TG, Koch DB. Auditory Neurophysiologic responses and discrimination deficits in children with learning problems. Science. 1996;273(5277):971-3, http://dx.doi.org/10. 1126/science.273.5277.971.
23. Arehole S, Augustine L, Simadri R. Middle latency response in children with learning disabilities: preliminary findings. J Commum Disord. 1995;28(1):21-38, http://dx.doi.org/10.1016/0021-9924(94)00004-J. 24. Hall III JW. Handbook of auditory evoked potential. Boston: Allyn and
Bacon; 1992.
25. Musiek FE, Gollegly KM. Maturational considerations in the neuroau-ditory evaluation of children. In: Bess H. Bess editor. Hearing impairment in children. Maryland: York Press; 1988. p.230-50. 26. Musiek FE, Bornstein S. Contemporary aspects of diagnostic audiology.
Am J Otolaryngol. 1992;13(1):23-33.
27. Advı´ncula KP, Frizzo ACF, Costa EG, Santos PAG, Griz S. Estudo dos potenciais evocados auditivos de longa lateˆncia em crianc¸as com desvios fonolo´gicos. In: 20˚Encontro Internacional de Audiologia; 2005; Sa˜o Paulo. Anais. Sa˜o Paulo; 2005.
28. Roggia SM. O processamento temporal em crianc¸as com distu´rbio fonolo´gico [tese]. Sa˜o Paulo: Faculdade de Medicina da Universidade de Sa˜o Paulo; 2003.
29. Abrams DA, Nicol T, Zecker SG, Kraus N. Auditory brainstem timing predicts cerebral asymetry for speech. J Neurosci. 2006;26(43):11131-7, http://dx.doi.org/10.1523/JNEUROSCI.2744-06.2006.
30. Tonnquist-Uhlen I. Topography of auditory evoked long-latency potentials in children with severe language impairment: the P2 and N2 components. Ear Hear. 1996;17(4):314-26, http://dx.doi.org/10.1097/ 00003446-199608000-00003.
31. Gilbert CD. Learning and receptive field plasticity. Proc Natl Acad Sci U S A. 1996;93(20):10546-47, http://dx.doi.org/10.1073/pnas.93.20. 10546.
32. Jirsa RE. The clinical utility of the P3 AERP in children with auditory processing disorders. J Speech Hear Res. 1992;35(4):903-12.
33. Grafman J. Conceptualizing functional neuroplasticity. J Commun Disord. 2000;33(4):345-55; quiz 355-6, http://dx.doi.org/10.1016/S0021-9924(00)00030-7.