UNIVERSIDADEDE SÃO PAULO
INSTITUTO DE FÍSICA DE SÃO CARLOS
WAGNER RAFAEL CORRER
Development of impedimetric DNA sensor for diagnosis of Human
Papillomavirus type 18 infection
WAGNER RAFAEL CORRER
DEVELOPMENT OF IMPEDIMETRIC DNA SENSOR FOR DIAGNOSIS OF HUMAN
PAPILLOMAVIRUS TYPE 18 INFECTION
Dissertation presented to the Graduate Program in Physics at the Instituto de Física de São Carlos, Universidade de São Paulo to obtain the degree of Master of Science.
Concentration area: Applied Physics Option: Biomolecular Physics
Advisor:
Prof. Dr. Valtencir Zucolotto
ORIGINAL VERSION
THE AUTHOR AUTHORIZES TOTAL OR PARTIAL REPRODUCTION AND DISSEMINATION OF THIS DISSERTATION, BY CONVENTIONAL OR ELECTRONIC MEDIA FOR STUDY OR RESEARCH PURPOSE, SINCE IT IS
REFERENCED.
Correr, Wagner Rafael
Development of impedimetric DNA sensor for diagnosis of Human Papillomavirus type 18 infection / Wagner Rafael Correr; advisor Valtencir
Zucolotto -- São Carlos, 2014. 88 p.
Dissertation (Master - Programa de Pós-Graduação em Física Aplicada Biomolecular) -- Instituto de Física de São Carlos, Universidade de São Paulo, 2014.
FOLHA DE APROVAÇÃO
Wagner Rafael Correr
Dissertação apresentada ao Instituto de Física de São Carlos da Universidade de São Paulo para obtenção do título de Mestre em Ciências.
Área de Concentração: Física Aplicada - Opção: Física Biomolecular.
Aprovado(a) em: 17/12/2014
Comissão Julgadora
Prof(a). Dr(a). Valtencir Zucolotto
Instituição: IFSC/USP
Dr(a). Cristiane Sanchez Farinas
Instituição: EMBRAPA/São Carlos
Dr(a). Natalia Mayumi Inada
ACKNOWLEDGEMENTS
I wish to thank to my advisor Prof. Dr. Zucolotto for accepting me as his student. I am also grateful for working in your lab and with your students. Thank you.
A special thanks to Dr. Juliana Cancino. Thank you for introducing me to the electro-chemistry, for the experimental tips and sharing your experience.
Thanks mother and father! Without your effort and hardworking I would be nowhere. Thanks for your support and love. You were my first teachers and I will carry your principles along my entire life. Thanks to my brother and sisters for teaching me how to be an older brother.
I wish to thank my labmates for their patience in my cleaning and organising days. Thanks to Camilo, Lilian, Valéria, Brazacca, Ribovski, Olavo, Cris Melo, Fabrício, and De-nise, for sharing your doubts, your knowledge and experiences. I also wish to thank Maria Freitas, who have helped me with electrochemical experiments and reviewed my entire work. You really have helped me in this last step. I would also like thank Dr. Eliane Trovatti for her friendship and for kindly reviewing this document.
I cannot forget my friends Adriana Almeida, Pedro Mattia, Ricardo Boffa, Flávio Cavadas, and Miriam Muniz, for all good moments we have shared. A special thanks to Heloisa Muniz for her help, companionship and specially patience.
A kind thanks to the former technicians Patrícia and Júlia from Biophysics Group for their help in the lab. A special thanks to Bel who, like a mother, always found the lost glass-ware, reagents and accessories.
Whethe o e is ich o poo , educated o illite ate, eligious o
nonbelieving, man or woman, black, white, or brown, we are all the
same. Physically, emotionally, and mentally, we are all equal. We all
share basic needs for food, shelter, safety, and love. We all aspire to
happiness and we all shun suffering. Each of us has hopes, worries,
fears, and dreams. Each of us wants the best for our family and loved
ones. We all experience pain when we suffer loss and joy when we
achieve what we seek. On this fundamental level, religion, ethnicity,
cultu e, a d la guage ake o diffe e ce.
ABSTRACT
CORRER, WR. Development of impedimetric DNA sensor for diagnosis of Human
Papillomavirus type 18 infection. 2014. 88p.Dissertation (Master in Science) - Instituto de
Física de São Carlos, Universidade de São Paulo, São Carlos, 2014.
Currently, the most common strategy employed to detect DNA sequences is PCR (Poly-merase Chain Reaction). Nevertheless, in the last few years research on DNA biosensors has increased significantly. Such sensors represent an alternative to PCR in the detection of spe-cific DNA sequences, once they exhibit fast response, low limits of detection, and require simpler sample preparation. The development of a biosensor for detection of DNA from Human Papillomavirus type 18 is reported. To immobilise DNA probe onto indium-tin oxide (ITO) electrodes, a silanisation was carried out using 3-Aminopropyltryethoxysilane (APTES). Silanisation was studied and optimised using ultra-violet absorption spectroscopy, atomic force microscopy, fluorescence microscopy, and cyclic voltammetry. After immobilisation, the hybridisation with target sequence is detected by changes in surface properties of ITO electrode by Cyclic Voltammetry and Electrochemical Impedance Spectroscopy, using the Ferri-Ferrocyante redox couple. The detection of synthetic target sequence was performed in the range of 12.5 to 100 nM, and 300nM for PCR products. The sensor did not show sig-nificative response for non-complementary sequence at 50 nM. This sensor can be applied for fast and low cost detection of HPV genetic material at nanomolar levels.
RESUMO
CORRER, WR. Desenvolvimento de um sensor de DNA impedimétrico para o diagnóstico de
infecção por Papilomavirus Humano tipo 18.2014. 88p. Dissertação (Mestrado em Ciências)
- Instituto de Física de São Carlos, Universidade de São Paulo, São Carlos, 2014.
A estratégia mais empregada atualmente na detecção de sequência de DNA é a PCR (Reação em Cadeira da Polimerase). Contudo, nos últimos anos, a pesquisa em biossensores de DNA tem aumentado significativamente. Estes sensores representam uma alternativa a PCR na detecção de sequências específicas de DNA, uma vez que exibem resposta rápida, baixos li-mites de detecção e requerem preparação simples da amostra. Nesta dissertação descrito o desenvolvimento de um biossensor para a detecção do DNA do Papilomavirus Humano tipo 18. A fim de imobilizar a sequência de captura de DNA em eletrodos de óxido de estanho e índio (ITO), realizou-se uma silanização usando 3-Aminopropiltrietoxisilano (APTES). A rea-ção de silanizarea-ção foi estudada e otimizada através das técnicas de Espectroscopia de Absor-ção Ultravioleta, Microscopia de Força Atômica, Microscopia de Fluorescência e Voltametria Cíclica. Após a imobilização, a hibridização com a sequência alvo é detectada através de alte-rações nas propriedades de superfície do eletrodo através de Voltametria Cíclica e Espec-troscopia de Impedância Eletroquímica, usando o par redox Ferri-ferrocianeto. A detecção da sequência alvo sintética foi realizada no intervalo de 12.5 a 100 nM, e para o produto de PCR, 300 nM. O sensor não demonstrou resposta significativa para sequência não comple-mentar a 50 nM. Este sensor pode ser aplicado na detecção rápida e de baixo custo de mate-rial genético do HPV a níveis nanomolares.
LIST OF FIGURES
Figure 1 - Global incidence of cervical cancer cases in 2012. Estimated age-standardised rates per 100,000. ... 26
Figure 2 - Pap smear workflow. Squamous Lesion includes LSIL, HSIL and carcinoma in situ. ASCUS, atypical cells of undetermined significance; CIN, cervical intraepithelial neoplasia; Adapted from (18) ... 28
Figure 3 - The evolution of cervical disease is related to an increase in the levels of HPV mRNA, which justifies the use of such molecules to early detect neoplasia caused by HPV. ... 30
Figure 4 - Scheme of a biosensor. After recognition by bioreceptor, the signal is transduced and translated to electrical signal for data acquisition. ... 31
Figure 5 - Classification of biosensors based on their bioreceptor and transducers,. Below, it is highlighted the most common techniques in electrochemical biosensing. ... 33
Figure 6 - Scheme of a DNA biosensor. After hybridisation, the signal transduction can be carried out by different techniques. Electrical and electrochemical transduction are the simplest because the signal is already electronic, relieving the use of sensors or signal converters. ... 34
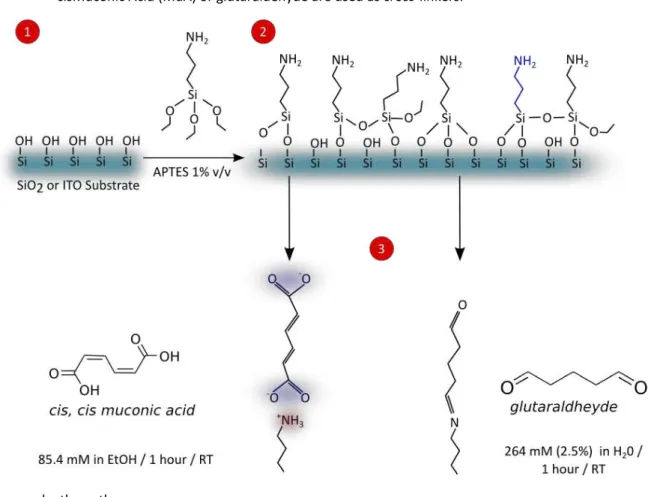
Figure 7 - Scheme of substrate silanisation and crosslinking reactions.ITO or Quartz surface bearing hydroxyl groups reacts with the aminosilane APTES, leading to formation of a silane layer. Such layer contains terminal amino groups, whose are able to react with crosslinker groups. Cis, cisMuconic Acid (MuA) or glutaraldehyde are used as cross-linkers. ... 44
Figure 8 - Chemical representation of 5'-Amino modified DNA. The curvy line at the right of the molecule represents any DNA sequence. ... 45
Figure 9 - Scheme of the strategy on DNA immobilisation and detection.Surface is activated with amino silane APTES and crosslinker. DNA probe containing
amino group at 5’ end reacts with crosslinker groups. Target DNA hybridises with probe DNA. ... 46
Figure 10 - Fluorescein Isothiocyanate (FITC) molecular structure and Excitation-Emission spectra. ... 48
Figure 11 - Slide holder designed to use in Absorbance Spectroscopy and Fluorescence Spectroscopy ... 50
Figure 12 - Scheme of HPV 18 genome: Structural genes, L1 and L2 (). Viral regulatory proteins, E1 to E7, (). Inset: Annotation of primers (), probe sequence (), and target sequence () on original genome strands ... 54
Figure 13 - UV absorption spectroscopy of the steps used in DNA immobilisation. ... 56
Figure 15 - Time optimisation of DNA immobilisation. (A) UV absorption spectra obtained for 1-6h silanisation time and (B) the same spectra corrected for light scattering. . 58
Figure 16 - UV absorbance obtained for optimisation of APTES time. (A) UV absorption spectra measured for 3 APTES concentrations plus negative control; (B) the same spectra corrected for light scattering; (C) Microstructures formed during reaction of APTES in toluene 1% (v/v) during 1 hour. (D) A slide placed in toluene (APTES free) does not exhibit the microstructures. ... 59
Figure 17 - Fluorescence Microscopy of silanised quartz slides. ... 61
Figure 18 - Fluorescence Microscopy of silanised quartz slides modified with Muconic Acid (MuA). ... 62
Figure 19 - Fluorescence Microscopy of silanised quartz slides modified with Glutaraldehyde. ... 63
Figure 20 - Atomic Force Microscopy (AFM) of silanised quartz slides using distinct solvents. (A) Acetone (B) Chloroform (C) Ethanol (D) Toluene. Colour scale in all images was scaled from 0 to 15 nm... 64
Figure 21 - Topographic AFM of silanisation on quartz using toluene as solvent. On this scanning area, it is noticeable the micro structure observed in section $$ responsible for light scattering... 65
Figure 22 - Diagram of a mechanism for silane layer growth.MPTMS concentration of (a) 5mM, (b) 20mM, and (c) 40mM. Adapted from Hu et al(85). ... 66
Figure 23 - Cyclic Voltammetry in bare ITO electrodes (red lines) and APTES modified electrodes (black lines) using different solvents: (A) Acetone (B) Chloroform (C) Ethanol (D) Toluene. All vertical axes are in the same scale to facilitate the comparison between solvents. ... 67
Figure 24 - A) Scheme of reduction-oxidation of electrochemical probe. B) Cyclic Voltammetry of ITO surface modification prior to DNA immobilisation: APTES silanised ITO (—) and MuA modified APTES layer (—).C) Scheme of electron hampering caused by MuA immobilisation. ... 70
Figure 25 - Cyclic Voltammetry of NH2-DNA immobilisation. Previous steps are maintained to facilitate comparison ... 71
Figure 26 - Hybridisation of target DNA after electrode modification. Target DNA significantly alters the voltammetric response of ITO electrode... 71
Figure 27 - Calibration curve using Current Density of reduction peak obtained from Cyclic Voltammetry. Full mismatch at 50 nM and blank (no target) values are also shown. ... 72
Figure 29 - Calibration curve of versus target concentration using EIS. ... 74
Figure 30 - Cyclic voltammetry and EIS spectra of blank measurement ... 75
Figure 31 - Cyclic voltammetry and EIS spectra of full mismatch sequence at 50 nM ... 75
Figure 32 - PCR from HPV18 target sequence. The amplicon band, slightly heavier than 100 bp, is observed with no background or secondary fragments formation. ... 76
LISTOF TABLES
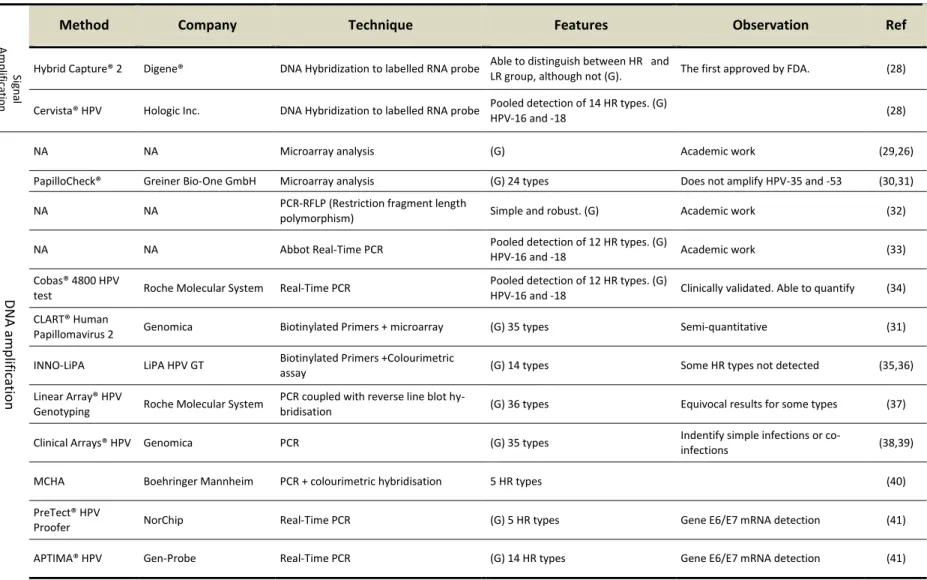
Table 1 - Methods available to HPV diagnosis based on the review of Abreu et al.(25) (G)
stands for “able to genotype”, NA: non-applicable ... 29
Table 2 - Literature review of electrochemical biosensors for HPV diagnosis ... 39
Table 3 - List of reagents used in this work, including their manufacturer and part number. . 41
Table 4 - Conditions used to amplify target DNA from HPV 18 genome ... 48
Table 5 - Equations for roughness parameters ... 51
Table 6 - Oligoanalyser and BLAST results for selected DNA probe ... 55
Table 7 - Summary of selected references on silanisation using APTES for DNA
immobilisation. All silanisation reactions were conducted at room temperature. *mixture of APTES and nBTMS ... 60
Table 8 - Roughness parameters calculated from AFM images of silanised substrates and for bare quartz ... 64
Table of contents
23
1
Introduction
1.1 Cancer and Infectious Diseases in modern Public Health
The beginning of 21st century has been marked by a wide variety of outbreaks: Avian Influenza (H5N1), Swine Influenza (H1N1), Dengue, Cholera, and more recently, Ebola. Nev-ertheless, innovation and advances in science as well as the dissemination of information by specialized international entities has allowed a rapid and effective outbreak control. The availability of information is, probably, one of the most important tools in modern public health, where World Health Organisation (WHO) develops a central role. For example, be-fore 1990 there was not consistent source of global information about injuries and risk fac-tors for infectious diseases. To overcome this gap, the World Bank and the WHO, in 1991, started a collaborative study named Global Burden of Disease.(1) In 1998, the Centre for Disease Control and Prevention (CDC) developed a comprehensive plan for the prevention and control of emerging infectious threats.(2) Government, researchers, universities, and hospitals provided with these studies and information can plan and develop actions for the effective control of diseases and outbreaks.
Before the use of antibiotics and public programs in vaccination, infectious diseases used to be the leading cause of death. Despite the success in treatment and control of such diseases, they still represent a main public health issue worldwide. Lower respiratory infec-tions, HIV/AIDS and diarrhoeal diseases figure among the top ten causes of death world-wide.(3) The WHO estimates that 57 millions of deaths occurred worldwide in 2013, of which 13 million (22.8%) have been caused by infectious diseases. According to the same report, while the major cause of death is attributed to coronary diseases, which are responsible for roughly 3 in 10 deaths in the globe, countries with low and medium-income still present a great mortality rate resulting from infections. In low-income countries, the top three causes of death are, respectively, lower respiratory infections, HIV/AIDS, and diarrhoeal diseases. Malaria occupies the sixth position and tuberculosis the eighth.(4)
24
countries.(5) GLOBOCAN is an extensive study about cancer executed every four years by the International Agency for Research on Cancer (IARC), a specialised agency of the WHO.
In GLOBOCAN 2012 study, it was found that there were 32.6 million people living with cancer worldwide within 5 years of diagnosis, 14 million new cases of cancer, and 8.2 million deaths caused by it,(5) being one among the top ten causes of death.(3)
Cancer had been considered a problem of developed countries, although this sce-nario has changed over the last few decades. Currently, the developing countries also pre-sent a high incidence of cancer, where it is the third or fourth more common cause of death in middle-income countries.(5,3) Fifty seven percent of new cancer cases are diagnosed and 65% of deaths occur in the less developed regions of the world. However, incidence and mortality rates vary globally due to many different risk factors. For example, in developed regions the cancer mortality of men is about 50% of that in less developed regions. In US, cancer is the second most common cause of death and it is expected that, in 2014, about half million of North Americans die due to cancer.(6)
In Brazil, in the last few decades, there has been a change in mortality causes. The occurrence of deaths caused by infectious diseases has diminished while chronic and degen-erative diseases have been arising as the major cause of death. It is expected 395,000 new cancer cases just in 2014. Apart from non-melanoma skin cancer, the most frequent cancer types in men are prostate, lung, colon and stomach; in women: breast, colon, cervix and lung.(7)
1.2 Human Papillomavirus (HPV) and Cervical Cancer
Some infectious agents, mainly viruses, seem to strongly influence the development of certain types of human cancer. These viruses are frequently referred to as oncoviruses or oncogenics. Among then, we can highlight HIV, hepatitis B and C, HPV, T-lymphotropic vi-ruses, Epstein-Barr virus (EBV), and herpes virus type 8. According to Parkin,(8) 17.8% of all cancer cases are caused by infectious agents, and this fraction is about 25% in developing regions.
25
than two hundred known types of HPV and the types 16,18, 31, 33, 35, 39, 45, 51, 52, 56, 58, 59 and 66 are known for their carcinogenicity.(8,9) These high risk HPV types are responsible for nearly 10% of all cancers in women and 5% in men.(10)
The most prevalent viral infection of the reproductive tract is caused by HPV. Humans sexually active may be infected anytime in their lives. Cervical cancer is frequently attributed to a persistent HPV infection. In fact, since the 90s it is widely accepted that a persistent HPV infection is a necessary condition for this cancer type.(11,8) Currently, all cervical cancer cases are attributed to infection of certain types of HPV, whereHPV16 and HPV18 are re-sponsible for nearly 70% of them.(12) Moreover, high-risk HPV types are also attributed to some types of vaginal,(13) vulvar,(14) anal,(15) and penile(16) cancers.
Cervical cancer is the fourth most frequent and the third greatest cause of death by cancer in women. Figure 1 shows the cervical cancer incidence worldwide in 2012, when half-million new cases were diagnosed. The highest rate of incidence and mortality of cervi-cal cancer is found in Eastern and Middle Africa. The less developed regions present a high occurrence of cervical cancer, being responsible for nearly 85% of new cases diagnosed in world and for 87% of all deaths. In these areas, 12% of all female cancer cases are due to cervical cancer.(5)
HPV was responsible for 4.8% of cancer caused by infectious agents in 2008(12) and it caused more than 250 thousand deaths in 2012,(5) of which 87% occurred in developing re-gions. In Brazil, it is expected 15.3 cases per 100 thousand women for cervical cancer, result-ing in an estimative of 15 thousand new cases in 2014.(7)
26
1.3 Methods for HPV Infection diagnosis
Most of HPV types are harmless and only produce benignant dysplasia, as warts, on skin or genital areas. Nevertheless, high-risk HPVs generate lesions in squamous epithelia which may develop into invasive squamous cell carcinoma.(17) Thus, the persistence of a squamous epithelial lesion is the first clinical evidence of a possible HPV infection or dyspla-sia. The development of such lesions is driven by the changes in host cell due to viral integra-tion and replicaintegra-tion, and detailed oncogenesis mechanism, as well as their molecular basis are beyond the scope of this work, and can be found on the review of Münger et al.(17)
Despite cytological abnormalities naturally disappear in more than 85% of patients,(18) the persistence of such lesions, also referred to chronic infection, leads to de-velopment of invasive cervical cancer.(18,19) Usually, women are infected early in their lives (20) and approximately 20 years are necessary for cervical cancer to develop in women with normal immune systems.(9) Although HPV infection is a necessary condition for cervical can-cer development, it is not sufficient. Risk factors include: ageing, smoking, use of oral con-traceptive, number of sexual partners, and immunodeficiency(11,21). The early diagnosis of
Figure 1 - Global incidence of cervical cancer cases in 2012. Estimated age-standardised rates per 100,000.
27
HPV infection is highly advantageous, because the evolution of cervical lesions can be closely monitored and habits can be changed to avoid cancer or treat it in early stages.
Currently, cervical cancer diagnosis is made by cytological evaluation and visual in-spection of mucosa and tissues. The most widely method used for both screening and diag-nosis is the cervical cytology screening, commonly known as Papanicolau Smear Test*. In this test, cervical cells are collected using a proper swab, followed by staining with Papanicolau stain. Introduced in 1942 and widely modified since then, this staining method uses 4 or 5 staining agents to reveal different cellular structures, depending on fabricant. However, the basic staining is performed in three steps: firstly, haematoxylin solution is used to stain the nuclei; on the second step, cytoplasm is stained by orange-G agent, demonstrating the ma-turity of keratinised cells; finally a mixture of two or three agents (polychromatic solution) is used to differentiate squamous cells.(22)
After staining, a qualified cytologist† observes the cells under a light microscope. Re-cently, automated imaging analysis has been also used to pre-screen the samples.(23) Cells are classified according to their morphology and abnormalities, using the Bethesda System.(24) For squamous cells, the possible abnormalities are:
Atypical squamous cells of undetermined significance (ASC-US) Low grade squamous intraepithelial lesion (LSIL)
High grade squamous intraepithelial lesion (HSIL) Squamous cell carcinoma
If a squamous lesion is detected, a colposcopy is performed. In colposcopy exam, a specialised binocular microscope (colposcope) is used to perform visual inspections on cervix and vagina. Through analysis vascularisation, shape, size and colour of the lesions, the health care worker can classify them, and, if necessary, demand a biopsy. A workflow of Pap Screen described diagnosis is presented in Figure 2.
*
Also known as Pap smear, Pap test or Pap screen
28
Source: adapted from Gravitt, P. E. et al.(18)
Despite the decrease in cervical cancer incidence due to Pap Screening, HPV-related cervical lesions are still a problem for health-care systems. Low specificity of screening tests and considerable variability in cervical dysplasia diagnosis are the major flaws of this screen-ing system.(25) Moreover, in case of detection of atypical cells of undetermined significance (ASC-US) in Pap test, a screening for HPV should be performed. Therefore, there is a demand to efficiently detect HPV infections on clinical samples, and several methods are being re-ported.
Nowadays, there are two biochemical methods used to detect HPV approved by FDA: Digene Hybrid Capture assay (HC2) and polymerase chain reaction (PCR).(18) Besides these, there is still a considerable number of methods that can be used, for example, Papil-loCheck®, COBAS®4800 HPV, The Linear array®, CLART® Human Papillomavirus, INNO-LiPA, Clinical arrays® HPV among others that have shown an good performance for the detection of precancerous lesions of the HPV infection.(25,26) In Table 1, the current available meth-ods for clinical diagnosis of HPV infection are presented. This table is based on the review of Abreu et al.(25)
The methods PreTect® HPV Proofer and APTIMA® HPV use viral mRNA to perform the detection of HPV infection. As the squamous disease progress towards neoplasia, the level of viral mRNA is increased. Because these methods rely on the mRNA detection during viral replication, the rate of false positive is significantly decreased.(27)
Figure 2 - Pap smear workflow. Squamous Lesion includes LSIL, HSIL and carcinoma in situ. ASCUS, atypical cells of undetermined significance; CIN, cervical intraepithelial neoplasia; Adapted from (18)
Pap Screen
Normal
ASC-US
Squamous
Lesion Colposcopy HPV positive AnnualScreen
ing
HPV negative
CIN-2/3 or cancer Normal or CIN-1
Do Pap and HPV test at 3-6 months
until 2 normal consecutive
results
29
Table 1 - Methods available to HPV diagnosis based on the review of Abreu et al.(25) G sta ds fo a le to ge ot pe , NA: o -applicable
Ref (28) (28) (29,26) (30,31) (32) (33) (34) (31) (35,36) (37) (38,39) (40) (41) (41) Source: by the author
Observation
The first approved by FDA.
Academic work
Does not amplify HPV-35 and -53 Academic work
Academic work
Clinically validated. Able to quantify Semi-quantitative
Some HR types not detected Equivocal results for some types Indentify simple infections or co-infections
Gene E6/E7 mRNA detection Gene E6/E7 mRNA detection
Features
Able to distinguish between HR and LR group, although not (G). Pooled detection of 14 HR types. (G) HPV-16 and -18
(G) (G) 24 types Simple and robust. (G)
Pooled detection of 12 HR types. (G) HPV-16 and -18
Pooled detection of 12 HR types. (G) HPV-16 and -18
(G) 35 types (G) 14 types (G) 36 types (G) 35 types 5 HR types (G) 5 HR types (G) 14 HR types
Technique
DNA Hybridization to labelled RNA probe DNA Hybridization to labelled RNA probe Microarray analysis
Microarray analysis
PCR-RFLP (Restriction fragment length polymorphism)
Abbot Real-Time PCR Real-Time PCR
Biotinylated Primers + microarray Biotinylated Primers +Colourimetric assay
PCR coupled with reverse line blot hy-bridisation
PCR
PCR + colourimetric hybridisation Real-Time PCR Real-Time PCR Company Digene® Hologic Inc. NA
Greiner Bio-One GmbH NA
NA
Roche Molecular System Genomica
LiPA HPV GT
Roche Molecular System Genomica
Boehringer Mannheim NorChip
Gen-Probe
Method
Hybrid Capture® 2 Cervista® HPV NA
PapilloCheck® NA
NA
Cobas® 4800 HPV test
30
Except for the latter two methods, all methods are based on viral DNA detection. Hy-brid Capture® 2 (HC2) and Cervista® HPV work on signal amplification based on chemilumi-nescence and fluorescence, respectively, from a DNA hybridisation event. All remaining tests presented in Erro! Fonte de referência não encontrada. are based on DNA amplification. Genotyping is important when diagnosing HPV infection, since some types are harmless and a false positive, in this case, can cause unnecessary treatment for patient. Thus, most of available methods are able to differentiate between high risk and low risk groups, even indi-vidually identifying them among several types. The major drawback in the HC2 method is precisely the absence of genotyping.(28) The tests based on real-time PCR can quantify or semi-quantify the viral load in the samples. However, most of them only provide positive or negative response to HPV infection.
Despite the described techniques described above are implemented in health sys-tems and are recognized as efficient, they have some limitations. The poor sensitivity and specificity are some of the disadvantages of Pap smear, the most common test. Also, the time consuming, expensive instrumentation, specific apparatus and requirement of an ex-pert to analyze the data of the conventional and new biomolecular techniques difficult their wide implementation in health systems.(42)
In the low income countries, 85% of new cases of cervical cancer are diagnosed and approximately 87% of deaths occur due to this cancer type. In these countries, there are low specialized personnel and limited sources and, therefore, a need to accessible, low-cost and portable technology, in order to reach the entire population, using minimal amount of sam-ple. In fact, low cost, rapid response and simple methods are required. To overcome this
Figure 3 - The evolution of cervical disease is related to an increase in the levels of HPV mRNA, which justifies the use of such molecules to early detect neoplasia caused by HPV.
31
gap, sensors and biosensors, which present the required prerequisites, may be an alternative to traditional biomolecular methods.
1.4 Biosensors
Research in biosensor is an interdisciplinary field, including areas as physical-chemistry, analytical physical-chemistry, biophysical-chemistry, physics, biology, and medicine. The definition of the term biosensor may suffer little variations depending on the expertise of the author. Nevertheless, all definitions agree that biosensor is an analytical device which converts an event detected by a biological recognition element into a quantifiable and processable sig-nal.(43)
These sensors are constituted by biological recognition elements, transducer ele-ments and a signal processor to analyse the signal. Recognition eleele-ments typically used in biosensors may be proteins, such as enzymes or antibodies, nucleic acids, cells and receptors or even a tissue. The transducer element is responsible for translating the biochemical signal from the recognition element into a measurable signal. According to the physical-chemical property detected, resulting from the interaction with the bioreceptor,(44) transduction processes can be classified as: optical, electrochemical, thermometric, piezoelectric, mag-netic and micromechanical. A scheme of a biosensor is presented in Figure 4.
Figure 4 - Scheme of a biosensor. After recognition by bioreceptor, the signal is transduced and translated to electrical signal for data acquisition.
32
The main concepts of biosensors were elucidated in 1962 by Leyland C. Clark with his innovative work on the detection of glucose in human samples from patients with diabetes. The significant advance observed currently in the area of biosensors has been extensive, and the commonly cited advantages of biosensors are: specificity, rapid response, control and automation, low volume of samples required. Beyond doubt, the major advantage is the specificity due to uniqueness and complex recognition event of molecular coupling, as anti-bodies with their targets or DNA with their complementary sequence.
1.5 Classification of Biosensors
Typically, biosensors are classified based on the bioreceptor or the transducer, or even on the bioreceptor coupled with the transducer. Several classification schemes can be structured to elucidate all the possibilities.(45)
Bioreceptors are the biological recognition elements or a living biological system, more specifically molecular species that utilizes a biochemical mechanism for recognition. The most common categories of biosensors, based on bioreceptors are: enzymes, nucleic acids/DNA, antibody/antigen, cellular structures/cells and biomimetic materials.
33
Figure 5 - Classification of biosensors based on their bioreceptor and transducers,. Below, it is highlighted the most common techniques in electrochemical biosensing.
Source: adapted from the reference Velusamy, V. et al.(45)
34
1.6 DNA biosensors
DNA biosensors are a subclass of sensors characterised by the use of DNA as a biore-ceptor or recognition element .This category of biosensor is currently denominated Genosensor or DNA biosensor. DNA biosensors take advantage of the very specific binding of complementary nucleic-acid sequences, commonly relying on the immobilisation of a single stranded nucleic acid probe on a surface to recognise its complementary nucleic acid target sequence by hybridisation.(46)
The majority of DNA biosensors involve the immobilization of a DNA or DNA-analogue probe, such as Peptidic Nucleic Acid (PNA), onto a transducer surface and the sub-sequent hybridisation with complementary target sequence. Several types of transduction can be carried out to detect this hybridisation event (Figure 6). Commonly, the amount of target is proportional to the level of hybridization and, therefore, the signal intensity.(47)
DNA sequences have been being manipulated in laboratory for over 50 years and the DNA chemistry is well known. Functional groups can be added at the end of DNA sequences and DNA immobilisation is commonly practiced. There are specialised companies in synthe-sising DNA sequences with several functionalities. Moreover, DNA is a more stable molecule than protein, its purification from biological or clinical samples is easier, hybridisation is a
Figure 6 - Scheme of a DNA biosensor. After hybridisation, the signal transduction can be carried out by different techniques. Electrical and electrochemical transduction are the simplest because the signal is already electronic, relieving the use of sensors or signal converters.
35
fast and reversible event, and the sensor can be regenerated. As a consequence, DNA sen-sors offer fast detection, are cost effective, simpler, easy to handle and stable.
Despite that, there are several variables that can affect the hybridisation on the strate surface where probe sequence is immobilised. Physical-chemical properties of sub-strate, type and length of linkers, density and orientation of probes, type and length of probes and hybridisation conditions are the factors that can influence sensor response.(48)
Currently, there are several methodologies to measure the transduction of the hy-bridization event. If light is used to detect or produced in the hybridisation, the transduction is made by optical signal, and opto-biochemical techniques can be used. Techniques such as fluorescence,(49) chemiluminescence,(50) and colourimetry(51,52) are common in DNA bi-onsensing.
Surface Plasmon Resonance (SPR)(53) or Surface-Enhanced Raman Scattering spec-troscopy (SERS)(54) are some of the emerging methods with high sensitivity and great po-tential in analytical sciences. The SERS is based on amplification of Raman Effect by a nanos-tructured metallic surface, where single molecule can be detected,(55,56) mainly to the sig-nal enhancement factor, typically 1010. The resonance of surface electrons at an interface is the basis of SPR technique, where the shift in the angle of an incident light beam is caused by changes in the surface plasmon frequency due to adsorption of molecules. For DNA sen-sors based on these techniques, subfemtomolar levels of target DNA can be detected.(57)
Mass-sensitive detection, such as quartz crystal microbalance sensors(58) and micro-cantilever sensors(59) are also applicable to DNA detection. These are based on a shift in vi-brational resonance frequency of a piezoelectric crystal or a cantilever, respectively, which can be related to mass adsorption. Detection of femtomolar DNA levels can be achieved with these types of sensor.
36
1.7 Electrochemical DNA biosensors
Electrochemical detection of biomolecules relies on physical-chemical changes gen-erated during recognition by bioreceptors. Changes in electric current, potential or imped-ance can be measured in recognition process. Moreover, other processes than biorecogni-tion can influence the electrochemical signal, leading to an increase in noise. Examples in-clude, structural/orientation changes, non-covalent interaction and diffusion of molecules.(61)
The DNA probe is a sequence designed to capture the target DNA in solution. Usually, the DNA probe is immobilised onto the electrode surface and subsequently hybridised with complementary target. Detection of DNA is strongly dependent on hybridisation success, and since the DNA is negatively charged, the hybridisation process needs to overcome the electric repulsion between complementary strands. The concentration of counter-ions, the temperature, and the hydrogen bonding are responsible for the stability of DNA pairing.(61) Therefore, the presence of DNA molecules near the electrode surface alters the charge den-sity and accessibility of electrolytes to electrode. As a consequence, electrochemical proper-ties of the electrode are altered and DNA hybridisation can be monitored by electrochemical techniques.
Electrochemical transduction of DNA hybridization can be divided in label-free or la-belled methodologies. Usually in Iabel-free methods, the oxidation of DNA bases is detected electrochemically, due to unique electrochemical redox properties of such bases. Therefore, in label-free methods, signal comes from the hybridisation by itself, without any addition of electroactive species.(62) However the electrochemical oxidation of DNA can be affected by hybridisation conditions.(61) DNA-intercalating molecules can be used to contour this prob-lem by generation of their own redox signal.
In labelled detection, redox probes are used and they can be immobilised onto the working electrode, on the referenced probe, or be in solution, as ferro-ferricyanate complex ([Fe(CN)6]4-/3-). The hybridization between the probe and the target can be electrochemically
37
1.8 Literature review for HPV electrochemical DNA sensor
Different approaches have been applied for the diagnosis and screening of HPV infec-tion. Disadvantages of traditional methods caused a demand in new technologies, requiring faster and effective results and that can be made available anywhere in the world. Biosen-sors, more concretely electrochemical DNA biosenBiosen-sors, are devices with a wide application and several advantages. Characteristics like high sensitivity, low cost, portability, small sam-ple volume required, make this type of biosensor an excellent method for diagnosis of HPV infection.
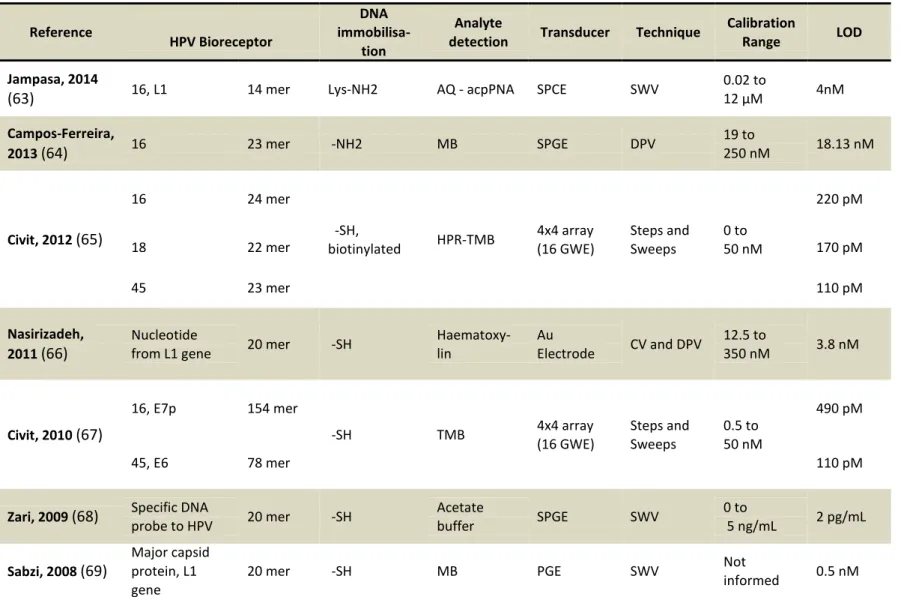
The more recent report in the literature was carried out by Jampasa et al., in
2014.(63) In their report, an electrochemical biosensor for the detection of HPV type 16 DNA was developed using a PNA probe. Screen-printed carbon electrodes were used in Square Wave Voltammetry detection, using anthraquinone (AQ) as redox-active label. Limit of de-tection was found to be 4nM and their sensor was also tested in real sample for dede-tection of HPV type 16.
Another innovative DNA sensor for HPV16 was described by Campos-Ferreira et al, 2013.(64) In their work, L-cystein was electrodeposited on screen-printed gold electrode. Then, a HPV16 probe was immobilized and measurements were obtained by Differential Pulse Voltammetry, based on the reduction signal of methylene blue (MB), obtaining a de-tection limit of 18.12 nM.
Genotyping of HPV 16, 18 and 45, was proposed by Civit et al., in 2012,(65) using an electrochemical array. In their work, thiol modified DNA probes were immobilised on an ar-ray of 16 gold working electrodes. Detection was carried out in a sandwich format with a horseradish peroxidase-labelled secondary probe by Steps and Sweeps technique. The limit of detection ranged from ca. 100 to 200pM.
In the biosensor developed by Nasirizadeh et al.,(66) Cyclic Voltammetry and Differ-ential Pulse Voltammetry were used to detect a 20-mer sequence from L1 gene. An al-kanethiol DNA probe self-assembled gold electrode was used to hybridise with target DNA, and electrochemical signal of hematoxicylin was exploited, leading to a limit of detection of 3.8 nM.
de-38
tection process was carried out by the reduction of tetramethylbenzidine (TMB) label, using steps and sweeps technique. The limit of detection was obtained in the pM range.
Zari et al, 2009,(68) reported a label-free approach. The DNA hybridised on a screen-printed gold electrode (SPGE) was treated with hydrochloric acid. A limit of detection of 300 fM was achieved measuring the oxidation of released purine bases by Square Wave Volt-ammetry.
Sabzi and co-workers(69) described the electrochemical immobilisation of a 20-mer probe related to the HPV major capsid protein L1, onto a pencil graphite electrode (PGE). Square Wave Voltammetry measurements were carried out using methylene-blue as a label since it stacks between DNA base pairs, resulting in a limit of detection of 0.5 nM.
39
Table 2 - Literature review of electrochemical biosensors for HPV diagnosis
LOD 4nM 18.13 nM 220 pM 170 pM 110 pM 3.8 nM 490 pM 110 pM 2 pg/mL 0.5 nM
Notes about abbreviations: SPCE (screen-printed carbon electrode); SPGE (screen-printed gold electrode); GWE (gold working electrode); PGE (pencil graphite electrode); MB (methylene blue); TMB (tetramethylbenzidine); HRP (Horseradish peroxidase); DPV (Differential Pulse Voltam-metry); SWV (Square Wave Voltammetry). Source: by the author
Calibration Range 0.02 to μM 19 to 250 nM 0 to 50 nM 12.5 to 350 nM 0.5 to 50 nM 0 to 5 ng/mL Not informed Technique SWV DPV Steps and Sweeps
CV and DPV
Steps and Sweeps SWV SWV Transducer SPCE SPGE 4x4 array (16 GWE) Au Electrode 4x4 array (16 GWE) SPGE PGE Analyte detection
AQ - acpPNA
MB HPR-TMB Haematoxy-lin TMB Acetate buffer MB DNA immobilisa-tion Lys-NH2 -NH2 -SH, biotinylated -SH -SH -SH -SH HPV Bioreceptor 14 mer 23 mer 24 mer 22 mer 23 mer 20 mer 154 mer 78 mer 20 mer 20 mer 16, L1 16 16 18 45 Nucleotide from L1 gene
16, E7p
45, E6
Specific DNA probe to HPV
Major capsid protein, L1 gene Reference Jampasa, 2014 (63) Campos-Ferreira, 2013 (64)
Civit, 2012 (65)
Nasirizadeh, 2011 (66)
Civit, 2010 (67)
Zari, 2009 (68)
40
1.9 Objectives
The strategy for the detection of HPV18 DNA comprises three steps: immobilisation of probe DNA onto working ITO electrode, hybridisation of target HPV DNA, and the electro-chemical signal measurement, either voltammetric or impedimetric.
Several methods have been described to achieve DNA immobilisation onto solid sub-strates.(70) Among them, silanisation is widely used because the availability of silane mole-cules with distinct functional groups. In this work an aminosilane (APTES) covalently reacts to ITO electrode to generate active amino groups onto its surface. The cross-linker is used to bind the probe DNA onto the electrode. A detailed description of DNA probe immobilisation is given in section 2.4.1. Charge density and accessibility to electrolyte, among other proper-ties, are affected by the hybridisation of immobilised probe with target DNA. In this work, the electrochemical signal from ferro-ferricyanate complex ([Fe(CN)6]4-/3-) is used to access
the information contained in the surface of ITO electrode. Silanisation and DNA immobilisa-tion are studied and results are shown from secimmobilisa-tion 3.2 and 3.5.
41
2
Experimental Section
2.1 Chemicals and Materials
The reagents were used as received, with no further purification (Table 3). All solu-tions were prepared with ultra pure water, MiliQ® process (model MegaUP, Megapurity), with resistivit g eate tha . MΩ/ .
Table 3 - List of reagents used in this work, including their manufacturer and part number.
Material Part Number Manufacturer
(3-A i op op l t ietho sila e ≥ . % A3648 Sigma Aldrich
Acetone 99.5% A1017.01.BJ Synth
Ammonium Hydroxide 28.0-30.0% 221228 Sigma Aldrich
Chloroform 99.8% C1062.01.BJ Synth
cis,cis-Muconic acid, 98% 297760025 Acros Organics
Ethanol 99.5% A1084.01.BL Synth
Ethidium bromide solution 10 mg/ml in H2O E1510 Sigma Aldrich
Fluorescein 5(6)-isothiocyanate≥ . % F3651 Sigma Aldrich
Glutaraldehyde 25% in H2O G6257 Sigma Aldrich
H d oge Pe o ide ≥ % P2233.01.BJ Synth Potassiu Chlo ide ≥ . % P5405 Sigma Aldrich
Potassium hexacyanoferrate(II) trihydrate≥ . 5% 455989 Sigma Aldrich
Potassium phosphate monobasic ≥ . % P9791 Sigma Aldrich
“odiu Chlo ide ≥ . % 746398 Sigma Aldrich “odiu Phosphate Di asi ≥ . % S5136 Sigma Aldrich
Toluene 99.9% 8608-2 Mallinckrodt
Source: by the author
Glass slides (25 x 75 x 1.1 mm) coated in one side with Indium Tin Oxide (ITO), with rectangular surface resistivity ( ) of 8- Ω/sq were acquired from Delta Technologies, USA. The slides were cut in 25 x 5 mm sections and used in electrochemical measurements as working electrodes.
42
2.2 Substrate cleaning
The cleanliness and activation of the substrate surface is an essential step in sensor development. The substrates were cleaned as follows:
ITO - After sectioning, ITO electrodes were sonicated using an ultrasound cleaner (Ul-traCleaner 1600, Unique, Brazil) in the following solvents: acetone, isopropyl alcohol, etha-nol and deionised water, 2 minutes each. The last step was repeated, and the ITO slides were dried with nitrogen.
Quartz - After sectioning, quartz slides were cleansed with RCA method. Briefly, a
so-lution containing ammonium hydroxide and hydrogen peroxide in water (1:1:5) was heated to 75-80 °C. The slides were immersed for 10 minutes in this solution. Following that, the slides were immersed for 10 minutes in a solution of hydrochloric acid and hydrogen perox-ide in water (1:1:5) at 75-80 °C. The slperox-ides were then rinsed in copious amounts of deionised water and dried in nitrogen.
2.3 DNA sequence choice
To determine the target sequence for HPV 18 detection, several available strains ge-nomes were aligned using the open source software ClustalX with its standard configuration.
Once a conserved sequence is determined, it is useful to test it for hairpin structures and self-dimer formation. It is also necessary to calculate the melting temperature (Tm) of DNA
sequence, once this is useful information in DNA hybridisation assays. To perform the calcu-lations, the on-line OligoAnalyser® 3.1 Tool from Integrated DNA Technologies (IDT®, USA) was used. Based on physic-chemical model of DNA molecule, as well as empirical data, this tool is able to calculate several properties of small DNA sequences.
43
The genomes alignments were performed using BLAST (Basic Local Alignment Search Tool, National Centre for Biotechnology Information - NCBI). Briefly, the BLAST is an align-ment tool that searches parts of the query in a database and it returns the best scored alignments. It is possible to choose between a protein or nucleotide input, the output can be displayed in different ways, and there are multiple options for optimisation and refinement. The searches were limited to non-redundant nucleotides database (nrBlast), using the possi-ble target as a query. In most cases filters were applied to limit the search to an organism or gender.
2.4 DNA Immobilisation
DNA immobilisation is an import matter in biosensor development, since biosensor sensitivity and selectivity rely on orientation, coverage, surface chemical properties, accessi-bility, and stability of DNA immobilised probe.(72) In this section it is presented the strategy used for DNA immobilisation as well as the experimental procedures to achieve it.
2.4.1 Strategy
In this section is presented the three main steps towards DNA immobilisation onto quartz slides or ITO electrodes. Firstly, the surface must be cleansed and activated to gener-ate hydroxyl groups (Figure 7, step 1). Thereafter, the surface is chemically activgener-ated to gen-erate reactive amino groups, which are used to react with the crosslinker molecules. It is used an organosilane molecule bearing an amino group, as schematised in step 2 on Figure 7. The following step is called cross-linking (Figure 7 step 3), and a bifunctional molecule is used to promote the linkage between the aminosilane and the DNA probe. The final step is the DNA immobilisation onto the activated surface.
Silanisation - After cleaning, quartz slides or ITO electrodes were placed to react with
a solution of (3-Aminopropyl)triethoxysilane(APTES). Concentration was varied, as well as silanisation time and solvent, as described in section 2.4.2. This step leads to formation of a silane layer bearing amino groups onto ITO surface.
Cross-linking -Muconic Acid (MuA) or glutaraldehyde were tested as cross-linkers.
sub-44
strates during 1 hour. Glutaraldehyde was allowed to react during the same time, although its concentration was 265 mM in water.
DNA attachment - DNA se ue e ith 5’-Amino modification (NH2-DNA) (Figure 8)
was acquired from Integrated DNA Technologies (IDT®, USA) in a synthesis scale of 100 nmol. Further information about sequence choice can be found in section 2.3. Amino modi-fied DNA is also referred to DNA probe, or simply probe, along this dissertation. Activated substrates (Figure 9-1) were allowed to react overnight with 1 µM NH2-DNA in PBS 0.15M,
pH 7.4. After DNA immobilisation (Figure 9-2), substrates were thoroughly rinsed in deion-ised water and dried in nitrogen.
Figure 7 - Scheme of substrate silanisation and crosslinking reactions.ITO or Quartz surface bearing hydroxyl groups reacts with the aminosilane APTES, leading to formation of a silane layer. Such layer contains terminal amino groups, whose are able to react with crosslinker groups. Cis, cisMuconic Acid (MuA) or glutaraldehyde are used as cross-linkers.
45
After these steps, the sensor is ready for hybridisation with target sequence. The storage conditions and sensor shelf lifetime was not tested. Either synthetic target sequence (IDT®, USA) or PCR produced target were tested for detection. Synthetic DNA was diluted in PBS 0.15 M, pH 7.4 in several concentrations. PCR product (2.9 µM) was diluted in PBS buffer 0.15 M, pH 7.4, to300nM, heated to 96 °C and rapidly cooled in an ice bath. This heating-cooling process intends to denaturise double stranded DNA, in order to increase hybridisa-tion efficacy onto electrode. Denaturised target DNA is placed to hybridise with immobilised probe for 1 hour at room temperature (Figure 9-3).
Figure 8 - Chemical representation of 5'-Amino modified DNA. The curvy line at the right of the molecule represents any DNA sequence.
46
2.4.2 Optimisation
2.4.2.1 Silanisation reaction time
The influence of silane reaction time on DNA immobilisation was studied. Quartz slides were silanised with1% APTES (v/v) in toluene for 1, 2, 4, and 6 hours. After thoroughly rinsing with water, quartz slides were placed in a MuA 85 mM solution for 1 hour, and finally
Figure 9 - Scheme of the strategy on DNA immobilisation and detection.Surface is activated with amino silane APTES and crosslinker. DNA p o e o tai i g a i o g oup at 5’ e d eacts with crosslinker groups. Target DNA hybridises with probe DNA.
47
reacted with NH2-DNA 1µM overnight. UV Absorbance Spectroscopy was used to
qualita-tively evaluate the immobilised DNA.
2.4.2.2 APTES concentration
Quartz slides were silanised 2 hours under varied APTES concentrations. The APTES concentrations were 0.5%, 1.0%, and 1.5% (v/v), which are equivalent* to21 mM, 42mM, and 64mM, respectively. After rinsing with water, quartz slides were placed in an85 mM MuA solution for 1 hour. Finally the functionalised quartz slides reacted with amino modified DNA 1µM overnight. Qualitative evaluation of the immobilised DNA was performed using UV Absorbance Spectroscopy.
2.5 Study of the solvent influence on silane layers
Silanisation was performed using four distinct solvents: Acetone, Chloroform, Etha-nol, and Toluene. APTES concentration was maintained at 1% (v/v) and silanisation time was fixed to 2 hours. Silane layers were characterised through Fluorescence Microscopy and Atomic Force Microscopy (section 2.8). Moreover, Cyclic Voltammetry measurements were performed to characterise the electrochemical behaviour of the silanised surface.
For Fluorescence Microscopy measurements, silanised quartz slides were placed to react with 1mM Fluorescein Isothiocyanate (FITC) in PBS 150 mM, pH 7.4, during 1 hour. FITC is a fluorophore widely used in molecular biology to mark chemical groups, such as amine and thiol. The molecular structure of FITC is presented in Figure 10 along its excitation and emission spectra. The isothiocyanate group covalently reacts with amino groups, which are present on APTES molecules. Consequently, FITC works as a fluorescent label, marking the regions with amino groups.
The topography and roughness of silanised quartz substrates were evaluated using Atomic Force Microscopy. Topographic data may provide useful information about the mechanism and morphology of silane layer formation.(73)
*
48
2.6 Polymerase Chain Reaction (PCR) of HPV 18 target sequence
PCR was performed in a thermal cycler model Maxygene (Axygen, USA). The DNA po-lymerase kit used was Taka a Ta ™ Hot “ta t Ve sio (Takara Biotechnology, Japan). Primers were acquired from IDT® and HPV 18 genome was acquired from NIBSC (National Institute for Biological Standards and Control, United Kingdom).
HPV 18 target sequence amplification was performed in 50 µl reaction volume, con-taining Taq buffer, forward primer, reverse primer, genomic template, Taq DNA polymerase, mixture of nucleotides (dNTP) and deionised water. The optimised concentrations and ther-mal cycle are presented in Table 4.The PCR amplicon was purified using Wizard® SV Gel and PCR Clean-Up System kit (Promega, USA).To quantify purified target sequence, a Nano-Drop 1000 Spectrophotometer was used (Thermo Scientific, USA).
Table 4 - Conditions used to amplify target DNA from HPV 18 genome
Source: by the author
PCR reagents Thermal cycle
Material Final
Concentration Repetitions
Temperature (°C)
Time (mm:ss)
HPV 18 genome 104units/µl 1 92.0 5:00
Primer Forward 0.4 µM
35 cycles
92.0 0:30
Primer Reverse 0.4 µM 60.0 1:30
Taq DNA Polymerase 1.25 units/50 µl 72.0 2:00
dNTP 0.2 mM each 1 72.0 5:00
Figure 10 - Fluorescein Isothiocyanate (FITC) molecular structure and Excitation-Emission spectra.
49
2.7 Electrochemical measurements
Cyclic Voltammetry (CV) was used to monitor surface changes on ITO electrodes. Electrochemical measurements were performed using a potentiostat/galvanostat (Metroh-mAutolab, The Netherlands), model PGSTAT 302, with system acquisition and data process-ing General Purpose Electrochemical System (GPES, version 4.9) and Frequency Response Analyser (FRA, version 4.9).
All electrochemical measurements were performed in Phosphate Saline Buffer (PBS), 0.15M, pH 7.4, at room temperature. To prepare the PBS buffer the following reagent con-centrations were used: Potassium Phosphate Monobasic 1.8 mM, Sodium Phosphate Diba-sic 10 mM, Sodium Chloride 137 mM, Potassium Chloride 2.7 mM. Additionally, a solution of 1 mM of each, Ferrocyanide and Ferricyanide ( ), was used as electrochemical redox probe. An electrochemical cell (10 ml) with three electrodes set up was used. A square platinum foil (1 x 1 cm) was used as counter electrode. A standard silver chloride (Ag/AgCl/KCl saturated) electrode was used as reference electrode*. ITO electrodes were used as working electrodes.
For silanisation measurements, the potential ranged from -0.1 V to 1.0 V at a scan rate of 0.1 V/s. For sensor construction and calibration, CV was performed between -0.3 V and 0.8 V at a scan rate of 0.1 V/s in 1 mM in PBS 0.15M, pH 7.4, at room temperature (25°C) for sensor construction . No conditioning potential was used nor equili-bration time. EIS measurements were performed in a frequency range from 0.1 to 104 Hz at an alternated voltage of 0.05 V, centred in open cell potential (ca. 0.2 V). Prior to every EIS measurement, a Cyclic Voltammetry was performed.
*
50
2.8 Characterisation techniques
2.8.1 Ultraviolet Absorption Spectroscopy
Ultraviolet (UV) Absorption Spectroscopy spectra were collected in a U-2900 Spec-trophotometer (Hitachi, Japan). Spectra were measured from 200 to 340 nm, using a deute-rium lamp as UV source, with a scan speed of 400 nm per minute. For each quartz substrate, a blank spectrum, also referred as background spectrum, was measured prior to any surface modification. A special slide holder was designed to ensure the quality of the spectra and avoid reflection and distortions caused by misplacement of quartz slides inside the spectro-photometer (Figure 11). Substrates were placed in vertical position and perpendicular to the light beam.
2.8.2 Fluorescence Microscopy
Fluorescence Microscopy images from silanised quartz slides labelled with FITC were acquired in a Nikon eclipse TS100 Fluorescence Microscope (Nikon, Japan) equipped with a camera DSRi-1, a 50W mercury light source and filter set EF-4 B-2A, with excitation band pass from 400-440 nm and emission cut-off in 470 nm. The blue line (435 nm) of mercury emission spectrum was used to excite FITC molecule, which shows a peak emission in 521 nm.
Figure 11 - Slide holder designed to use in Absorbance Spectroscopy and Fluorescence Spectroscopy
51
2.8.3 Atomic Force Microscopy (AFM)
AFM measurements were acquired in an atomic force microscope, model FlexAFM (Nanosurf, Switzerland), equipped with a 100 µm scan head. Measurements were performed in non-contact mode (also known as tapping mode) using a cantilever with resonance fre-quency of 190 kHz, model TAP 190AL-G-50 (Tedpella, USA).
The open source software Gwyddion version 2.34 was used to process the AFM im-ages, as well as to calculate the roughness parameters. Roughness was evaluated using: av-erage roughness (Ra), mean square roughness (Rq), skewness, and kurtosis. Briefly, Ra
meas-ures the average absolute deviation from mean value of a distribution (first momentum); Rq measures the quadratic deviation from the mean value of a distribution (second momen-tum). Skewness (R3) is the third momentum of a distribution and it measures the distribution
asymmetry. For a normal distribution, skewness is equal to zero. Kurtosis (R4) is the fourth
momentum of a distribution and it describes whether the distribution is broad or sharp, where the kurtosis value for a normal distribution is equal to 3. The equations for each pa-rameter are presented below (Table 5).
Table 5 - Equations for roughness parameters
53
3
Results and Discussion
3.1 Determination of target sequence from HPV type 18
All HPV types present a double-stranded, circular DNA genome, ca. 8 kilobases in length. The major capsid protein (L1 gene) and the small capsid protein (L2 gene) are used to build the capsid, which protects the virus DNA until it infects a new host cell. E1 to E7 genes codify for viral regulatory proteins, which are responsible for viral genome integration and expression in the host cell. Finally, the last 10% of virus genome is called long control region (LCR) or non-coding region and it holds the origin of replication as well as multiple transcrip-tion factor binding sites.(74) To illustrate this genome structure, Figure 12 exhibits the anno-tation for HPV 18 genes.
HPV 18 Reference Sequence (NC_001357.1 from NCBI) was used as standard for all analyses presented in this dissertation. The first observation when studying HPV is that HPV 18 and 45 (another high risk type) display quite similar genomes. Thus, prior to any target determination in HPV 18, both genomes must be aligned, to determine a non-similar region between those types.
Reference genome is aligned against all other HPV 18, non-reference sequences, to find a conserved region in different strains. Once this probable target sequence is deter-mined, primers are designed to amplify it, as well as the probe sequence. The inset on figure 12 shows the positions of forward primer, reverse primer, target and probe sequences on viral genome. Once primers and probes are determined, its physicochemical properties must be calculated.
OligoAnalyser tool results show a melting temperature (Tm) of 55.6 °C, and no
54
(18/25). On the lowest part of Table 6, it is displayed the sequences names, strings, and their location on genome.
Figure 12 - Scheme of HPV 18 genome: Structural genes, L1 and L2 (). Viral regulatory proteins, E1 to E7, (). Inset: Annotation of primers (), probe sequence (), and target sequence () on original genome strands
Source: by the author
55
Table 6 - Oligoanalyser and BLAST results for selected DNA probe
O li g oA n a ly ser
name HPV18p
sequence CTGTATTTGTGTTTGTGGTATGGGT position 7335..7359
% CG 40.00%
Tm 55.6 °C
self-dimer -1.47 kcal/mol (2 bp) hairpin all ΔG> at 25 °C
BL
A
ST
Organism Specie Score
Human 18/25
Candida
C. dubliniensis 16/25
C. tropicalis 21/25
C. albicans 15/25
Lactobacillus L. casei 14/25
Bacteria Hydrogenobaculum sp. 18/25
HPV type 33 10/25
type 45 11/25
Se q u e n ces
Name Sequence Location
Primer F GCCCTAGTGAGTAACAACTG 7318..7337
Probe CTGTATTTGTGTTTGTGGTATGGGT 7335..7359
Target GCCCTAGTGAGTAACAACTGTATTT GTGTTTGTGGTATGGGTGTTGCTTG TTGGGCTATATATTGTCCTGTATTTC AAGTTATAAAACTGCACACCTTACA GCATCCATTTT 7335..7414(c)
Primer R AAATGGATGCTGTAAGGTGT 7409..7428(c)
Source: by the author
3.2 Characterisation of the DNA immobilisation
3.2.1 A proof of concept: Initial DNA attachment tests
56
260 nm absorbance peak and, consequently, its immobilisation can be monitored using UV Absorption Spectroscopy.
In section 2.4.1, ITO is proposed both as the substrate and the conductive element for sensor construction. However, ITO is deposited on glass, and both exhibit a high absorp-tion below 300 nm. On the other hand, fused silica (or fused quartz) is highly pure (>99.9%) which makes it quite transparent in the UV region, and suitable for optical characterisation of DNA immobilisation. Hydroxyl groups on the substrate surface reacts with silicon from the organosilane molecules, and it is expected that the substrate composition has a low influ-ence on the silane deposition as long as it contains enough hydroxyl groups.(75)
Figure 13 exhibits the UV absorption spectra obtained at each step of DNA immobili-sation onto a quartz slide. Although the addition of Muconic Acid (MuA) leads to an absorp-tion increment (–), the reaction with DNA (–) drastically affects the absorption profile, showing the typical DNA absorption peak at 260 nm.
In addition, the same slide was immersed for 10 minutes in a 1 mg.ml-1 ethidium bromide (EtBr) solution, followed by washing in deionised water. The slides where illumi-nated with a UV lamp. Because EtBr intercalates with DNA base pairs and exhibits high fluo-rescence intensity near 600 nm, it is widely used in molecular biology as a staining agent for direct DNA visualisation.
As shown in Figure 14, the silanised quartz (left) presents fluorescence, where amino modified DNA reacted. It is possible to observe a higher deposition of DNA on the meniscus of the solution, which can be seen as a fluorescent line with high intensity. In the same fig-ure, the control slide (right) had been brought in contact with EtBr as well, however it was
Figure 13 - UV absorption spectroscopy of the steps used in DNA immobilisation.
57
not silanised prior to contact with MuA and DNA. This slide shows no significant fluorescence or absorbance*when compared with the positive one. Thus, there is no significant adsorp-tion of DNA onto quartz slides without silanisaadsorp-tion.
3.3 Optimisation of DNA immobilisation
After the proof of concept, it was necessary to optimise the conditions of DNA im-mobilisation. Numerous variables can influence on the yield of this reaction, however the silanisation and cross-linking are essential to establish a proper surface activation.
3.3.1 Silanisation time
According to experimental procedure described on section 2.4.2.1, silanisation time was varied to determine whether it affects the amount of immobilised DNA. Figure 15A ex-hibits the corrected spectra for substrate absorption (baseline correction). On Figure 15B, it is presented the same spectra with light scattering correction. It is possible to conclude that the higher the silanisation time, the lesser the amount of immobilised DNA. This is counter-intuitive, because one should expect for a higher silanisation time, a higher amount of amino groups available to react with MuA. On the section 3.4.2an explanation for this phenomenon is provided.
*
Spectrum not shown
Figure 14 - DNA immobilisation onto quartz slide. Left: Fluorescence due to EtBr bound to immobilised DNA. Right: Control slide with no silanisation.