ACPD
15, 35035–35056, 2015Observed strato-/mesospheric
wind oscillations
R. Rüfenacht et al.
Title Page
Abstract Introduction
Conclusions References
Tables Figures
◭ ◮
◭ ◮
Back Close
Full Screen / Esc
Printer-friendly Version Interactive Discussion
Discussion
P
a
per
|
Discussion
P
a
per
|
Discussion
P
a
per
|
Discussion
P
a
per
Atmos. Chem. Phys. Discuss., 15, 35035–35056, 2015 www.atmos-chem-phys-discuss.net/15/35035/2015/ doi:10.5194/acpd-15-35035-2015
© Author(s) 2015. CC Attribution 3.0 License.
This discussion paper is/has been under review for the journal Atmospheric Chemistry and Physics (ACP). Please refer to the corresponding final paper in ACP if available.
First continuous ground-based
observations of long period oscillations
in strato-/mesospheric wind profiles
R. Rüfenacht, K. Hocke, and N. Kämpfer
Institute of Applied Physics, University of Bern, Bern, Switzerland
Received: 6 August 2015 – Accepted: 25 November 2015 – Published: 14 December 2015
Correspondence to: R. Rüfenacht ([email protected])
ACPD
15, 35035–35056, 2015Observed strato-/mesospheric
wind oscillations
R. Rüfenacht et al.
Title Page
Abstract Introduction
Conclusions References
Tables Figures
◭ ◮
◭ ◮
Back Close
Full Screen / Esc
Printer-friendly Version Interactive Discussion
Discussion
P
a
per
|
Discussion
P
a
per
|
Discussion
P
a
per
|
Discussion
P
a
per
|
Abstract
Direct measurements of middle-atmospheric wind oscillations with periods between 5 and 50 days in the altitude range between mid-stratosphere (5 hPa) and upper meso-sphere (0.02 hPa) have been made using a novel ground-based Doppler wind radiome-ter. The oscillations were not inferred from measurements of tracers, as the radiometer
5
offers the unique capability of near-continuous horizontal wind profile measurements. Observations from four campaigns at high, mid and low latitudes with an average dura-tion of 10 months have been analyzed. The dominant oscilladura-tion has mostly been found to lie in the extra-long period range (20–40 days), while the well-known atmospheric normal modes around 5, 10 and 16 days have also been observed. Comparisons of
10
our results with ECMWF operational analysis model data revealed remarkably good agreement below 0.3 hPa but discrepancies above.
1 Introduction
The dynamics of the middle atmosphere is characterized by waves and oscillations with distinct periods. As shown by current research, an accurate representation of the
15
middle-atmospheric dynamics can improve the forecast skills of numerical weather pre-diction models, especially on longer time scales (e.g. Baldwin et al., 2003b, a; Charl-ton et al., 2004; Hardiman et al., 2011; Sigmond et al., 2013). Therefore validations of these models are needed also in the stratosphere and mesosphere in addition to tropospheric analyses. Thereby not only the correctness of the absolute values of the
20
atmospheric parameters, but also the correct representation of their natural oscillations should be studied.
Measurements of zonal and meridional wind are the most direct way to observe at-mospheric dynamics. For studying long period oscillations continuous long-term mea-surement time series are required. However, wind observations in the upper
strato-25
ACPD
15, 35035–35056, 2015Observed strato-/mesospheric
wind oscillations
R. Rüfenacht et al.
Title Page
Abstract Introduction
Conclusions References
Tables Figures
◭ ◮
◭ ◮
Back Close
Full Screen / Esc
Printer-friendly Version Interactive Discussion
Discussion
P
a
per
|
Discussion
P
a
per
|
Discussion
P
a
per
|
Discussion
P
a
per
sphere and lower mesosphere are practically inexistent so far and the few measure-ments available are not present on a continuous basis (see Supplement Text S1).
Rocket soundings (e.g. National Research Council, 1966; Müllemann and Lübken, 2005) and the Doppler wind lidar at ALOMAR (Hildebrand et al., 2012; Baumgarten, 2010) have been reported to be able to measure the wind profile. However the broadly
5
validated time series measured by the novel ground-based microwave wind radiome-ter WIRA (Rüfenacht et al., 2012, 2014) is the only instrument capable of providing wind observations between 35 and 70 km altitude (5 to 0.04 hPa) and satisfying the requirement of long term continuity necessary for the analysis of long period oscilla-tions. The published time series of the wind lidar are too short for long period spectral
10
analyses whereas the coarse time resolution of rocket soundings seems inadequate for the investigation of oscillations with periods shorter than approximatively 20 days. A rocket-sensed wind data set with 1–2 profiles per week has, however, been used by Keckhut (1995) in a study investigating the effect of the 27 day solar rotation period on middle atmospheric dynamics.
15
Oscillations of horizontal wind in the (upper) mesosphere/lower thermosphere region (MLT) have extensively been studied using radar observations (e.g. Araújo et al., 2014; Day et al., 2012; Guharay et al., 2014; Luo et al., 2001, 2002). In the upper stratosphere and lower mesosphere region analyses of long period oscillations in the concentration of trace gases such as ozone and water vapor have been reported based on microwave
20
radiometry (e.g. Hocke et al., 2013; Scheiben et al., 2014).
Here we present an analysis of oscillations in upper stratospheric and mesospheric horizontal wind profiles with periods between 5 and 50 days. We also compare results obtained from wind radiometer measurements to the operational analysis data from the European Centre for Medium-Range Weather Forecast model (ECMWF).
ACPD
15, 35035–35056, 2015Observed strato-/mesospheric
wind oscillations
R. Rüfenacht et al.
Title Page
Abstract Introduction
Conclusions References
Tables Figures
◭ ◮
◭ ◮
Back Close
Full Screen / Esc
Printer-friendly Version Interactive Discussion
Discussion
P
a
per
|
Discussion
P
a
per
|
Discussion
P
a
per
|
Discussion
P
a
per
|
2 Data sets
2.1 Wind radiometer data
The novel Doppler WInd RAdiometer WIRA is a ground-based passive heterodyne re-ceiver for the observation of horizontal wind profiles from the mid-stratosphere (5 hPa) to the mesopause (0.02 hPa) where no other application provides continuous time
se-5
ries of wind measurements. Wind profiles are determined by measuring Doppler shifts of the pressure broadened emission line of ozone at 142 GHz. The retrieval from the raw data is based on an optimal estimation inversion (Rodgers, 2000) of an atmo-spheric radiative transfer model implemented in the ARTS/QPACK software (Eriksson et al., 2011, 2005). Typical measurement uncertainties and vertical resolutions of the
10
daily average wind profiles used in this study range from 10 to 20 m s−1and from 10 to 16 km, respectively. However, as also indicated by Rodgers (2000), it should be noted that features vertically spaced by less than 10 km can in many cases be recognized as individual peaks in the retrieved data, although their amplitudes are not independent. Detailed descriptions of the instrument and retrieval characteristics of WIRA have
al-15
ready been published (Rüfenacht et al., 2012, 2014).
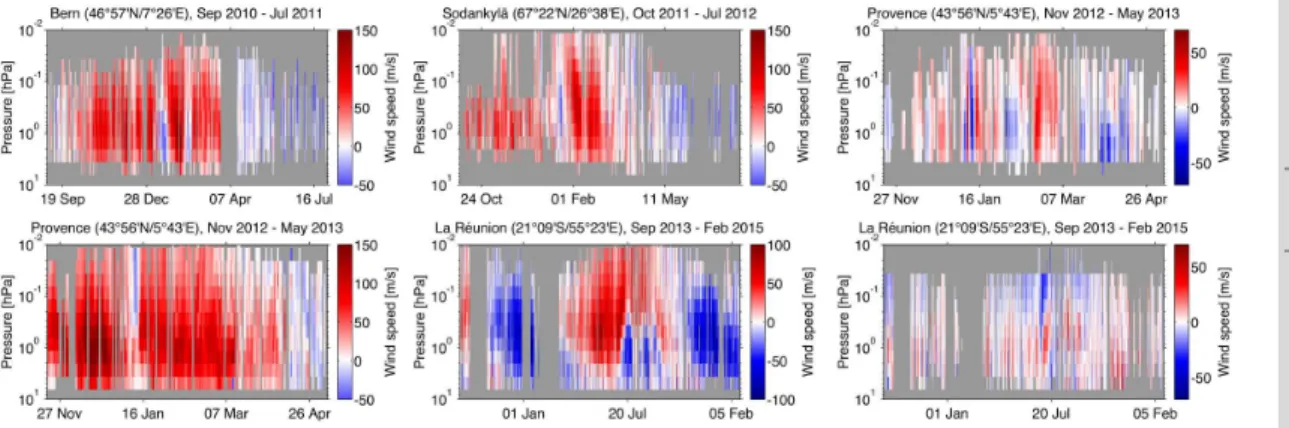
A strength of microwave radiometers is the possibility to measure also under overcast conditions and independently of daylight situation. Paired with low operation costs this allows the sampling of long continuous time series. The present study is based on mea-surements taken by WIRA at four different locations at high, mid and low latitudes:
So-20
dankylä (67◦22′N/26◦38′E, October 2011–July 2012), Bern (46◦57′N/7◦26′E, Septem-ber 2010–July 2011), Observatoire de Haute-Provence (43◦56′N/5◦43′E, Novem-ber 2012–May 2013) and Observatoire du Maïdo on La Réunion (21◦04′S/55◦23′E, September 2013–February 2015). The data series from these campaigns are plot-ted in Fig. 1. At Sodankylä and Bern only zonal wind was measured, whereas the
25
observations from Provence and La Réunion comprise the zonal and meridional com-ponent. The gray areas in Fig. 1 correspond to data points judged untrustable (mea-surement response<0.8, altitude resolution>20 km or altitude accuracy>4 km, see
ACPD
15, 35035–35056, 2015Observed strato-/mesospheric
wind oscillations
R. Rüfenacht et al.
Title Page
Abstract Introduction
Conclusions References
Tables Figures
◭ ◮
◭ ◮
Back Close
Full Screen / Esc
Printer-friendly Version Interactive Discussion
Discussion
P
a
per
|
Discussion
P
a
per
|
Discussion
P
a
per
|
Discussion
P
a
per
Rüfenacht et al., 2014, for details). The sensitive altitude range largely depends on the signal-to-noise ratio of the receiver, which was significantly improved by an instrumen-tal upgrade in autumn 2012, as well as on the tropospheric conditions, especially on the water content.
2.2 ECMWF model data
5
The European Centre for Medium-Range Weather Forecast (ECMWF) provides Eu-rope’s major assimilated numerical weather prediction model for global medium-range weather forecasts with 6 hourly output. The measurement data assimilated in a 4-D-Var assimilations window of 12 h mainly originate from the troposphere and lower strato-sphere (e.g. Dee et al., 2011). For the research presented here operational analysis
10
data from versions 36r2 (September to November 2010), 36r4 (November 2010 to May 2011), 37r2 (May to November 2011), 37r3 (November 2011 to June 2012), 38r1 (June 2012 to June 2013), 38r2 (June to November 2013) and 40r1 (November 2013 to February 2015) with a spectral resolution of T1279 have been used (ECMWF, 2015). A previous study revealed good agreement (within 10 %) between ECMWF’s
opera-15
tional analysis and WIRA’s wind measurements in the stratosphere, but demonstrated that the mesospheric zonal wind speed is generally overestimated by the model with discrepancies increasing with altitude to reach up to 50 % in the upper mesosphere (Rüfenacht et al., 2014). In contrast, comparisons between a limited data set of WIRA and the MERRA analysis from NASA’s GEOS-5 model (Rienecker et al., 2011)
re-20
vealed good agreement also in the mesosphere (Le Pichon et al., 2015).
3 Data analysis
It is known from earlier research that atmospheric waves in the range of periods con-sidered here (5–50 days) are present on intermittent basis only (e.g. Araújo et al., 2014; Day et al., 2012). The different occurrences might also be out of phase. Therefore we
ACPD
15, 35035–35056, 2015Observed strato-/mesospheric
wind oscillations
R. Rüfenacht et al.
Title Page
Abstract Introduction
Conclusions References
Tables Figures
◭ ◮
◭ ◮
Back Close
Full Screen / Esc
Printer-friendly Version Interactive Discussion
Discussion
P
a
per
|
Discussion
P
a
per
|
Discussion
P
a
per
|
Discussion
P
a
per
|
perform the spectral analyses in sliding Hamming windows encompassing three oscil-lation periodsT. The window width matching an integer multiple of the searched period and the use of a Hamming window function avoid spectral leakage. Data gaps in the measured time series can be large at some times and altitudes, therefore gaps were not interpolated as done in other studies, because this would artificially alter the
os-5
cillation signal (damping it in case of linear interpolation). They were rather treated as missing values and the Lomb–Scargle spectral approach for irregularly spaced data was applied (Press et al., 2001; Scargle, 1982; Lomb, 1976).
The spectral method used in the present study will be described in some more de-tail in the following: For each altitude level a wind time seriesxis sampled at equally
10
spaced timestj =k·δtwithxj =x(tj) andk∈N. However, for sometj no reliable
mea-surement dataxj exist at the respective altitude. Such pairs of (tj,xj) will be excluded from the following analysis leading to an unequally spaced time series. We define ¯xj
andσj as the mean and standard deviation ofxin the index range (j−n). . .(j+n), i.e.
within a window of length (2n+1)≈3T/δt. The Lomb–Scargle transformL is applied
15
to the windowed time series to obtain a normalized periodogramPj for each point in time:
Pj =Li∈Bj{tj+i,hi·(xj+i−x¯j)} (1)
with the indicesi in the range
Bj ={m|m∈ {−n,−n+1,. . ., 0,. . .,n} ∧ ∃xj+m} (2)
20
and with hi being the coefficient of a Hamming window of length (2n+1) centered
around index 0. Let us also define:
Cj={m|m∈ Bj ∧ |m| ·δt≤T/2}, (3)
i.e.Cj denotes the central third ofBj.Pj’s calculated from windows with an insufficient
amount of relevant data points, i.e. when
25
#Bj < T
δt ∨ #Cj < T
3δt (4)
ACPD
15, 35035–35056, 2015Observed strato-/mesospheric
wind oscillations
R. Rüfenacht et al.
Title Page
Abstract Introduction
Conclusions References
Tables Figures
◭ ◮
◭ ◮
Back Close
Full Screen / Esc
Printer-friendly Version Interactive Discussion
Discussion
P
a
per
|
Discussion
P
a
per
|
Discussion
P
a
per
|
Discussion
P
a
per
are rejected from the analysis. The entire procedure is repeated for all searched oscil-lation periodsT, for all timestj and for all altitude levels.
The normalized periodogram Pj is readily transformed to the amplitude spectrum (e.g. by combining Eq. 6 from Hocke, 1998, and Eq. 15 from Harris, 1978):
Aj(T)=2σj v u u u u t
P
i∈Bjh
2
i
P
i∈Bjhi
2Pj(T) . (5)
5
Pj also contains the information about the significance α of an oscillation peak at
a distinct frequency
αj(T)=1−
1−exp(−Pj(T))
M
. (6)
In our caseMis a factor close to the window width (for details see Press et al., 2001). The variableα might also be referred to as “false alarm probability of the detection”,
10
a smallα value indicates a highly significant oscillation.
For comparison, the pseudo-wavelet approach used by Studer et al. (2012) and Scheiben et al. (2014) has been modified in order not to rely on interpolation. The dif-ference between the results obtained with the modified pseudo-wavelet method shown in Figs. S8 and S9 in the Supplement and the outcomes of the Lomb–Scargle method
15
(Figs. 2 and 4) was found to be small. Moreover, the different spectral methods with and without interpolation and with different windowing functions have been tested for their ability of retrieving synthetic oscillation signals containing data gaps correctly. The Lomb–Scargle method used with a Hamming window applied in the analyses pre-sented in this paper was most successful and produced only marginal differences
be-20
ACPD
15, 35035–35056, 2015Observed strato-/mesospheric
wind oscillations
R. Rüfenacht et al.
Title Page
Abstract Introduction
Conclusions References
Tables Figures
◭ ◮
◭ ◮
Back Close
Full Screen / Esc
Printer-friendly Version Interactive Discussion
Discussion
P
a
per
|
Discussion
P
a
per
|
Discussion
P
a
per
|
Discussion
P
a
per
|
4 Results
The spectral analyses have been performed for the daily averages of the wind mea-surements by WIRA and of the model data from the ECMWF operational analysis. In order to allow direct comparisons between measurements and model, the ECMWF data were convolved with WIRA’s averaging kernels to account for the limited vertical
5
resolution of the radiometer and data gaps were added at the timestj where the mea-surement did not provide reliable data. In the following, the model data treated in this way are referred to as “ECMWF at WIRA”. The results for the analysis of the unaltered ECMWF time series are displayed in Figs. S2 and S3 in the Supplement.
4.1 Altitude dependence of the periodograms
10
The altitude dependent temporally averaged periodograms of the horizontal wind mea-surements by WIRA are shown in Fig. 2. The temporal average runs over all oscillation amplitude data existing at a certain altitude for the respective campaign. From Fig. 1 one can identify levels where atmospheric conditions cause trustable measurement data to be present predominantly in winter, so that oscillation amplitudes at these
alti-15
tudes should be understood as seasonal averages rather than averages over the entire duration of the campaign. This is especially the case for the upper altitude data from Sodankylä (above approx. 0.2 hPa) but to a lower extent also applies to the other sta-tions.
Figure 2 indicates that the dominant oscillations in horizontal wind occur in the
extra-20
long period range (20–40 days) at all stations. Atmospheric oscillations with periods around 27 days are often discussed in the context of the modulation of the solar forcing with the rotational period of the sun. However, cross-correlation analyses of WIRA’s wind measurements with solar UV irradiance data revealed that the phase difference between wind and irradiance time series varies significantly for the different
measure-25
ment campaigns. From this fact and from the obvious seasonality of these wind oscil-lations (see Sect. 4.2) we infer that the influences of the variations in the solar forcing
ACPD
15, 35035–35056, 2015Observed strato-/mesospheric
wind oscillations
R. Rüfenacht et al.
Title Page
Abstract Introduction
Conclusions References
Tables Figures
◭ ◮
◭ ◮
Back Close
Full Screen / Esc
Printer-friendly Version Interactive Discussion
Discussion
P
a
per
|
Discussion
P
a
per
|
Discussion
P
a
per
|
Discussion
P
a
per
on middle atmospheric horizontal winds must be indirect, if existing. Similar conclu-sions were drawn by a study with the WACCM model to be presented in a separate publication where it is demonstrated that periods around 27 days can also be produced inherently by the atmosphere and that oscillations in the solar irradiance can manifest themselves in the atmospheric wind periodograms at frequencies differing from the
5
variations in solar forcing (Ansgar Schanz, personal communication, 2015).
Normal modes in the atmosphere are known to have oscillation periods around 2, 5, 10 and 16 days (Salby, 1981a, b) which can also be observed in the measured average periodograms for the different campaigns. Measurements of daily average wind profiles do not allow to draw meaningful conclusions regarding the behavior of the quasi
two-10
day periodicity. A quasi 5 day wave is observed in WIRA’s zonal wind measurements for Bern, Sodankylä, and La Réunion and in the meridional wind measurements from Provence. It might also be present in the meridional wind on La Réunion, but the sig-nificance of this signal is low. Oscillation with periods around 10 days are clearly visible in the zonal wind in Sodankylä and the zonal and meridional wind in Provence. The
15
quasi 16 day variation is weakly recognizable in the zonal wind measurements from La Réunion.
The highest wave amplitudes are usually detected around the stratopause which is also the region where the highest absolute wind speeds are generally observed (e.g. Rüfenacht et al., 2014). Despite the fact that high interannual variability has to be
ex-20
pected (e.g. compare the results from the Bern and the Provence campaign which were sampled at very close geographical locations) one might also conclude that zonal wind oscillations tend to be strongest at mid latitudes, and that meridional wind oscil-lations are weaker in the tropics than at mid-latitudes. This hypothesis is supported by model data from ECMWF for the time periods of WIRA’s measurement campaigns
25
analyzed at all four locations investigated in the present study (see Figs. S4 to S7 in the Supplement).
ACPD
15, 35035–35056, 2015Observed strato-/mesospheric
wind oscillations
R. Rüfenacht et al.
Title Page
Abstract Introduction
Conclusions References
Tables Figures
◭ ◮
◭ ◮
Back Close
Full Screen / Esc
Printer-friendly Version Interactive Discussion
Discussion
P
a
per
|
Discussion
P
a
per
|
Discussion
P
a
per
|
Discussion
P
a
per
|
model. The qualitative and quantitative agreement between measurements and model is remarakbly good below 0.3 hPa. The only notable discrepancies occur at periods larger than 45 days, for the 5 day wave which is mostly absent in ECMWF and for the 10 day periodicity. The last one is present in ECMWF with amplitudes comparable to WIRA only for the meridional wind during the Provence campaign.
5
Above 0.3 hPa ECMWF tends to overestimate the oscillation amplitudes. Wind os-cillation amplitudes observed in the MLT region (e.g. Araújo et al., 2014; Luo et al., 2001, 2002) better match with the uppermost observations from WIRA than with the high amplitudes in the ECMWF model.
A previous study (Rüfenacht et al., 2014) has shown that ECMWF generally
over-10
estimates mesospheric zonal wind speeds with discrepancies increasing for higher altitudes. When normalizing the oscillation amplitudes by dividing by the mean wind profile of the measurement campaign at the respective altitude the differences be-tween WIRA and ECMWF were highly diminished (Fig. S10 in the Supplement). This shows that the oscillation amplitude discrepancy behaves similarly to the absolute wind
15
speed discrepancy, i.e. increases by the same factor with increasing altitude. Knowing that the ECMWF model is constrained by the assimilation of tropospheric and strato-spheric data but is mainly free-running in the mesosphere (Orr et al., 2010; ECMWF, 2015), one might conclude that some of ECMWF’s model physics are not accurate enough to reproduce the dynamics of the mesosphere to detail. An overestimation of
20
the upward momentum transport or an underestimation of some damping mechanisms in the mesosphere are possible causes of this effect. Another explanation might be that the model contains assumptions on the balance between the wind and temper-ature fields which are not accurate in the mesosphere. As noted by Shepherd et al. (2000) and Koshyk et al. (1999) the unbalanced component of the flow increases with
25
altitude. However, the exact reason for the concomitant mesospheric overestimation of the absolute wind speeds and the oscillation amplitudes in ECMWF remain unclear.
ACPD
15, 35035–35056, 2015Observed strato-/mesospheric
wind oscillations
R. Rüfenacht et al.
Title Page
Abstract Introduction
Conclusions References
Tables Figures
◭ ◮
◭ ◮
Back Close
Full Screen / Esc
Printer-friendly Version Interactive Discussion
Discussion
P
a
per
|
Discussion
P
a
per
|
Discussion
P
a
per
|
Discussion
P
a
per
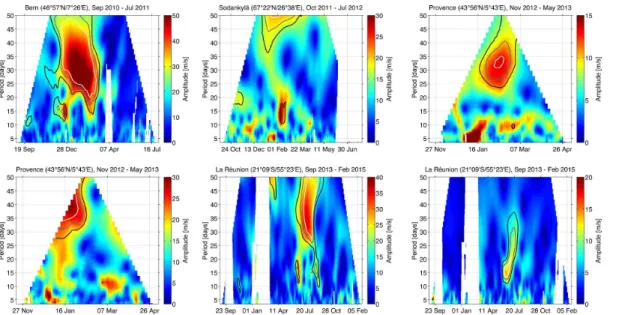
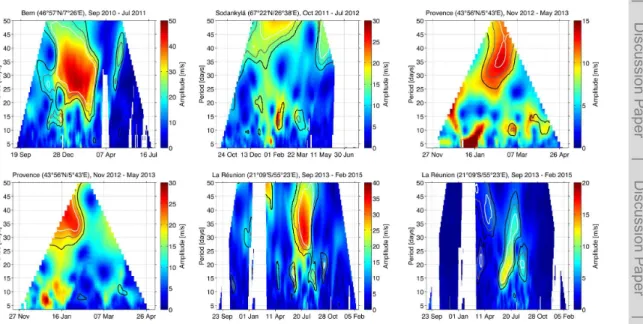
4.2 Temporal evolution of the periodograms
Long period atmospheric oscillations usually manifest themselves on intermittent ba-sis, therefore also the temporal distribution of their appearance was studied. Figures 4 and 5 display the results for WIRA and ECMWF at WIRA, respectively, at stratopause level where the highest amplitudes have generally been observed. Contours
indicat-5
ing the significance levels of the oscillation peaks according to Eq. (6) are overlaid to the amplitude plots. It becomes obvious that the dominant oscillation in the extra-long period range is always highly significant. The oscillation peaks for ECMWF data are slightly more significant due to the absence of measurement noise.
A clear seasonality is apparent for all observations and model data with wave
activ-10
ities being much stronger in the winter half year for all oscillation periods covered by the present study. This pattern is also observed on La Réunion which, although located in the tropics, features high oscillation amplitudes in austral winter and low activity in summer what might suggest that the station is substantially influenced by mid-latitude dynamics. This influence is also recognizable in the time series of the observed zonal
15
wind (Fig. 1) where the mid-latitudinal annual variation mostly dominates over tropical semi-annual variation, although the latter one is still clearly visible.
The period of the extra-long period oscillations is not constant between the different campaigns. The period can even vary within a single occurrence of the wave as seen in the example of Bern where the period decreases from 35 to 25 days between
De-20
cember 2010 and March 2011. A similar feature has simultaneously been observed at three different sites from high to lower mid-latitudes in the mesopause region by Luo et al. (2001). This study also noted that the extra-long period oscillation often appears in combination with a quasi 16 day wave. The occurrence of this wave has not been obvious from Figs. 2 and 3 because it had been masked by other oscillation signals in
25
ACPD
15, 35035–35056, 2015Observed strato-/mesospheric
wind oscillations
R. Rüfenacht et al.
Title Page
Abstract Introduction
Conclusions References
Tables Figures
◭ ◮
◭ ◮
Back Close
Full Screen / Esc
Printer-friendly Version Interactive Discussion
Discussion
P
a
per
|
Discussion
P
a
per
|
Discussion
P
a
per
|
Discussion
P
a
per
|
of the extra-long period oscillation. Whether the two oscillations are linked in some way will have to be verified in a study including more long term observations.
In general the agreement between WIRA and ECMWF at stratopause level is very good in terms of timing, amplitude and frequency. The extra-long oscillations in zonal wind at the two mid latitude stations of Bern and Provence are slightly stronger in
5
the WIRA time series and the amplitude of the quasi 16 day wave in the zonal wind is slightly enhanced for the measurements. However, the most notable difference be-tween WIRA and ECMWF appears at shorter periods. Although mostly not statisti-cally significant, ECMWF seems to underestimate variablities with periods shorter than 10 days for all measurement campaigns. A similar feature has been found for the
com-10
parison of middle-atmospheric temperature lidar observations from Observatoire de Haute Provence and Table Mountain (34◦24′N, 117◦42′W) with ECMWF model data (Le Pichon et al., 2015).
5 Conclusions
Long and extra-long period oscillations in the horizontal wind have been observed by
15
the novel ground-based Doppler wind radiometer WIRA in the altitude range between mid-stratosphere (5 hPa) and upper mesosphere (0.02 hPa) at low, mid and high lati-tudes. In this altitude range wind observations are extremely sparse and the measure-ment time series from WIRA are the only ones satisfying the necessary conditions for the study of this type of oscillations.
20
The dominant oscillations were found to lie in the extra-long period band (20– 40 days) with the period being subject to temporal variations. A direct link between the solar forcing and this wave could not be established, however solar forcing might influence the atmospheric wave pattern in an indirect way. An augmented presence of the quasi 16 day wave has sometimes been observed in the vicinity of strong
extra-25
long period oscillations. A more extended study with more data would be needed to uncover a potential link between those two waves. In addition to the quasi 16 day wave,
ACPD
15, 35035–35056, 2015Observed strato-/mesospheric
wind oscillations
R. Rüfenacht et al.
Title Page
Abstract Introduction
Conclusions References
Tables Figures
◭ ◮
◭ ◮
Back Close
Full Screen / Esc
Printer-friendly Version Interactive Discussion
Discussion
P
a
per
|
Discussion
P
a
per
|
Discussion
P
a
per
|
Discussion
P
a
per
also normal modes with periods near 5 and 10 days are present in our observations. All observed oscillations manifest a strong seasonality with amplitudes being much higher during the winter half year. The strongest oscillation amplitudes were usually found around the stratopause.
WIRA observations and ECMWF model data agree remarkably well below 0.3 hPa.
5
At higher altitudes ECMWF tends to overestimate the oscillation amplitudes in a similar way as it has been noted for the absolute wind speeds in a previous study. In addition ECMWF seems to lack of variability at periods below 10 days. More detailed validations of numerical weather prediction models such as ECMWF in the middle-atmosphere will be an important task for the near future and shall among others be addressed in the
10
framework of the ARISE project (ARISE, 2015). Wind radiometer data could provide a valuable contribution to such research.
Data availability
We acknowledge ECMWF for the operational analysis data (www.ecmwf.int) as well as NASA for the Aura MLS temperature profiles (http://disc.gsfc.nasa.gov/acdisc) used in
15
WIRA’s retrieval algorithm in the way described in Rüfenacht et al. (2014). The WIRA data presented in this manuscript can be made available on request.
The Supplement related to this article is available online at doi:10.5194/acpd-15-35035-2015-supplement.
Acknowledgements. This work has been supported by the Swiss National Science Foundation
20
ACPD
15, 35035–35056, 2015Observed strato-/mesospheric
wind oscillations
R. Rüfenacht et al.
Title Page
Abstract Introduction
Conclusions References
Tables Figures
◭ ◮
◭ ◮
Back Close
Full Screen / Esc
Printer-friendly Version Interactive Discussion
Discussion
P
a
per
|
Discussion
P
a
per
|
Discussion
P
a
per
|
Discussion
P
a
per
|
References
Allan, D.: Statistics of atomic frequency standards, P. IEEE, 54, 221–230, doi:10.1109/PROC.1966.4634, 1966. 35053
Araújo, L. R., Lima, L. M., Batista, P. P., Clemesha, B. R., and Takahashi, H.: Planetary wave seasonality from meteor wind measurements at 7.4◦S and 22.7◦S, Ann. Geophys., 32, 519–
5
531, doi:10.5194/angeo-32-519-2014, 2014. 35037, 35039, 35044
ARISE: available at: http://arise-project.eu/arise-project.php, last access: 2 April 2015. 35047 Baldwin, M. P., Stephenson, D. B., Thompson, D. W. J., Dunkerton, T. J., Charlton, A. J., and
O’Neill, A.: Stratospheric memory and skill of extended-range weather forecasts, Science, 301, 636–640, doi:10.1126/science.1087143, 2003a. 35036
10
Baldwin, M. P., Thompson, D. W. J., Shuckburgh, E. F., Norton, W. A., and Gillett, N. P.: Weather from the stratosphere?, Science, 301, 317–319, doi:10.1126/science.1085688, 2003b. 35036
Baumgarten, G.: Doppler Rayleigh/Mie/Raman lidar for wind and temperature measurements in the middle atmosphere up to 80 km, Atmos. Meas. Tech., 3, 1509–1518,
doi:10.5194/amt-15
3-1509-2010, 2010. 35037
Charlton, A. J., O’Neill, A., Lahoz, W. A., and Massacand, A. C.: Sensitivity of tropospheric forecasts to stratospheric initial conditions, Q. J. Roy. Meteor. Soc., 130, 1771–1792, doi:10.1256/qj.03.167, 2004. 35036
Day, K. A., Taylor, M. J., and Mitchell, N. J.: Mean winds, temperatures and the 16- and 5-day
20
planetary waves in the mesosphere and lower thermosphere over Bear Lake Observatory (42◦N, 111◦W), Atmos. Chem. Phys., 12, 1571–1585, doi:10.5194/acp-12-1571-2012, 2012. 35037, 35039
Dee, D. P., Uppala, S. M., Simmons, A. J., Berrisford, P., Poli, P., Kobayashi, S., Andrae, U., Balmaseda, M. A., Balsamo, G., Bauer, P., Bechtold, P., Beljaars, A. C. M., van de Berg, L.,
25
Bidlot, J., Bormann, N., Delsol, C., Dragani, R., Fuentes, M., Geer, A. J., Haimberger, L., Healy, S. B., Hersbach, H., Hólm, E. V., Isaksen, L., Kållberg, P., Köhler, M., Matricardi, M., McNally, A. P., Monge-Sanz, B. M., Morcrette, J.-J., Park, B.-K., Peubey, C., de Rosnay, P., Tavolato, C., Thépaut, J.-N., and Vitart, F.: The ERA-Interim reanalysis: configuration and performance of the data assimilation system, Q. J. Roy. Meteor. Soc., 137, 553–597,
30
doi:10.1002/qj.828, 2011. 35039
ACPD
15, 35035–35056, 2015Observed strato-/mesospheric
wind oscillations
R. Rüfenacht et al.
Title Page
Abstract Introduction
Conclusions References
Tables Figures
◭ ◮
◭ ◮
Back Close
Full Screen / Esc
Printer-friendly Version Interactive Discussion
Discussion
P
a
per
|
Discussion
P
a
per
|
Discussion
P
a
per
|
Discussion
P
a
per
ECMWF: available at: http://www.ecmwf.int/en/forecasts/documentation-and-support/ changes-ecmwf-model, last access: 15 June 2015. 35039, 35044
Eriksson, P., Jimenez, C., and Buehler, S.: Qpack, a general tool for instrument simulation and retrieval work, J. Quant. Spectrosc. Ra., 91, 47–64, doi:10.1016/j.jqsrt.2004.05.050, 2005. 35038
5
Eriksson, P., Buehler, S., Davis, C., Emde, C., and Lemke, O.: ARTS, the atmospheric radiative transfer simulator, version 2, J. Quant. Spectrosc. Ra., 112, 1551–1558, doi:10.1016/j.jqsrt.2011.03.001, 2011. 35038
Guharay, A., Batista, P., Clemesha, B., and Buriti, R.: Observations of the intraseasonal oscilla-tions over two Brazilian low latitude staoscilla-tions: a comparative study , J. Atmos. Sol.-Terr. Phy.,
10
120, 62–69, doi:10.1016/j.jastp.2014.08.016, 2014. 35037
Hardiman, S. C., Butchart, N., Charlton-Perez, A. J., Shaw, T. A., Akiyoshi, H., Baum-gaertner, A., Bekki, S., Braesicke, P., Chipperfield, M., Dameris, M., Garcia, R. R., Mi-chou, M., Pawson, S., Rozanov, E., and Shibata, K.: Improved predictability of the tro-posphere using stratospheric final warmings, J. Geophys. Res.-Atmos., 116, D18113,
15
doi:10.1029/2011JD015914, 2011. 35036
Harris, F. J.: On the use of windows for harmonic analysis with the discrete Fourier transform, P. IEEE, 66, 51–83, doi:10.1109/PROC.1978.10837, 1978. 35041
Hildebrand, J., Baumgarten, G., Fiedler, J., Hoppe, U.-P., Kaifler, B., Lübken, F.-J., and Williams, B. P.: Combined wind measurements by two different lidar instruments in the
Arc-20
tic middle atmosphere, Atmos. Meas. Tech., 5, 2433–2445, doi:10.5194/amt-5-2433-2012, 2012. 35037
Hocke, K.: Phase estimation with the Lomb–Scargle periodogram method, Ann. Geophys., 16, 356–358, 1998,
http://www.ann-geophys.net/16/356/1998/. 35041
25
Hocke, K., Studer, S., Martius, O., Scheiben, D., and Kämpfer, N.: A 20-day period standing oscillation in the northern winter stratosphere, Ann. Geophys., 31, 755–764, doi:10.5194/angeo-31-755-2013, 2013. 35037
Keckhut, P.: Mid-latitude summer response of the middle atmosphere to short-term solar UV changes, Ann. Geophys., 13, 641–647, doi:10.1007/s00585-995-0641-7, 1995. 35037
30
ACPD
15, 35035–35056, 2015Observed strato-/mesospheric
wind oscillations
R. Rüfenacht et al.
Title Page
Abstract Introduction
Conclusions References
Tables Figures
◭ ◮
◭ ◮
Back Close
Full Screen / Esc
Printer-friendly Version Interactive Discussion
Discussion
P
a
per
|
Discussion
P
a
per
|
Discussion
P
a
per
|
Discussion
P
a
per
|
Le Pichon, A., Assink, J. D., Heinrich, P., Blanc, E., Charlton-Perez, A., Lee, C. F., Keckhut, P., Hauchecorne, A., Rüfenacht, R., Kämpfer, N., Drob, D. P., Smets, P. S. M., Evers, L. G., Cer-anna, L., Pilger, C., Ross, O., and Claud, C.: Comparison of co-located independent ground-based middle-atmospheric wind and temperature measurements with numerical weather prediction models, J. Geophys. Res.-Atmos., 120, 8318–8331, doi:10.1002/2015JD023273,
5
2015. 35039, 35046
Lomb, N. R.: Least-squares frequency analysis of unequally spaced data, Astrophys. Space Sci., 39, 447–462, doi:10.1007/BF00648343, 1976. 35040
Luo, Y., Manson, A. H., Meek, C. E., Thayaparan, T., MacDougall, J., and Hocking, W. K.: Extra long period (20–40 day) oscillations in the mesospheric and lower thermospheric winds:
ob-10
servations in Canada, Europe and Japan, and considerations of possible solar influences, J. Atmos. Sol.-Terr. Phy., 63, 835–852, doi:10.1016/S1364-6826(00)00206-6, 2001. 35037, 35044, 35045
Luo, Y., Manson, A. H., Meek, C. E., Thayaparan, T., MacDougall, J., and Hocking, W. K.: The 16-day wave in the mesosphere and lower thermosphere: simultaneous observations at
15
Saskatoon (52◦N, 107◦W) and London (43◦N, 81◦W), Canada, J. Atmos. Sol.-Terr. Phy., 64, 1287–1307, doi:10.1016/S1364-6826(02)00042-1, 2002. 35037, 35044
Müllemann, A. and Lübken, F.-J.: Horizontal winds in the mesosphere at high lat-itudes, coupling processes in the MLT region, Adv. Space Res., 35, 1890–1894, doi:10.1016/j.asr.2004.11.014, 2005. 35037
20
National Research Council: United States Space Science Program: Report to COSPAR, Ninth Meeting, National Academy of Sciences, 1966. 35037
Orr, A., Bechtold, P., Scinocca, J., Ern, M., and Janiskova, M.: Improved middle atmosphere climate and forecasts in the ECMWF model through a nonorographic gravity wave drag pa-rameterization, J. Climate, 23, 5905–5926, doi:10.1175/2010JCLI3490.1, 2010. 35044
25
Press, W. H., Teukolsky, S. A., Vetterling, W. T., and Flannery, B. P.: Numerical Recipes in Fortran 77: The Art of Scientific Computing, 2nd edn., Cambridge University Press, New York, NY, USA, 2001. 35040, 35041
Rienecker, M. M., Suarez, M. J., Gelaro, R., Todling, R., Bacmeister, J., Liu, E., Bosilovich, M. G., Schubert, S. D., Takacs, L., Kim, G.-K., Bloom, S., Chen, J., Collins, D.,
30
Conaty, A., da Silva, A., Gu, W., Joiner, J., Koster, R. D., Lucchesi, R., Molod, A., Owens, T., Pawson, S., Pegion, P., Redder, C. R., Reichle, R., Robertson, F. R., Ruddick, A. G., Sienkiewicz, M., and Woollen, J.: MERRA: NASA’s Modern-Era Retrospective Analysis for
ACPD
15, 35035–35056, 2015Observed strato-/mesospheric
wind oscillations
R. Rüfenacht et al.
Title Page
Abstract Introduction
Conclusions References
Tables Figures
◭ ◮
◭ ◮
Back Close
Full Screen / Esc
Printer-friendly Version Interactive Discussion
Discussion
P
a
per
|
Discussion
P
a
per
|
Discussion
P
a
per
|
Discussion
P
a
per
Research and Applications, J. Climate, 24, 3624–3648, doi:10.1175/JCLI-D-11-00015.1, 2011. 35039
Rodgers, C. D.: Inverse Methods for Atmospheric Sounding: Theory and Practice, Vol. 2 of Series on Atmospheric, Oceanic and Planetary Physics, World Scientific, Singapore, reprint 2008, 2000. 35038
5
Rüfenacht, R., Kämpfer, N., and Murk, A.: First middle-atmospheric zonal wind profile mea-surements with a new ground-based microwave Doppler-spectro-radiometer, Atmos. Meas. Tech., 5, 2647–2659, doi:10.5194/amt-5-2647-2012, 2012. 35037, 35038
Rüfenacht, R., Murk, A., Kämpfer, N., Eriksson, P., and Buehler, S. A.: Middle-atmospheric zonal and meridional wind profiles from polar, tropical and midlatitudes with the
ground-10
based microwave Doppler wind radiometer WIRA, Atmos. Meas. Tech., 7, 4491–4505, doi:10.5194/amt-7-4491-2014, 2014. 35037, 35038, 35039, 35043, 35044, 35047
Salby, M. L.: Rossby normal modes in nonuniform background configura-tions. Part I: Simple fields, J. Atmos. Sci., 38, 1803–1826, doi:10.1175/1520-0469(1981)038<1803:RNMINB>2.0.CO;2, 1981a. 35043
15
Salby, M. L.: Rossby normal modes in nonuniform background configurations. Part II. Equinox and solstice conditions, J. Atmos. Sci., 38, 1827–1840, doi:10.1175/1520-0469(1981)038<1827:RNMINB>2.0.CO;2, 1981b. 35043
Scargle, J. D.: Studies in astronomical time-series analysis. II. Statistical aspects of spectral-analysis of unevenly spaced data, Astrophys, J., 263, 835–853, doi:10.1086/160554, 1982.
20
35040
Scheiben, D., Tschanz, B., Hocke, K., Kämpfer, N., Ka, S., and Oh, J. J.: The quasi 16-day wave in mesospheric water vapor during boreal winter 2011/2012, Atmos. Chem. Phys., 14, 6511–6522, doi:10.5194/acp-14-6511-2014, 2014. 35037, 35041
Shepherd, T. G., Koshyk, J. N., and Ngan, K.: On the nature of large-scale mixing
25
in the stratosphere and mesosphere, J. Geophys. Res.-Atmos., 105, 12433–12446, doi:10.1029/2000JD900133, 2000. 35044
Sigmond, M., Scinocca, J. F., Kharin, V. V., and Shepherd, T. G.: Enhanced sea-sonal forecast skill following stratospheric sudden warmings, Nat. Geosci., 6, 98–102, doi:10.1038/NGEO1698, 2013. 35036
30
ACPD
15, 35035–35056, 2015Observed strato-/mesospheric
wind oscillations
R. Rüfenacht et al.
Title Page
Abstract Introduction
Conclusions References
Tables Figures
◭ ◮
◭ ◮
Back Close
Full Screen / Esc
Printer-friendly Version Interactive Discussion
Discussion
P
a
per
|
Discussion
P
a
per
|
Discussion
P
a
per
|
Discussion
P
a
per
|
Figure 1.The zonal and meridional wind time series measured by WIRA during four different measurement campaigns analyzed in the present study. The gray areas correspond to data points judged untrustable according to the conditions indicated in the text. Please note the different color scale for zonal and meridional wind.
ACPD
15, 35035–35056, 2015Observed strato-/mesospheric
wind oscillations
R. Rüfenacht et al.
Title Page
Abstract Introduction
Conclusions References
Tables Figures
◭ ◮
◭ ◮
Back Close
Full Screen / Esc
Printer-friendly Version Interactive Discussion
Discussion
P
a
per
|
Discussion
P
a
per
|
Discussion
P
a
per
|
Discussion
P
a
per
|
Figure 3.As Fig. 2 but for the scenario ECMWF at WIRA, i.e. for ECMWF profiles convolved with WIRA’s averaging kernels and with data gaps introduced where WIRA did not provide reliable measurements.
ACPD
15, 35035–35056, 2015Observed strato-/mesospheric
wind oscillations
R. Rüfenacht et al.
Title Page
Abstract Introduction
Conclusions References
Tables Figures
◭ ◮
◭ ◮
Back Close
Full Screen / Esc
Printer-friendly Version Interactive Discussion
Discussion
P
a
per
|
Discussion
P
a
per
|
Discussion
P
a
per
|
Discussion
P
a
per
Figure 4.Temporal evolution of the periodogram at stratopause level (0.9 hPa) for wind mea-surements taken by WIRA. The black, gray and white contour lines markα=0.5, 0.1 and 0.01 according to Eq. (6). The lowest value, i.e. the white contour, corresponds to highest signifi-cance. White areas represent times for whichBj contains indices before the start date of after
ACPD
15, 35035–35056, 2015Observed strato-/mesospheric
wind oscillations
R. Rüfenacht et al.
Title Page
Abstract Introduction
Conclusions References
Tables Figures
◭ ◮
◭ ◮
Back Close
Full Screen / Esc
Printer-friendly Version Interactive Discussion
Discussion
P
a
per
|
Discussion
P
a
per
|
Discussion
P
a
per
|
Discussion
P
a
per
|
Figure 5.As Fig. 4 but for the scenario ECMWF at WIRA.