Temporal variability, sources, and sinks of C<sub>1</sub>-C<sub>5</sub> alkyl nitrates in coastal New England
Texto
Imagem


Documentos relacionados
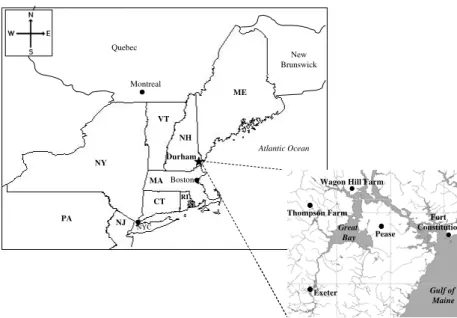
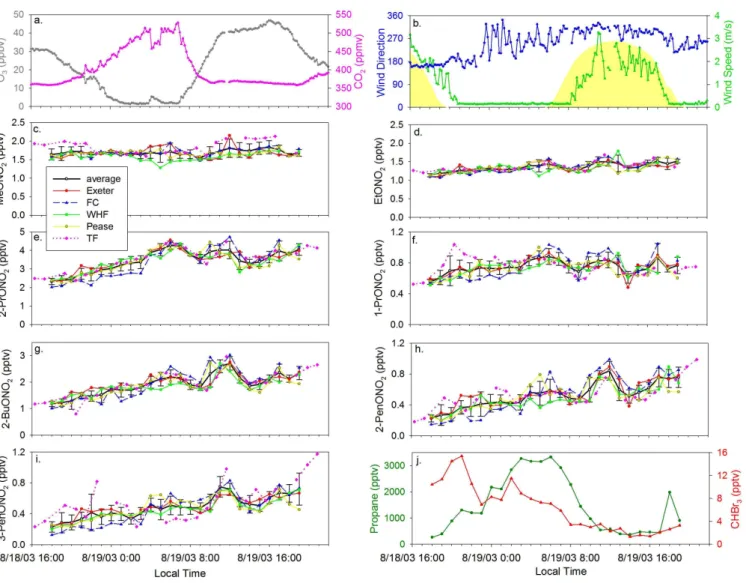
As the three regional stations are located in an area of complex terrain, the observed CO2 mole fractions are likely affected by very local sources for certain wind direc- tions..
made observations during two recent aircraft campaigns: the Deep Convective Clouds and Chemistry (DC-3) and the Studies of Emissions and Atmospheric Composition, Clouds, and
The two main anthropogenic CO 2 fluxes are emissions from the combustion of fossil fuels and net emissions from land use change, the latter being largely driven by deforestation
Triangle plots (a) for day and nighttime source region plumes and (b) for source region averages and for indentified organic groups, i.e., LV-OOA, SV-OOA, OOA and BBOA. The dotted
In addition to continuous measurement of the laser power throughout the field exper- iments, the instrument’s Raman scattering sensitivity was measured nightly by over- flowing
Photochemical ages of trace gases sampled at Fi- nokalia have been estimated using the sequential reaction model and related data.. They lie in the range of 0.5–2.5 days, supporting
(2002), which showed that, although the range of mixing ratios at the South Pole in summer were con- siderably higher than observed at Halley during the winter (< 5 to 54 pptv for
Another impact of non-acyl peroxy nitrates is that they are a possible positive inter- ference to in-situ NO 2 measurements in the upper troposphere because the non-acyl peroxy
