Authors
Luís Henrique Bignotto1
Marina Esteves Kallás2 Rafael Jorge Teixeira Djouki1
Marcela Mayume Sassaki3 Guilherme Ota Voss4 Cristina Lopez Soto2
Fernando Frattini5 Flávia Silva Reis Medeiros6
1 Doctor (Doctor at the Hospital de Caridade São Vicente de Paulo, Jundiaí, SP).
2 Doctor (Doctor at the Hospital de Caridade São Vicente de Paulo, Jundiaí, SP).
3 Student in the 4th year of the Medicine Program (Student of the College of Medicine of Jundiaí).
4 Student in the 4th year of the Medicine Program (Student of the College of Medicine of Jundiaí).
5 Masters in the field of Nephrology (Nephrologist at UNICOM).
6 Associate Professor at the De-partment of Medical Clinic of the College of Medicine of Jundiaí (Nephrologist and Associate Professor of the Department of Medical Clinic of the College of Medicine of Jundiaí).
Submitted on: 12/02/2011. Approved on: 06/06/2012.
Correspondence to: Dra. Flávia Silva Reis Medeiros. College of Medicine of Jundiaí. Rua Francisco Telles, nº 250. Vila Arens. Jundiaí, SP, Brazil. CEP: 13202-550.
E-mail: fsreismedeiros@gmail. com
Introduction: Cardiovascular disease is the leading cause of mortality among patients on dialysis. When consider-ing all causes of death, about 30% are classified as cardiac arrest, death of unknown cause or cardiac arrhythmia. The increasing time of ventricular depo-larization and repodepo-larization, measured non-invasively by measuring the QT in-terval on the electrocardiogram at rest, has emerged as a predictor of complex ventricular arrhythmias, a major cause of sudden cardiac death. Aims: To de-termine the electrocardiographic altera-tions present in hemodialysis (HD) pa-tients, measuring the QT interval and its relationship with clinical and labora-tory variables. Methods: Patients above 18 years on dialysis were approached to participate in the study and, after consent, were submitted to the exami-nation of 12-lead electrocardiogram. Clinical data were reviewed to assess the presence of comorbidities, as well as anthropometric and blood pressure measures. Blood samples were collect-ed to determinate hemoglobin and se-rum levels of calcium, phosphorus and potassium. Results: One hundred and seventy nine patients were included in the study. The majority of the patients were male (64.8%) and white (54.7%); the average age was 58.5 ± 14.7 years old. About 50% of all patients had, at least, one electrical conduction disturb. About 50% of all patients had QTc pro-longation and experienced a significant increase in the frequency of Left Ven-tricular Hypertrophy (LVH), changes of the cardiac rhythm and bundle branch blocks, and a lower body mass index (BMI), when compared with normal QTc interval patients. Conclusions: Pa-tients with chronic kidney disease (CKD)
Electrocardiographic findings in chronic hemodialysis patients
A
BSTRACTKeywords: electrocardiography, death, sudden, cardiac, renal insufficiency, chronic.
I
NTRODUCTIONCardiovascular disease (CVD) is the main cause of death in patients with chronic kidney disease undergoing hemodialysis, and the high mortality rates and progres-sion of CVD in this population are well known. Data from the Hemodialysis Study, sponsored by the United States National Institutes of Health, showed the prevalence of coronary disease, cere-brovascular disease, and peripheral ar-tery disease to be 40%, 19%, and 23%, respectively.1 Alongside this established scenario, recent evidence reveals the scope of the sudden cardiac death (SCD) prob-lem in hemodialysis, with a better under-standing of its pathophysiological charac-teristics, such as the greater link between SCD and left ventricular hypertrophy (LVH), electrolytic changes, and vascular calcification, as compared to the overall population, in which the greater underly-ing process is coronary disease and heart failure.
causes of death are taken into consideration, approxi-mately 30% are classified as cardiac arrest, death from an unknown cause, or cardiac arrhythmia.2,3 Patients undergoing hemodialysis show a higher death rate due to cardiac arrhythmia when compared to patients undergoing peritoneal dialysis [62 versus 42 events/(1000 patients/year)],4 with a greater pro-pensity toward occurrence in the last 12 hours of the greater interdialytic period and in the 12 hours after a hemodialysis session.5
Hemodialysis itself appears to pose an additional risk of induced SCD due to hemodynamic overload and inflammatory stress, given the observations of intradialytic myocardial ischemia, reduction of the RR interval in the electrocardiogram, and the higher frequency of ventricular repolarization changes, with prolongation of the QT interval and susceptibility to ventricular arrhythmias.4 Studies using Holter’s elec-trocardiographic monitoring technique show a high prevalence of ventricular arrhythmias, and systemic arterial hypertension (SAH), coronary artery disease, and the dispersion of the QT interval are indepen-dent predictors of complex ventricular arrhythmias, which may be responsible for the high rate of SCD in hemodialysis.6,7
Syncope, dizziness, arrhythmias (particularly
Torsades de pointes), and SCD are the most common clinical manifestations of the prolonged QT inter-val. These outcomes may be due to either structural changes in the myocardium or the use of medication, both of which induce changes in potassium channels and prolong the time necessary for ventricular repo-larization, consequently predisposing patients to fatal arrhythmias.8
The present study was designed to investigate the electrocardiographic changes of patients undergoing hemodialysis, to determine the prevalence of patients with prolongation of the QT interval, and to evaluate the associations between this condition and clinical and laboratory variables.
M
ETHODSEvery patient in a chronic hemodialysis program at a single kidney replacement therapy center, the UNICOM clinic, in the city of Jundiaí, São Paulo, were invited to participate in the study during the month of June, 2011. The research project was ap-proved by the Ethics and Research Committee of the
College of Medicine of Jundiaí (approval number 137/2011). All patients aged 18 years or older who consented to the study were included.
Clinical variables were recorded to assess the pres-ence of systemic arterial hypertension, diabetes, dys-lipidemia, previous arrhythmia, coronaropathy, ence-phalic vascular accident, current or previous smoking status, and chronic alcohol consumption. The abdom-inal waist and hip measurements were determined to calculate waist/hip ratio, and body weight and height were used to calculate body mass index (BMI). A blood sample was collected immediately before the beginning of the hemodialysis session to determine calcium, phosphorus, and potassium levels using the dry chemistry method with the VITROS 250 system (Johnson & Johnson, New Jersey, USA), and refer-ence values for calcium between 8.4 and 10.2 mg/dL, phosphorus between 2.5 and 4.5 mg/dL, and potas-sium between 3.5 and 5.4 mmol/L were considered. The hemogram was analyzed using the cytochemical/ isovolumetric method with an ABX Micros 60 device (Horiba, Kyoto, Japan). The interdialytic weight gain was calculated based upon the weight measurement before and after the hemodialysis session, and the av-erage gain of each patient over the past 3 months was considered.
The electrocardiogram was performed in the first hour of the hemodialysis session in all patients who signed the informed consent form, and the record-ings were taken using 2 electrocardiographs with the
Dixtal 3-channel 12-lead EP-3 machine (Dixtal, São Paulo, Brazil), on a single page printed on common non-thermally sensitive paper, using a common pen of the roller-ball type. The review of the recordings was conducted according to the Interpretation Guidelines for Electrocardiogram at Rest of the Brazilian Society of Cardiology.
wave, which represents ventricular depolarization and repolarization. The corrected QT interval (QTc) was used, as it is considered more accurate since it takes heart rate into consideration. Consequently, QTc was calculated by applying the Bazett’s equation (QTc = QT/√RR). The QTc was considered prolonged when it was greater than 440 ms.9-11
Blood pressure measurements were taken in the predialysis, intradialytic, and post-dialysis periods, with the first measurement taken 30 minutes before the beginning of the hemodialysis session, 6 measure-ments taken during the session, and 1 measurement taken immediately after the end of the session. For the measurement, the patient was in a supine and semi-seated position and adjusted to the dialysis chair, in a cool environment, at rest for at least 5 minutes. The cuff was comfortably positioned and adjusted around the arm, above the cubital malleolus with the cuff ori-ented to the brachial artery path of the limb without arteriovenous fistula (AVF). To determine the ankle brachial index (ABI), the first blood pressure mea-surement described above (the predialysis measure-ment) was used to calculate the ABI according to the following formula: ABI = (SBPa/SBPb), where SBPa = systolic blood pressure of the ankle, and SBPb = systolic blood pressure of the arm.
Statistical analysis was conducted using SigmaPlot
version 12.0 (Systat Software Inc., Illinois, USA) and Statistical Analysis System (SAS) 9.2 (SAS Institiute, Inc. North Carolina, USA). The data were previous-ly assessed with regard to the distribution using the
Shapiro-Wilk normality test. The Student t-test was used to assess differences between quantitative vari-ables, and when appropriate, the Mann-Whitney test was used. Qualitative variables were analyzed using the Chi-squared test. Values of p < 0.05 were con-sidered statistically significant. The univariate logistic regression model was used, considering the presence or absence of the prolonged QT interval a response variable of interest in the patients with regard to each of the risk variables such as diabetes, systemic arterial hypertension, coronary insufficiency, cardiac failure, dialysis time, BMI, race, sex, age at the time of the study, and age when the therapy was initiated. Then, the multivariate logistic model was used, considering all explanatory variables together. The stepwise vari-able selection method was used to choose the statisti-cally significant variables in relation to the presence of a prolonged QT interval.
Variable (n = 179) Hemodialysis patients Age (years [mean ± SD]) 58.5 ± 14.7
Males n/% 116/64.8%
Race n/%
White 98/54.7%
Black 35/19.5%
Mixed 43/24.0%
Asian 3/1.6%
Time in RRT*(years/median [min-max]) 2.7 (0.10-21.5) Age when RRT was initiated (years
[mean ± SD]) 54.9 ± 15.0
Vascular Access (n/%)
Arteriovenous fistula 125/69.9%
Vascular graft (PTFE)** 4/2.2%
Long-term catheter 34/18.9%
Double lumen catheter (temporary) 16/8.9%
Base Kidney Disease (n/%)
SAH 81/45.2%
Diabetes mellitus 47/26.2%
Tubulointerstitial nephropathy 12/6.7%
Polycystic kidney disease (n/%) 7/3.9%
Urological disease 5/2.8%
Other 27/15.1%
BMI (Kg/m² [mean ± SD]) 24.9 ± 5.6
Current smoking (n/%) 4/2.2%
Previous smoking (n/%) 73/40.7%
Current alcohol consumption (n/%) 4/2.2% Previous alcohol consumption (n/%) 21/11.7%
TABLE 1 PATIENTDEMOGRAPHIC, CLINICAL, ANDLABORATORY
CHARACTERISTICS
* RRT: renal replacement therapy; ** polytetrafluoroethylene tubular synthetic graft; SD: standard deviation; BMI: body mass index.
R
ESULTSOn the 6th and 7th of June, 2011, 183 patients in a regular hemodialysis program at the UNICOM clinic were identified. All of the patients were invited to par-ticipate in the study, of which 179 consented to be-ing included by signbe-ing a consent form; most patients were white males with an average age of 58.5 years. Table 1 shows the demographic, clinical, and labora-tory characteristics of the study participants.
prevalence of 4.44%. LVH was found in 65 patients. Approximately 50% of the patients showed at least 1 electrical conduction disturbance. The abnormal elec-trocardiographic findings in the study are shown in Table 2.
Abnormal electrocardiographic findings
Hemodialysis patients (n/%) Non-Sinus Rhythm (n/%)
Atrial fibrillation 8/4.44%
Atrial ectopic rhythm or migratory
atrial pacemaker 5/2.79%
Junctional rhythm 1/0.55%
LVH n/%
Cornell product ≥ 2440 mm/ms
65/36.31%
(RaVL + SV3 [+6 (Female)] × QRS duration)
Electrical conduction delay (n/%)
AVB 14/7.82%
ASDB 26/14.5%
RBBB 18/10.05%
LBBB 27/15.08%
Prolonged QT interval (n/%) 88/49.1% (Reference value: up to 440 ms)
ST segment change (n/%) 6/3.35%
(depressed or elevated)
Tachycardia n/% 17/9.49%
Bradycardia n/% 0/0%
(Normal heart rate value: 50-100 bpm)
Extrasystole n/% 11/6.14%
TABLE 2 ELECTROCARDIOGRAPHICVARIABLESINPATIENTS UNDERGOINGHEMODIALYSIS
LVH: left ventricular hypertrophy; AVB: atrioventricular block; ASDB: anterior superior division block; RBBB: right bundle branch block; LBBB: left bundle branch block.
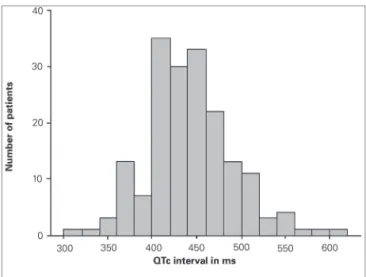
Figure 1. Distribution of the QTc Interval in patients undergoing hemodialysis. QTc: corrected QT interval.
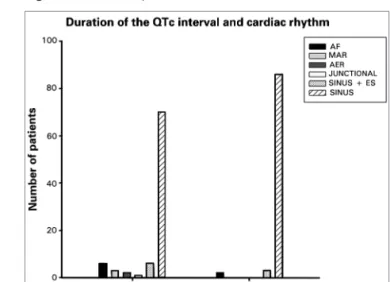
With regard to the presence of comorbidities, a greater percentage of patients with diabetes mellitus was observed in the prolonged QT group (p = 0.027). Patients with prolonged QTc presented with a higher age, longer time in renal replacement therapy (RRT), and a lower percentage of AVS as an access pathway when compared to the group with QTc below or equal to 440 ms, even when these data did not reach statis-tical significance. No differences were found between the 2 groups for classical markers of atherosclerotic cardiovascular disease such as ABI, systolic blood pres-sure, and waist/hip ratio. Patients with prolonged QTc intervals experienced a greater frequency of changes in heart rate, bundle branch blocks, and LVH relative to those with normal QTc intervals (p = 0.010, 0.001, and 0.044, respectively). The ratio between QTc interval duration and heart rate is represented in Figure 2.
The link between the presence of prolonged QT interval and BMI was observed from the comparison to patients with normal QT intervals. Patients with BMI of ≤ 18.5 presented a 3.08 times higher chance of having a prolonged QT interval (95% confidence interval; p = 0.0281) in relation to patients with BMI of ≥ 25. In a subsequent adjustment for a variety of covariables, including diabetes, systemic arterial hypertension, coronary insufficiency, cardiac failure, dialysis time, BMI, race, sex, age at the time of the study, and age at which dialytic therapy was initiated, this link was maintained, with an odds ratio of 4.52 (95% confidence interval: 1.56-13.05; p = 0.0054) found for patients with BMI of ≤ 18.5, and an odds ratio of 2.18 (95% confidence interval: 1.09-4.39; p = A QTc interval above 440 ms was identified in
49.1% of the patients, with a median of 437 ms, reaching between 306 and 603 ms; the distribution of the QTc interval in the study population is shown in Figure 1.
TABLE 3 COMPARATIVEANALYSISOFCLINICAL, LABORATORY, ANDELECTROCARDIOGRAPHICVARIABLESACCORDINGTOTHE
DURATIONOFTHE QTCINTERVAL
Variable QT > 440 ms n = 88 QT ≤ 440 ms n = 91 p
Age (years; mean ± SD) 60.4 ± 14.4 56.8 ± 14.9 0.093¨
Age < 60 years (%) 45.1 54.9
0.322
Age ≥ 60 years (%) 53.0 46.6
RRT time (years/median [min-max]) 3.1 [0.10-21.5] 2.47 [0.10-14.5] 0.078*
Vascular access for HD (n/%)
AVF 58/65.9% 67/73.6% 0.100**
Catheter 30/34% 24/26.4%
URR (median [min-max]) 66.4 [38.6-98.5] 65.7 [43.3-83.7] 0.657*
Ktv (median [min-max]) 1.4 [0.77-4.86] 1.4 [0.73-2.45] 0.909*
Interdialytic weight gain (Kg [min-max]) 2.2 [-0.36-4.2] 2.2 [0.16-4.4] 0.656¨
Presence of comorbidities (n)
SAH 50 62 0.614
Diabetes Mellitus 37 24 0.027
Cardiac failure 12 9 0.436
Coronary insufficiency 11 10 0.753
BMI (mean ± SD) 23.7 ± 5.3 25.9 ± 5.6 0.006¨
BMI < 18.5 (n/%) 15/68.2% 7/31.8%
0.064
BMI 18.5-24.9 (n/%) 41/51.9% 38/48.1%
BMI > 25 (n/%) 32/41.0% 46/59%
Waist/hip ratio (range) 0.96 [0.76-1.20] 0.96 [0.79-1.20] 0,863¨
ABI 1.0 ± 0.17 1.0 ± 0.18 0,748¨
SBP pre (mmHg; mean ± SD) 130 ± 15 140 ± 17 0,141¨
Heart rate (range) 79 [45-148] 72 [50-108] < 0,001*
Heart rate (n)
Sinus 70 86
0,010**
Non-sinus 18 5
Bundle branch block (RBBB or LBBB) n/% 33/37.5% 12/13.2% 0,001**
Cornell (mm/ms [range]) 2300 [500-7000] 1840 [450-6960] 0,044*
P wave duration (ms [range]) 80 [30-160] 80 [20-120] 0,835*
P wave amplitude 0.10 [0.05-0.30] 0.10 [0.05-0.30] 0,785*
Serum Potassium (mEq/L; mean ± SD) 5.4 ± 0.9 5.5 ± 0.8 0,325¨
Calcium (mg/dL; mean ± SD) 9.0 ± 1.1 9.2 ± 0.9 0,725¨
Ca × P (mean ± SD) 44.8 ± 15.8 46.5 ± 17.3 0,665¨
Phosphorus (mg/dL) 4.5 [2.0-9.6] 4.7 [1.4-9.6] 0,609¨
Hb (g/dL; mean ± SD) 10.8 ± 1.5 10.8 ± 1.6 0,980¨
SD: Standard Deviation; ABI: Ankle Brachial Index. Nonsinosoidal rhythm: atrial fibrillation, atrial rhythm migration, and atrial ectopic rhythm with extrasystoles. Pre SBP: systolic blood pressure pre-hemodialysis session. BMI: Body Mass Index (weight [kg] / height [m]2).
* Mann-Whitney; ** chi-square test / Fisher; ¨ Student t-test.
0.0287) for patients in the BMI category of 18.5-24.9 relative to patients with BMI of ≥ 25. Of all the variables mentioned above, in addition to BMI, only the presence of diabetes mellitus increased the chance of observing a prolonged QT interval, with an odds ratio of 2.03 (95% confidence interval: 1.08-3.80; p = 0.0281).
D
ISCUSSIONAmong the abnormal electrocardiographic find-ings, the great number of patients with LVH is strik-ing, and is an interesting finding when we consider that the screening test used for the diagnosis of LVH is the electrocardiogram. In the overall population, an electrocardiogram shows low diagnostic sensitivity in the detection of LVH, while echocardiograms and magnetic resonance imaging have higher diagnostic sensitivity. In a study involving 100 patients under-going a regular hemodialysis program who simulta-neously underwent electrocardiogram and echocar-diogram tests, Costa et al.12 found sensitivities above 50% for all the electrocardiographic LVH criteria in the study. These results were attributed to the Cornell product, the criteria adopted in this study, which showed the highest performance when compared to the echocardiogram, with a sensitivity of 57.8%, specificity of 94.1%, Pearson correlation coefficient of 0.61 (p < 0.05), likelihood ratio of 9.8, and an the area under the curve of 0.83 in the receiver operating characteristic curve analysis.
In our review, sinus rhythm was present in the great majority of the patients, AF rhythm in 8 pa-tients, and junctional rhythm in only 1 patient, find-ings similar to those found in an Australian study by
Abe et al.,7in which the authors reported percentages of 97%, 3%, and the 0.4% for these rhythm types, respectively.
AF is the most common supraventricular cardiac arrhythmia in the hemodialysis population, and the associated and predisposing conditions to its devel-opment such as older age, atrial dilation, presence of coronary disease, and low serum levels of albumin
are well documented in the medical literature13,14. We showed a low prevalence of AF compared to other published data regarding patients undergoing hemo-dialysis. Acar et al.13 found a prevalence of 13.1% in an analysis of 183 patients with an average age of 52 years and average time of RRT of 41.6 months, char-acteristics similar to those found in our population sample; patients with AF had an average age of 64.9 ± 9.8, statistically higher than the group without AF, which was 49.9 ± 16.6 (p < 0.001).
In our study, of the 8 patients with AF, 4 were hy-pertensive and 2 were diabetic, with an average age of 66.0 ± 15 years. In the study by Atar et al.,15 the prevalence of AF was 10.9% and 13.6% in a Spanish study with 190 patients undergoing a hemodialysis program conducted by Vázquez et al.16 Our study was not designed to assess AF, which would certainly require the use of an echocardiogram to determine echocardiographic variables, known to be linked to AF. Furthermore, we were strictly rigorous with the
electrocardiographic criteria to define AF, distinguish-ing it from rhythms such as migratory atrial rhythm and ectopic atrial rhythm, which, in part, can explain the low prevalence of AF found in our study.
Approximately 50% of the patients showed pro-longation of the QT interval above 440 ms, a condi-tion that was linked to a higher frequency of LVH (p = 0.044), presence of bundle branch blocks (p = 0.001), and non-sinus rhythm (p = 0.010). The link between LVH and prolonged QT interval has previ-ously been demonstrated by other authors in cross-sectional studies conducting echocardiograms and electrocardiograms simultaneously.17 In our study,
there was a tendency for patients with prolonged QT intervals to be in dialytic therapy for a longer period, to be older, and to have a higher percentage of cathe-ter use, such as vascular access when compared to the group of patients with QT below 440 ms, although these data did not reach statistical significance.
We showed a link between BMI and the presence of prolongation of the QTc interval in hemodialysis patients. The risk of death in patients with CKD and
inflammation and/or malnutrition is well documented in the medical literature18. However, there are no re-cent studies that have explored the pathophysiological mechanisms, other than the inflammatory pathway, involved in the higher mortality of malnourished pa-tients, nor are there studies showing the link demon-strated in the present study for hemodialysis patients. Figure 2. Relationship between QTc interval and heart rate.
Older published case reports involving survivors of the Second World War reported a high prevalence of prolongation of the QT interval in malnourished individuals19. Olivares et al.20 found higher QTc inter-val inter-values in malnourished children relative to healthy controls (p = 0.000). There are no published studies that have demonstrated the link between malnourish-ment and sudden death related to the prolongation of the QT interval; however, the link between low BMI and prolongation of the QTc interval shown in our study suggests that the prolonged QT interval may be a link between malnourishment and sudden death in the hemodialysis population.
There were some limitations in our study. The first was the use of BMI alone as a single marker for the nutritional status of the patients, as it was not pos-sible to use other nutritional markers such as the Subjective Global Assessment, serum albumin level, and assessment by bioimpedance. BMI is one of the most widely used anthropometric indices in clinical practice to determine nutritional status; however, in the hemodialysis population, the use of anthropomet-ric indices may result in assessment errors depending on the hydration status of the tissues.
A second limiting factor in the study concerns performing the electrocardiogram in the intradialytic period, in which changes in the concentrations of cal-cium, potassium, magnesium, and bicarbonate due to hemodialysis may induce disturbances in the cardiac electrical conduction21. Genovesi et al.22, using dialy-sates with different concentrations of calcium (K+ of 2 and 3 mmol/L; Ca2+ of 1.25, 1.5, or 1.75 mmol/L), observed QTc > 440 ms in 56% of the patients in which the dialysate contained the lower concentra-tions of calcium and potassium, and only 18% of the patients in which dialysate was prescribed with higher concentrations of these ions. Similar results were found by Di Iorio et al.23, as the QTc interval was significantly more prolonged in patients with dialysate that contained the lowest concentrations of calcium and potassium and the highest concentra-tions of bicarbonate. In a study involving patients with CKD at hemodialysis stages IV and V, Di Iorio
et al.24 showed that cardiac calcification, measured by the calcium score using computerized tomography (CT score), was an independent determining factor for the QT interval, presenting a linear and positive ratio, such that the higher the CT score, the higher the dispersion of the QT interval.
C
ONCLUSIONElectrocardiograms are affordable diagnostic tools for renal therapy centers in Brazil that provide important information regarding cardiac electrical conduction, some of which has prognostic implications in terms of cardiovascular mortality. Acquired prolonged QT interval syndrome is a highly prevalent condition in patients with CKD undergoing hemodialysis, and is one of the known pathophysiological mechanisms of sudden death in this population. Nephrologists must pay attention to identify patients with prolongation of the QT interval and the associated clinical and laboratory conditions, such as structural changes of the heart, cardiac calcification, and the prescription of drugs that induce QT interval prolongation, par-ticularly in patients already presenting an extended QT interval.
In this cross-sectional study, we demonstrated a link between BMI and the presence of a prolonged QTc interval on electrocardiogram. New studies need to be outlined, using accurate nutritional status mark-ers for hemodialysis patients, to better observe the possible link between malnourishment and prolonged QTc interval.
R
EFERENCES1. Cheung AK, Sarnak MJ, Yan G, Dwyer JT, Heyka RJ, Rocco MV, et al. Atherosclerotic cardiovascular disease risks in chro-nic hemodialysis patients. Kidney Int 2000;58:353-62. 2. Shastri S, Sarnak MJ. Cardiovascular disease and CKD: core
curriculum. Am J Kidney Dis 2010;56:399-417.
3. Kanbay M, Afsar B, Goldsmith D, Covic A. Sudden death in hemodialysis: an update. Blood Purif 2010;30:135-45. 4. Green D, Roberts PR, New DI, Kalra PA. Sudden cardiac death
in hemodialysis patients: an in-depth review. Am J Kidney Dis 2011;57:921-9.
5. Bleyer AJ, Hartman J, Brannon PC, Reeves-Daniel A, Satko SG, Russell G. Characteristics of sudden death in hemodialysis pa-tients. Kidney Int 2006;69:2268-73.
6. Bozbas H, Atar I, Yildirir A, Ozgul A, Uyar M, Ozdemir N, et al. Prevalence and predictors of arrhythmia in end stage renal disease patients on hemodialysis. Ren Fail 2007;29:331-9. 7. Abe S, Yoshizawa M, Nakanishi N, Yazawa T, Yokota K,
Hon-da M, et al. Electrocardiographic abnormalities in patients re-ceiving hemodialysis. Am Heart J 1996;131:1137-44.
8. Gussak I, Gussak HM. Sudden cardiac death in nephrology: focus on acquired long QT syndrome. Nephrol Dial Transplant 2007;22:12-4.
9. Lorentz MN, Ramiro FG. Anesthesia and the long QT syndro-me. Rev Bras Anestesiol 2007;57:543-8.
10. Bonow RO, Mann DL, Zipes DP, Libby P (eds). Braunwald's Heart Disease: A Textbook of Cardiovascular Medicine. 9th Edition. Philadelphia: Elsevier; 2011.
12. Costa FdeA, Rivera IR, Vasconcelos ML, Costa AF, Póvoa RM, Bombig MT, et al. Electrocardiography in the diagnosis of ven-tricular hypertrophy in patients with chronic renal disease. Arq Bras Cardiol 2009;93:380-6.
13. Acar G, Akçay A, Dogan E, Işik IO, Sökmen A, Sökmen G, et al. The prevalence and predictors of atrial fibrillation in hemo-dialysis patients. Turk Kardiyol Dern Ars 38:8-13.
14. Abbott KC, Trespalacios FC, Taylor AJ, Agodoa LY. Atrial fibrillation in chronic dialysis patients in the United States: risk factors for hospitalization and mortality. BMC Nephrol 2003;4:1.
15. Atar I, Konas D, Açikel S, Külah E, Atar A, Bozbaş H, et al. Frequency of atrial fibrillation and factors related to its develo-pment in dialysis patients. Int J Cardiol 2006;106:47-51. 16. Vazquez E, Sanchez-Perales C, Borrego F, Garcia-Cortés MJ,
Lozano C, Guzmán M, et al. Influence of atrial fibrillation on the morbido-mortality of patients on hemodialysis. Am Heart J 2000;140:886-90.
17. Stewart GA, Gansevoort RT, Mark PB, Rooney E, McDonagh TA, Dargie HJ, et al. Electrocardiographic abnormalities and uremic cardiomyopathy. Kidney Int 2005;67:217-26.
18. Parekh RS, Plantinga LC, Kao WH, Meoni LA, Jaar BG, Fink NE, et al. The association of sudden cardiac death with inflammation and other traditional risk factors. Kidney Int 2008;74:1335-42.
19. Webb JG, Kiess MC, Chan-Yan CC. Malnutrition and the heart. CMAJ 1986;135:753-8.
20. Olivares JL, Vazquez M, Rodriguez G, Samper P, Fleta J. Elec-trocardiographic and echocardiographic findings in malnouri-shed children. J Am Coll Nutr 2005;24:38-43.
21. Wu VC, Lin LY, Wu KD. QT interval dispersion in dialysis patients. Nephrology (Carlton) 2005;10:109-12.
22. Genovesi S, Dossi C, Viganò MR, Galbiati E, Prolo F, Ste-lla A, et al. Electrolyte concentration during haemodialysis and QT interval prolongation in uraemic patients. Europace 2008;10:771-7.
23. Di Iorio B, Torraca S, Piscopo C, Sirico ML, Di Micco L, Pota A, et al. Dialysate bath and QTc interval in patients on chronic maintenance hemodialysis: pilot study of single dialysis effects. J Nephrol 2011; doi: 10.5301/jn.5000036. [Epub ahead of print] 24. Di Iorio BR, D’Avanzo E, Piscopo C, Grimaldi P, Cucciniello