Authors
Luis Gustavo Modelli de Andrade1
Paula Dalsoglio Garcia1 Mariana Moraes Contti1 Andre Lopes da Silva1 Vanessa Burgugi Banin1
Juliana da Cunha Duarte1 Maria Fernanda Cordeiro de Carvalho1
1 School of Medicine of
Botucatu - UNESP.
Submitted on: 11/12/2013. Approved on: 02/18/2014.
Correspondence to: Luis Gustavo Modelli de Andrade. School of Medicine of
Botucatu - UNESP. General Practice Department - Nephrology. Av. Prof. Montenegro, s/nº, Distrito de Rubião Junior. Botucatu, SP, Brazil. CEP: 18618-970. E-mail: [email protected]
I
NTRODUCTIONKidney transplantation is an important mode of renal replacement therapy.1,2
The number of procedures has increased along with the recommendations and global support for renal transplants.3,4
The Brazilian program for organ transplants is probably the largest government-funded transplant program in the world (95% of the transplants are performed under the auspices of the Brazilian Public Health Service, the SUS). It is characterized by a fair and transparent organ allocation system unbiased by social, racial or cultural agendas. However, it is fraught with geographic disparities. In 2009, 62% of the kidney transplants in the country were performed in the Southeast region, followed by the South with 19%, the Northeast with 14%, the Midwest with 4%, and the North with 1%.5
In 2011, 24 (16%) of the 147 kidney transplantation teams in Brazil performed 50 or more transplants (averaging one procedure per week).4
Seven of these teams (29.2%) are located in the State of São Paulo.
The renal transplantation service of the Hospital of the School of Medicine of Botucatu started in 1987 grew over the last decade to reach 600 transplants (532 in adults and 68 in children and adolescent) by the end of 2011.
Over the past 24 years, countless factors have impacted the outcomes of transplantation in general. The survival of patients and grafts increased gradually,
The 600 kidney transplants performed at the Botucatu
Medical School Hospital - UNESP: Changes over
Introduction: A progressive improvement in kidney transplant outcomes has been achieved over the last decades. Objective: To determine the degree to which this has occurred in our center, we conducted an outcome analysis of our kidney transplant program during three different time periods, especially focusing on patient and graft survival. Methods: The 600 kidney transplants performed at Botucatu Medical School/UNESP up to December 2011 were examined. Three different time periods were chosen to correspond with major shifts in immunosuppressant usage: Era 1 (1987-2000), cyclosporine and azathi-oprine usage (n = 180); Era 2 (2001-2006), cyclosporine and mycophenolate mofetil usage (n = 120); and Era 3 (2007-2011), tacrolimus and mycophenolate mofetil usage (n = 300). Results: Compared with the first era, mean recipient age, diabetes prevalence, and the number of living donor transplantations (60%) were increased in the third era. Induction therapy was used in 75% of the cases in Era 3, 46.6% in Era 2, and in 3.9% in Era 1 (p < 0.0001). The mean number of transplants/year rose from 14 in Era 1 to 75 in Era 3. Overall survival according to donor type was similar to that reported in the literature. Five-year graft sur-vival following deceased donor transplanta-tion progressively increased from 13.1% (Era 1) to 81.9% (Era 3). Conclusion: Significant differences were observed over time. The percentage of living donors decreased as that of deceased donors increased. Survival af-ter deceased donor transplants was greatest in Era 3, probably due to the improved experience of the medical team, and to the use of tacrolimus and mycophenolate mofetil combination with induction.
A
BSTRACTwhile immunosuppressive therapies made impor-tant advances with the introduction of new drugs. Changes to the profiles of donors and recipients, such as older mean age and number of pre-transplant comorbidities, have also been observed.6-11
O
BJECTIVEThis study aimed to assess the 600 kidney transplants performed at the Hospital of the School of Medicine of Botucatu - UNESP by December of 2011. Patients were subdivided into three periods in accordance with the immunosuppressive therapies available in each period, so as to elicit the temporal differences of patient and graft survival.
M
ATERIALS AND METHODSThe 600 kidney transplants performed at the Hospital of the School of Medicine of Botucatu between June of 1987 and December of 2011 were retrospectively evaluated in this study. Transplant patients were divided based on immunosuppression regimens into three different periods. Period 1: from 1987 to 2000 (n = 180), when azathioprine combined with cyclosporine and prednisone was the standard care. Period 2: 2001-2006 (n = 120), when mycophenolate associated with cyclosporine and prednisone was the regimen used in the service. Period 3: 2007-2011 (n = 300), when tacrolimus in association with mycophenolate and prednisone were the immunosuppressants of choice.
Assessments were based on recipient demographics, type of dialysis offered before transplantation (hemodialysis, peritoneal dialysis, or conservative care), time on dialysis, underlying disease, donor type (living or deceased), donor demographics, frequency of rejection episodes, immunosuppression used in early transplantation, frequency and causes of graft loss, frequency and causes of death, and survival curves for grafts and patients. Delayed function was considered for deceased donors and described as need for hemodialysis in the first week.
STATISTICS
The Kolmogorov-Smirnov (KS) test was performed to segregate parametric and non-parametric continuous variables. Analysis of variance (one-way ANOVA)
was used to analyze the mean values of normally distributed variables in the three study groups, assuming equal variances between groups. Levene’s test was used to assess variance homogeneity. The Bonferroni post test was used in group subanalysis. The Kruskal-Wallis test for analysis of variance was used with non-parametric variables. Dunn’s post test was used to compare between subgroups. Categorical variables were analyzed based on the chi-square test or Fisher’s exact test when appropriate. Survival curves were built using the Kaplan-Meier method and compared using the Log Rank test.
Results were considered statistically significant when p < 0.05. Statistical analysis were performed on SPSS® version 13.0.
R
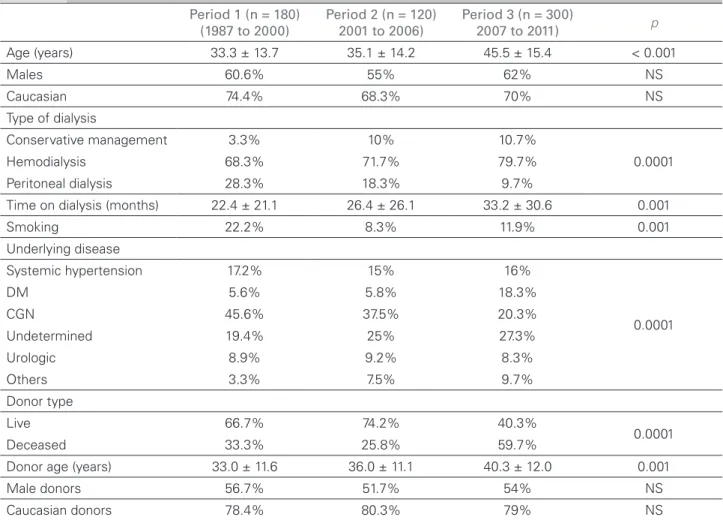
ESULTSTable 1 shows the characteristics of recipients and donors in the three studied periods.
On period 1, patients had a mean age of 33.3 ± 13.7 years; on period 2, mean age was 35.1 ± 14.2; and on period 3, mean age was 45.5 ± 15.4 years (p = 0.001). In the three periods most of the recipients were males and Caucasian.
Hemodialysis was the most frequent mode of dialysis offered to patients in the three studied periods. However, there has been a significant decrease in the number of patients on peritoneal dialysis along with growing numbers of patients on pre-transplant conservative care in recent years (p = 0.0001). Time on dialysis before transplantation has also increased over the years (p = 0.001).
Smoking was a significantly more frequent habit among patients in the first period (22.2%) than in periods 2 (8.3%) and 3 (11.9%), p = 0.001.
Related living donors were more common in periods 1 (66.7%) and 2 (74.2%), while deceased donors were more frequent in period 3 (59.7%) (p = 0.0001).
Donor age increased progressively through the periods. In period 1, donor mean age was 33 ± 11.6 years; in period 2 it grew to 36 ± 11.1 years; and in period 3 donor mean age was 40.3 ± 12 years (p = 0.001). The rates of occurrence of Caucasian and male donors were similar in the three periods.
Table 2 shows data on post-transplantation outcomes.
Most patients (96.1%) were not given induction immunosuppression on period 1. In periods 2 and 3, induction protocols with baxilimab were used in 45.8% and 70% of the cases, respectively (p = 0.0001).
The occurrence of deceased donor delayed graft function decreased when the more recent period (58.3%) was compared to periods 2 (82.1%) and 1
Figure 1A depicts the overall survival of the 600 patients divided by donor type. The survival of patients on living donor transplants was 99.4% within one year of the procedure, 93.7% within five years, and 91.4% within 10 years of transplantation. The survival of deceased donor transplant patients was 93.3% within one year of the procedure, 84.3% within five years, and 78.7% within 10 years of transplantation (p = 0.0001).
Figure 1B shows the overall graft survival of the 600 patients divided by donor type. Graft survival of living donor transplant patients was 97.6% within one year of the procedure, 88.6% within five years, and 83.6% within 10 years of transplantation. Graft survival of deceased donor transplant patients was 91.9% within one year of the procedure, 83.1% within five years, and 72.1% within 10 years of transplantation (p = 0.0001).
Figure 2A depicts the survival of living donor transplant patients for each period of time. No statistically significant differences were seen
Period 1 (n = 180) (1987 to 2000)
Period 2 (n = 120) 2001 to 2006)
Period 3 (n = 300)
2007 to 2011) p
Age (years) 33.3 ± 13.7 35.1 ± 14.2 45.5 ± 15.4 < 0.001
Males 60.6% 55% 62% NS
Caucasian 74.4% 68.3% 70% NS
Type of dialysis
Conservative management 3.3% 10% 10.7%
0.0001 Hemodialysis 68.3% 71.7% 79.7%
Peritoneal dialysis 28.3% 18.3% 9.7%
Time on dialysis (months) 22.4 ± 21.1 26.4 ± 26.1 33.2 ± 30.6 0.001
Smoking 22.2% 8.3% 11.9% 0.001
Underlying disease
Systemic hypertension 17.2% 15% 16%
0.0001
DM 5.6% 5.8% 18.3%
CGN 45.6% 37.5% 20.3%
Undetermined 19.4% 25% 27.3%
Urologic 8.9% 9.2% 8.3%
Others 3.3% 7.5% 9.7%
Donor type
Live 66.7% 74.2% 40.3%
0.0001 Deceased 33.3% 25.8% 59.7%
Donor age (years) 33.0 ± 11.6 36.0 ± 11.1 40.3 ± 12.0 0.001
Male donors 56.7% 51.7% 54% NS
Caucasian donors 78.4% 80.3% 79% NS
TABLE 1 RECIPIENTANDDONORCHARACTERISTICSINTHREETIMEPERIODS: PERIOD 1 (1987 TO 2000), PERIOD 2 (2001 TO 2006)
ANDPERIOD 3 (2007 TO 2011)
Figure 2B shows the survival of living donor grafts for each period of time. Within one year of transplantation, 90.8% of the grafts had survived in period 1, 87.5% in period 2, and 95.8% in period 3; within three years of transplantation, 73% of the grafts had survived in period 1, 73.6% in period 2, and 92% in period 3; within five years of transplantation, 52.3% of the grafts had survived in period 1. 67.7% in period 2, and 90.9% in period 3 (p = 0.16).
Figure 3A depicts the survival of deceased donor transplant patients for each period of time. No statistically significant differences were seen between survival rates in the three analyzed periods.
Figure 3B shows the survival of deceased donor grafts for each period of time. Within one year of transplantation, 61.3% of the grafts had survived in period 1. 75% in period 2, and 93.9% in period 3; within three years of transplantation, 36.6% of the grafts had survived in period 1, 41% in period 2, and 86.2% in period 3; within five years of transplantation, 13.7% of the grafts had survived in period 1. 38% in period 2, and 81.9% in period 3 (p = 0.0001).
D
ISCUSSIONThe 600 renal transplant patients seen in our institution until December of 2011 were divided into three periods based on the standard immunosuppression regimen in effect at each time. The review performed on these cases revealed improvements have been attained for recipients and donors. In period 3, recipient mean ages were significantly higher and more comorbidities, such as hypertension and diabetes, were present. Patients currently on renal replacement therapy are older and diabetes is a more prevalent condition among them.10 The number of deceased
donor transplants and donor mean ages have increased, as observed in the Brazilian transplant population.4 In general terms, our outcomes were
similar to those described by Chakkera et al.,7 in
which 51,500 renal transplant cases in the United States Renal Data system database were reviewed and stratified into three periods based on the immunosuppression regimen in effect at each time period. The authors reported increases on patient mean age, number of pre-transplant comorbidities, and number of patients undergoing transplantation without prior dialysis. Donors were also found to
TABLE 2 POST-TRANSPLANTATIONOUTCOMEINTHREETIMEPERIODS: PERIOD 1 (1987 TO 2000), PERIOD 2 (2001 TO 2006)
ANDPERIOD 3 (2007 TO 2011) Period 1 (n = 180)
(1987 to 2000)
Period 2 (n = 120) (2001 to 2006)
Period 3 (n = 300)
(2007 to 2011) p
Rejection 37.2% 36.7% 22.3% 0.0001 Induction
No 96.1% 53.3% 25%
0.0001 Basiliximab 3.9% 45.8% 70%
Thymoglobulin 0% 0.8% 5% Immunosuppression
Aza + Pred 24% 1.7% 0.3%
0.0001 Aza + Pred + CSA 74.9% 8.3% 0
Aza + Pred + Tacro 0 4.2% 14.7% M + Pred + Tacro 0 35.8% 79.3%
M + Pred 0.6% 11.7% 5.7%
M + Pred + CSA 0.6% 38.3% 0
Delayed graft function 75% 82.1% 58.3% 0.009 Time to discharge (days) 25.8 ± 12.4 17.8 ± 11.5 15.9 ± 13.9 0.001 Follow-up time (months) 97.3 ± 80 73 ± 44.2 28 ± 19 0.001 Graft loss 44.2% 15.5% 10% 0.0001
Death 31.7% 22.5% 15% 0.0001
Figure 1. A: Patient survival in the three time periods (1987-2011) divided by donor type (live or deceased), p = 0.0001; B: Graft survival in the three
time periods (1987-2011) divided by donor type (live or deceased), p = 0.0001.
Figure 2. Live donor survival in three time periods: period 1 (1987-2000), period 2 (2001-2006) and period 3 (2007-2011); A: Patient survival p = NS; B: Graft survival, p = NS.
be older than in earlier periods, and more cases of deceased donors with cerebrovascular disease as the cause of death were recorded. Chakkera
et al.7 also reported increases in graft and patient
survival over the years.
Our findings also indicated increased use of induction immunosuppression in different periods, culminating with 75% of the cases using induction in the more recent period (70% basiliximab; 5% Thymoglobulin), versus 46.6% in period 2, and 3.9% in period 1 (p < 0.0001). The main immunosuppressive therapy used in the more recent period included combinations of tacrolimus
azathioprine (15%). Cyclosporine and mycophenolate (38.3%) was the regimen of choice in period 2, while in period 1 protocols were based mainly on cyclosporine and azathioprine (75%), all of which in combination with prednisone. These findings follow the current trends seen in other centers in the country and the world, with the combination of tacrolimus and mycophenolate plus prednisone as the most frequently used regimen.3,13 According to Van
den Hoogen et al.,14 the combination of low-dose
improved graft survival when compared to the combinations of cyclosporine and mycophenolate, low-dose cyclosporine and mycophenolate, and sirolimus and mycophenolate. Decreases in acute rejection rates were also seen in our group of patients (22.3% in period 3; 36.7% in period 2; and 37.2% in period 1; p < 0.0001). Such reduction probably reflects the improvements in current immunosuppressive therapy and the more frequent use of induction therapies which, combined, have led to lower rejection rates.
The number of transplants performed over the three different periods of time in our service has also grown. Period 1 covered the first 13 years of our service and included 180 transplants, or a mean 14 transplants per year. Period 2 spanned through five years and included 120 transplants, or a mean of 24 per year. Period 3 encompassed four years and 300 transplants, or a mean of 75 procedures per year. The gradual increase seen in the number of renal transplants was mostly the result of the growth in transplants from deceased donors (60%), a finding in line with the reality of other transplant centers in Brazil.4
Overall survival rates by donor type were in agreement with the literature: for live donors, patient and graft one-year survival rates were 99.4% and 97.6%, respectively; and patient and graft ten-year survival rates were 91.4% and 83.6%, respectively. For deceased donors, patient and graft one-year survival rates were 93.3% and 83.6%, respectively; and patient and
graft ten-year survival rates were 78.7% and 72.1%, respectively. These survival rates were similar to the rates reported by the 2011 Brazilian Transplant Registry,4 the OPTN and the SRTR3 in
the United States, and by large transplant centers in Brazil.13,15
No differences were seen in the survival curves of live donor organ recipients. Renal transplants with deceased donors, however, showed significant differences in survival in different periods. Gradual increases in graft survival were observed over the periods. Within five years, graft survival rates moved from 13.7% in period 1 to 38% in period 2, and to 81.9% in period 3 (p = 0.0001). The survival curves of deceased donor organ recipients are in agreement with the data from the UNOS and CTS in Europe.16 The disparities in the survival
rates of live and deceased donor transplants may be explained by the additional challenges posed by the latter transplant type. Immunosuppressive therapies based mainly on cyclosporine and azathioprine, reduced use of induction regimens, and the limited experience of our center (mean of 14 procedures per year) may have contributed to the inferior outcomes seen in period 1. In contrast, the improved survival rates of deceased donor transplants seen in period 3 may be explained by improved immunosuppressive therapy based mainly on the combination of tacrolimus with mycophenolate, greater use of induction regiments, and the experience accumulated in our service, now handling a mean of 75 transplants a year.
Figura 3. Deceased donor survival in three time periods: period 1 (1987-2000), period 2 (2001-2006) and period 3 (2007-2011); A: Patient survival
R
EFERENCES1. Tonelli M, Wiebe N, Knoll G, Bello A, Browne S, Jadhav D, et al. Systematic review: kidney transplantation compared with dialysis in clinically relevant outcomes. Am J Transplant 2011;11:2093-109. DOI: http://dx.doi.org/10.1111/j.1600-6143.2011.03686.x
2. Wolfe RA, Ashby VB, Milford EL, Ojo AO, Ettenger RE, Agodoa LY, et al. Comparison of mortality in all patients on dialysis, patients on dialysis awaiting transplantation, and recipients of a first cadaveric transplant. N Engl J Med 1999;341:1725-30. PMID: 10580071 DOI: http://dx.doi.org/10.1056/NEJM199912023412303
3. Organ Procurement and Transplantation Network and Scientific Registry of Transplant Recipients 2010 data report. Am J Transplant 2012;12:1-156. DOI: http://dx.doi. org/10.1111/j.1600-6143.2011.03886.x
4. Sociedade Brasileira de Transplantes. Reg Bras Transpl 2011;17(4).
5. Medina-Pestana JO, Galante NZ, Tedesco-Silva H Jr, Harada KM, Garcia VD, Abbud-Filho M, et al. Kidney transplantation in Brazil and its geographic disparity. J Bras Nefrol 2011;33:472-84. DOI: http://dx.doi.org/10.1590/S0101-28002011000400014 6. Gentil Govantes MA, Rodriguez-Benot A, Sola E, Osuna A,
Mazuecos A, Bedoya R, et al. Trends in kidney transplantation outcome: the Andalusian Kidney Transplant Registry, 1984-2007. Transplant Proc 2009;41:1583-5. DOI: http://dx.doi. org/10.1016/j.transproceed.2009.01.094
7. Chakkera HA, Chertow GM, O'Hare AM, Amend WJ Jr, Gonwa TA. Regional variation in kidney transplant outcomes: trends over time. Clin J Am Soc Nephrol 2009;4:152-9. DOI: http://dx.doi.org/10.2215/CJN.02050408
8. Kaneku HK, Terasaki PI. Thirty year trend in kidney transplants: UCLA and UNOS Renal Transplant Registry. Clin Transpl 2006;1-27.
9. Smith JM, Stablein DM, Munoz R, Hebert D, McDonald RA. Contributions of the Transplant Registry: The 2006 Annual Report of the North American Pediatric Renal Trials and Collaborative Studies (NAPRTCS). Pediatr Transplant 2007;11:366-73. DOI: http://dx.doi.org/10.1111/j.1399-3046.2007.00704.x
10. Kim SJ, Schaubel DE, Fenton SS, Leichtman AB, Port FK. Mortality after kidney transplantation: a comparison between the United States and Canada. Am J Transplant 2006;6:109-14. DOI: http://dx.doi.org/10.1111/j.1600-6143.2005.01141.x 11. Schaefer HM, Kaplan B, Helderman JH. Mortality after kidney transplantation: what lessons can we learn from regional and country variation? Am J Transplant 2006;6:3-4.
12. Peres LAB, Matsuo T, Delfino VDA, Peres CPA, Almeida Netto JH, Ann HK, et al. Aumento na prevalência de diabete melito como causa de insuficiência renal crônica Dialítica: análise de 20 Anos na região Oeste do Paraná. Arq Bras Endocrinol Metab 2007;51:111-5. DOI: http://dx.doi.org/10.1590/S0004-27302007000100018
13. Azeka E, Auler Júnior JO, Fernandes PM, Nahas WC, Fiorelli AI, Tannuri U, et al. Registry of Hospital das Clínicas of the University of São Paulo Medical School: first official solid organ and tissue transplantation report - 2008. Clinics (São Paulo) 2009;64:127-34. DOI: http://dx.doi.org/10.1590/S1807-59322009000200010 14. Van den Hoogen M, Hilbrands L. Reduced exposure to
calcineurin inhibitors in renal transplantation. N Engl J Med 2008;358:2519-20.
15. Medina-Pestana JO. Organization of a high-volume kidney trans-plant program-the "assembly line" approach. Transtrans-plantation 2006;81:1510-20. PMID: 16770238 DOI: http://dx.doi. org/10.1097/01.tp.0000214934.48677.e2