ORIGIN
AL RESEAR
CH
Q angle and subtalar pronation are not good
predictors of pain and function in individuals with
patellofemoral pain syndrome
Ângulo Q e pronação subtalar não são bons preditores de dor e função em indivíduos com
Síndrome da Dor Femoropatelar
Ángulo Q y pronación subtalar no son buenos predictores del dolor y función en individuos
con Síndrome de Dolor Femoropatelar
Danilo de Oliveira Silva1, Ronaldo Valdir Briani2, Deisi Ferrari3, Marcella Ferrazz Pazzinatto2,
Fernando Amâncio Aragão4, Fabio Mícolis de Azevedo5
This study was conducted at the Universidade Estadual do Oeste do Paraná, Physiotherapy course, Research Laboratory of Human Movement (LAPEMH) and São Paulo State University “Júlio de Mesquita Filho” (FCT/UNESP), Laboratory of Biomechanics and Motor Control
1Physical therapist master in Physiotherapy by the São Paulo State University “Júlio de Mesquita Filho” (FCT/UNESP) – Campus
Presidente Prudente (SP), Brazil.
2Physical therapist master in Physiotherapy by the São Paulo State University “Júlio de Mesquita Filho” (FCT/UNESP) – Campus
Presidente Prudente (SP), Brazil.
3Ms. Physical therapist, PhD candidate of the University of São Paulo – Graduate Program Interunits of Bioengineering – EESC/FMRP/
(IQSC-USP) – São Carlos (SP), Brazil.
4PhD Professor of Physiotherapist of the Universidade Estadual do Oeste do Paraná (UNIOESTE) – Cascavel (PR), Brazil. 5PhD Professor in physiotherapy for the São Paulo State University “Júlio de Mesquita Filho” (FCT/UNESP) – Campus Presidente
Prudente (SP), Brazil.
ABSTRACT | This study aimed to evaluate the clinical trials’ ability in Q angle measurement and subtalar pronation to predict the pain and functional limitations alluded by individuals with Patellofemoral Pain Syndrome (PFPS). Thirty-one individuals with PFPS were recruited for this study. The Anterior Knee Pain Scale questionnaire was used to identify the functional limitations and the Visual Analogue Scale of pain was used to identify the pain experienced by these individuals in the last month. Two clinical trials were performed, measurement of Q angle and posture measurement of the subtalar pronation. The values of the tests were inserted into linear and multiple regression models to obtain the R2 and the coeicients of regression for non-continuous measures standardized with the signiicance level established at α = 0.05. Both tests when placed separately in linear regression models obtained low results for predicting pain and function. On the other hand, when inserted together in multiple regression models the tests explained 9% and 4% of the pain and of the functional limitations of individuals with
309
PFPS, respectively. Although the prediction of pain and functional limitations has improved when the tests were evaluated together, our indings show that both measures, Q angle and subtalar pronation, are not good predictors of pain and functional limitations of individuals with PFPS.
Keywords | Linear Models; Knee; Patella; Patellofemoral Pain Syndrome.
RESUMO | Este estudo teve como objetivo avaliar a capacidade dos testes clínicos de mensuração do ângulo Q e pronação subtalar em predizer a dor e as limitações funcionais referidas por indivíduos com Síndrome da Dor Femoropatelar (SDFP). Trinta e um indivíduos com SDFP foram recrutados para este estudo. O questionário Anterior Knee Pain Scale foi utilizado para identificar as limitações funcionais, e a Escala Visual Analógica de dor para a dor vivenciada por esses indivíduos referente ao último mês. Foram realizados dois testes clínicos estáticos, mensuração do ângulo Q e mensuração da postura da pronação
Mailing address: Fábio Mícolis de Azevedo Roberto – Rua: Roberto Simonsen, 305 – CEP 19060-900 – Presidente Prudente (SP), Brazil. E-mail: [email protected] – Phone: +55183229-5820
subtalar. Os valores dos testes foram inseridos em modelos de regressão linear e múltipla para a obtenção do R2 e dos coeficientes de regressão para medidas não contínuas padronizadas com o nível de significância estabelecido em
α=0,05. Ambos os testes, quando inseridos isoladamente em modelos de regressão lineares, obtiveram resultados baixos de predição de dor e função. Por outro lado, quando inseridos conjuntamente em modelos de regressão múltipla, os testes explicaram 9% e 4% da dor e das limitações funcionais de indivíduos com SDFP, respectivamente. Embora tenha sido observada melhora da predição da dor e limitação funcional quando os testes foram avaliados em conjunto, os achados deste estudo mostram que ambas as medidas – ângulo Q e pronação subtalar – não são bons preditores de dor e limitações funcionais de indivíduos com SDFP.
Descritores | Modelos Lineares; Joelho; Patela; Síndrome da Dor Femoropatelar.
RESUMEN | El objetivo de este estudio fue evaluar la capacidad de de las pruebas clínicas de medición del ángulo Q y pronación subtalar en predecir el dolor y las limitaciones funcionales mencionados por individuos con Síndrome de Dolor Femoropatelar (SDFP). Treinta y un individuos con SDFP fueron
reclutados para este estudio. El cuestionario Anterior Knee Pain
Scale fue utilizado para identiicar las limitaciones funcionales;
mientras la Escala Visual Analógica del dolor para identiicar el dolor experimentado por los individuos en el último mes. Se realizaron dos ensayos clínicos estadísticos, medición del ángulo Q y medición de la postura de la pronación subtalar. Los valores de las pruebas fueron insertados en modelos de regresión linear y múltiple para obtener el R2 y los coeicientes de regresión para medidas no continuas estandarizadas con el nivel de signiicancia establecido en α=0,05. Ambas pruebas cuando insertadas aisladamente en modelos de regresión lineares obtuvieron resultados bajos de predicción de dolor y función. Por otro lado, cuando insertados en modelos de regresión múltiple, los ensayos explicaron el 9% y 4% del dolor y de las limitaciones funcionales de individuos con SDFP, respectivamente. Aunque hubo mejora de la predicción del dolor y de la limitación funcional cuando las pruebas se evaluaron juntas, los resultados de este estudio muestran que ambas las medidas, el ángulo Q y la pronación subtalar, no son buenos predictores del dolor y de las limitaciones funcionales de individuos con SDFP.
Palabras clave | Modelos Lineales; Rodilla; Rótula; Síndrome de Dolor Patelofemoral.
INTRODUCTION
Patellofemoral pain syndrome (PFPS) has as a characteristic insidious pain in previous regions, peri or retropatellar. It is one of the main disorders that afect the knee, has a higher incidence in the female population and reaches approximately 13% of women aged between
18 and 35 years1. his painful condition is exacerbated
by functional gestures as climbing up and down a ladder, squatting and racing, which limits the participation of
those individuals in sports and daily life activities (DLAs)2.
Despite the high rates of incidence, the set of procedures to diagnose this dysfunction is not yet deined, because the literature about its etiological
factors has not reached a consensus3. Because of this,
investigations about biomechanical variables to identify speciic musculoskeletal habits in individuals with PFPS are often found, to assist in the characterization
of this disorder4–6participants performed a fatiguing
protocol in which they performed submaximal knee-extension contractions at 20% and 70% MVIC held to exhaustion. he MDF and RMS values from the EMG
signals were recorded from the vastus medialis (VM. A systematic review that investigated biomechanical factors associated with PFPS outlined 47 studies with good methodological quality and that evaluated a total
of 523 diferent biomechanical parameters6. However,
even with this arsenal of parameters investigating PFPS in a multifactorial form, there is great controversy about which parameters are changed in individuals with PFPS2,7.
In this context, the concern in the area consists in inding kinesiological static and/or dynamic changes that are related or can explain the pain and functional limitations
of individuals with PFPS8–10. For example, Nakagawa et
al. (2013) investigated through a kinemetry system how much three kinematic variables of hip and knee were able to predict the referred pain and functional limitations of those individuals. hey found 63% of prediction for
variation of pain and 44% for functional limitations8.
kinetic analysis systems as force platforms and isokinetic dynamometers are common in scientiic research, but rare in rehabilitation and diagnostic clinics. his fact reinforces the idea that clinical trials may be the most viable option and should be better exploited due to the ease of implementation and low cost. Due to the absence of a gold standard diagnostic tool, studies have used sets of clinical trials to compose their inclusion criteria and
classify individuals as PFPS or not11,3.
Clinical tests of static changes such as the measurement of the Q angle and the attitude of the subtalar pronation have been composing sets of tests that
classify individuals as PFPS2,12. However, there are gaps
in the literature about how these tests are able to explain the pain and functional limitations found in these individuals. Despite performing good interobserver
reproducibility and being widely reported13–15, these
clinical trials must show their ability to predict pain and function in PFPS. his type of approach can be directly related and transferred to the clinical practice, because the viability to continue using these tests depends on analysis as the one proposed by this study.
his study aimed to evaluate the clinical trials’ ability in Q angle measurement and subtalar pronation to predict the pain and functional limitations alluded by individuals with PFPS.
METHODOLOGY
Characterization of the sample
Sixty-four volunteers with knee pain were selected to participate in the study, however, 31 volunteers, identiied with PFPS, itted in the inclusion criteria. To be included in the study, the volunteers were subjected to a screening process recommended by high-quality
studies in the area of PFPS7,16.
Inclusion criteria were: (1) anterior knee pain during at least two of the following activities: remain seated for long periods, during sustained squatting or in repetitions, kneeling, during race and climbing up and down the stairs; (2) pain during palpation of the patella; (3) the symptoms with at least one month of insidious onset; (4) the average pain level of at least 3cm in the Visual Analogue Scale (VAS) in which 0cm means no pain and 10cm the maximum
level of pain in the previous month17; and (5) three or more
positive clinical signs in the following exams: Clarke’s sign, McConnell test, Noble’s compression test, Waldron’s test
and patella in medial or lateral position. Participants had to necessarily meet all ive requirements to be identiied with PFPS. As a non-inclusion criterion, any condition beyond the PFPS was considered, such as: events of patellar subluxation or dislocation, inlammatory process in any lower limb, osteoarthritis, patellar tendon injury or meniscus or the presence of neurological diseases. All the participants were assessed according to the inclusion and non-inclusion criteria by two physiotherapists, with ive years of experience in the evaluation of individuals with PFPS, who were only included in the study if these two physical therapists were in agreement with the criteria. he anthropometric data of the individuals are described in Table 1.
Design and Experimental Procedure
All participants were informed about the procedures to be performed, they signed a free and informed consent form according to the rules of the research ethics committee at the Universidade Estadual do Oeste do Paraná, approved under number 096/2013.
he Anterior Knee Pain Scale questionnaire (AKPS)
validated for the Brazilian population18 was applied
to evaluate the participants’ functional limitations. he AKPS is a quiz of 13 items that assess subjective symptoms and functional limitations associated with anterior knee pain. he questionnaire score ranges from 0 to 100 points, with a maximum total score of 100 indicating no functional limitation and below 82
indicating a tendency to patellofemoral disorders19.
After answering the questionnaire, the participants underwent two clinical trials, Q angle and subtalar pronation measurements.
he Q angle measurement was performed as follows: the individual was placed in supine position on a stretcher, with the feet perpendicular to the ground, then, with a dermographic pencil, the anatomical points were demarcated in the anterior superior iliac spine (ASIS), in the anterior tibial tuberosity (ATT) and also the superior, inferior, lateral and medial patellar and thus the patellar center edges were located. From this demarcation, two lines were drawn, the irst between the ASIS and the center of the patella and the second between the ATT and the patellar center. hen, using a universal goniometer
(CARCI®) the assessor noted the angle formed between
these two lines13. he test is considered positive when the
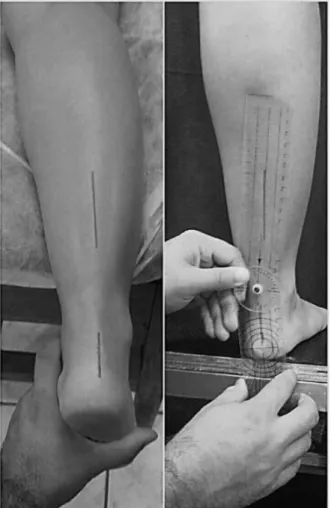
he subtalar pronation measurement (Figure 1) was carried out as follows: with the subtalar joint in neutral position, the individuals were placed in ventral position on a stretcher with the ankle and the calcaneus parallel to the ground. he subtalar joint neutral position was determined by palpation of the talus head on the medial and lateral edges of the talonavicular joint, and when the talus was not palpable or when it was felt to be equally prominent on both sides, the neutral position was considered. Next, the bisection of the leg was determined by palpation of its medial and lateral region, regardless of the direction of the calcaneal tendon. he middle longitudinal line of the posterior calcaneus was also estimated by palpation of its medial and lateral edges. Vertical lines were drawn with a ruler to assist the alignment of the goniometer. After this step, the participant was instructed to stand on a stool and the angle formed by these two lines represented the angle of
the subtalar joint14. he test is considered positive when
the angle is greater or equal to 8°20. he limb analyzed for
both tests was the one afected by PFPS, and in the case of bilateral pain the most symptomatic limb was assessed.
Figure 1. Clinical Test of static posture measurement of subtalar pronation
Statistical Analysis
he data were analyzed using the Statistical Package for the Social Sciences (SPSS v. 18.0, Inc. Chicago, Illinois, USA). Descriptive statistics was used to characterize the individuals and the Shapiro-Wilk test conirmed the normal distribution of the data. To check how the clinical trials are able to predict the referred pain and functional limitations of individuals with PSPF multiple linear regression-type, models of forced entry were executed. he associations within each multivariate model were considered signiicant if p≤0.05. he strength of the predictive capacity of clinical trials in each multivariate model was determined by regression coeicients for non-continuous standardized measures (B), with conidence intervals established in 95%. he overall performance of the inal models was assessed using
the R2 of Nagelskerke, which estimates the measure
variation explained by the model21. In addition, to
make sure the data were correctly adjusted to the model, regression diagnostics were made to assess the presence of outliers, collinearity and waste. For all the analyses it was considered a signiicance level of
α=0.05.
RESULTS
he average score in the AKPS and the average pain of the participants are reported in Table 1 with their respective standard deviations.
Table 1. Anthropometric data and characterization of participants
Characteristics Average Standard
Deviation
Age (years) 21.90 3.67
Mass (kg) 65.76 10.77
Height (m) 1.66 0.05
Pain * 5.32 1.37
AKPS (Final score) 72.64 9.22
Clinical trials Q Angle (°) 22.61 2.23
Clinical trial Subtalar Pronation (°) 8.42 2.24
The data of pain were obtained through the Visual Analogue Scale applied at the time of the inclusion criteria. The pain to which the data refer is the pain the participant lived through in the last month before data collection
identify the change in pain explained by the models. he best combination was obtained in the multiple regression model, which was able to explain 9% of the referred pain
by individuals with PFPS. No value of B was signiicant and the conidence intervals established at 95% were extensive ranging from negative to positive (Table 2).
Table 2. Multiple and linear regression model with the values found in the clinical trials of subtalar pronation and Q angle as predictors, and the values of pain as the dependent variable
Model Variables R2 F-ANOVA B – (95%CI) P-value (B)
1 Q Angle 0.067 2.089 0.16 (-0.066; 0.38) 0.159
2 Subtalar Pronation 0.01 0.027 0.01 (-0.21; 0.25) 0.872
3 Q Angle 0.09 1.406 0.20 (-0.47; 0.45) 0.678
Subtalar Pronation 0.10 (-0.14; 0.35) 0.396
Models 1 and 2 refer to linear regression, and model 3 to multiple regression. In model 3, three cases of collinearity were identiied and the individuals were discarded by the multiple regression test forced entry type. The p values for the three models were p>0.05
Tabela 3. Modelo de regressão linear e múltipla com os valores encontrados nos testes clínicos de pronação subtalar e ângulo Q como variáveis preditoras e os valores do AKPS como variável dependente
Model Variables R2 F-ANOVA B – (95%CI) P-value (B)
1 Q Angle 0.006 0.178 -0.32 (-1.88; 1.24) 0.676
2 Subtalar Pronation 0.001 0.007 0.06 (-1.49; 1.62) 0.934
3 Q Angle
0.04 1.093 -0.36 (-2.12; 1.40) 0.678
Subtalar Pronation -0.08 (-1.83; 1.66) 0.918
Models 1 and 2 refer to linear regression, and model 3 to multiple regression. The p values for the three models were p>0.05
he same method of regression analysis was used to quantify how much the clinical trials were able to explain the functional limitations detected via the AKPS questionnaire. Similarly, the best prediction value was
found in the multiple regression model, which was able to explain 4% of the functional limitations mentioned by the participants. As well as pain, no value of B was signiicant (Table 3).
he values of F-ANOVA found in tables 2 and 3, when the tests were inserted separately in the regression model, were lower than 1, except for the Q angle as a predictor of pain. he results of F-ANOVA in the multiple regression models were all greater than 1.
DISCUSSION
Clinical tests have been used to characterize individuals with PFPS, however, there is a lack of studies that report how the results of these tests can explain the pain experienced and the functional limitations in these individuals. It is already well established in the literature that the subtalar hyperpronation and excessive Q angle
are PFPS’ aspects22,23, due to this, this study investigated
the ability of two clinical tests, Q angle measurement and posture of the subtalar pronation, in predicting the referred pain by VAS and the functional limitations by AKPS.
Regarding the regression models, the authors were cautious not to commit the type II error, since it is
suggested that for each variable inserted in a model, a “n” sample of 15 individuals must also be inserted. Because two predictor variables were used, the sample of 31 individuals was enough not to compromise the
quality of the regression24. When inserted separately in
linear regression models, the tests showed weakness in explaining the pain mentioned by the individuals. For example, the clinical trial of subtalar pronation explained only 0.1% of the variation of the pain, which indicates that this change may exist on PFPS, as reported by recent
studies2,25, however, it shows little connection with the
source of these individuals’ pain. As reported by Aliberti
et al. (2012)26, who used a photogrammetry system to
When the regression was made based on functional limitations, the tests’ ability of prediction were lower than the values obtained with pain. Separately, the test of subtalar pronation explained 0.1% and the Q angle test 0.6% of the functional limitations of these individuals, which shows that these measures separately are even more fragile when related to function. he multiple regression was able, again, to improve the predictive capacity. Together, the variables explained 4% of the functional limitations. Freedman and Sheehan
(2013)9 indicated that static measuring instruments
may not be good predictors of dynamic functions, as the questions that appear in the AKPS refer to the dynamic conditions, our results reinforce the assertion of this study.
As the literature in the area of PFPS ofers several clinical tests used as inclusion criteria, the results of this study suggest not to use the subtalar pronation tests and Q angle because they are not good predictors of pain and functional limitations of individuals with PFPS.
he relationship between Q angle and PFPS is based on the theoretical model that the increased Q angle represents a source of excessive stress in the
patellofemoral joint27. his causes pain, providing
the PFPS symptoms27. In addition, there is evidence
suggesting that high Q angle values can lead to the
degeneration of the articular cartilage28. It should
be emphasized that this assumption is based on the presumption that the Q angle represents the angle formed by the application of quadriceps strength and the
direction of the patellar tendon29p<0.001. To confront
this concept, the indings of Freedman et al. (2014)30
can support the indings of the present study, since the authors compared three diferent ways of measuring the Q angle, during activities with no weight discharge by means of MRI, to determine whether the clinical test of Q angle truly represents the application’s line of quadriceps strength and analyze its relationship with patellofemoral kinematics. According to the authors’ hypothesis, the Q angle did not represent the line of action of the quadriceps and greater values of Q angle did not correlate with lateral patellar displacement. herefore, the authors suggested that the static clinical measurements of Q angle are not related to the PFPS.
However, these results question the classical assumption that increased patellofemoral stress is the result of the patella moving towards the femoral condyle. Although it seems to be a reasonable explanation, during activities that reduce weight, the contact
between the patella and the femoral condyle may result of an excessive rotation of the femur under the
patella31. hus, to analyze the Q angle during activities
that do not reduce weight (clinical test of the Q angle) can be a potential source of bias because the femur remains ixed throughout the measurement and as it is well established in the literature, the femoral rotation seems to be an important factor in the occurrence of an
abnormal Q angle31.
Regarding the indings of the foot posture, a possible explanation is that the theoretical model that underlies the relation between the subtalar hyperpronation and
individuals with PFPS32 is based on a dynamic condition.
It was proposed that the excessive range of motion of the subtalar pronation during the stance phase of the gait would result in excessive internal rotation of the tibia, that would delay or reduce the range of external rotation of the tibia towards the femur. his movement is essential to allow the extension of the knee during the stance phase, with this, as compensatory mechanism the femur would perform excessive internal rotation which would decrease the patellofemoral joint contact area and, therefore, increase the lateral compression and the stress in the joint and cause the development of the
PFPS32. Recently, in the study by De Oliveira Silva et
al. (2015)2, the authors evaluated individuals with PFPS
in dynamic and static conditions and found out that in the dynamic condition the majority of individuals presented excessive subtalar pronation, however, the same individuals showed no change in the clinical trial for the posture of the subtalar pronation.
Future studies that address the use of dynamic and functional tests for the characterization of these individuals are necessary, static test results have not been efective, contrary to the ones showed by the biomechanical parameters under functional conditions. Another issue that must be taken into consideration is the popularization of biomechanical tools in the clinical context, since they have shown better results. For example, a study of diagnostic accuracy was able to diagnose
PFPS by means of electromyographic measurements16.
he validation of low-cost electromyography can be an excellent alternative and would contribute to the characterization of PFPS in clinical reality.
can better predict PFPS. However, the authors have chosen to use the two classic tests often included in the characterization of individuals with PFPS.
CONCLUSION
he presented results show that the clinical tests of measurement of the Q angle and posture of subtalar pronation are not good predictors of pain and functional limitations mentioned by individuals with PFPS.
REFERENCES
1. Roush JR, Bay RC. Prevalence of anterior knee pain in 18-35 year-old females. Int J Sports Phys Ther. 2012;7(4):396-401. 2. De Oliveira Silva D, Briani RV, Pazzinatto MF, et al. Reliability
and diferentiation capability of dynamic and static kinematic measurements of rearfoot eversion in patellofemoral pain. Clin Biomech (Bristol, Avon). 2015;30(2):144-148. doi:10.1016/j. clinbiomech.2014.12.009.
3. Nunes GS, Stapait EL, Kirsten MH, de Noronha M, Santos GM. Clinical test for diagnosis of patellofemoral pain syndrome: Systematic review with meta-analysis. Phys Ther Sport. 2013;14(1):54-9. doi:10.1016/j.ptsp.2012.11.003.
4. Silva CR, Silva DO, Ferrari D, Negrão Filho RF, Alves N, Azevedo FM de. Exploratory study of electromyographic behavior of the vastus medialis and vastus lateralis at neuromuscular fatigue onset. Mot Rev Educ Física. 2014;20(2):213-220. doi:10.1590/S1980-65742014000200012.
5. Silva CR, Silva DO, Aragão FA, Ferrari D, Alves N, Azevedo FM. Inluence of neuromuscular fatigue on co-contraction between vastus medialis and vastus lateralis during isometric contractions. Kinesiol. 2014;46(2):179-185.
6. Lankhorst NE, Bierma-Zeinstra SM a, van Middelkoop M. Factors associated with patellofemoral pain syndrome: a systematic review. Br J Sports Med. 2013;47(4):193-206. doi:10.1136/bjsports-2011-090369.
7. Briani RV, De Oliveira Silva D, Pazzinatto MF, et al. Comparison of frequency and time domain electromyography parameters in women with patellofemoral pain. Clin Biomech. 2015;30(3):302-307. doi:10.1016/j.clinbiomech.2014.12.014. 8. Nakagawa TH, Serrão F V, Maciel CD, Powers CM. Hip
and knee kinematics are associated with pain and self-reported functional status in males and females with patellofemoral pain. Int J Sports Med. 2013;34(11):997-1002. doi:10.1055/s-0033-1334966.
9. Freedman BR, Sheehan FT. Predicting three-dimensional patellofemoral kinematics from static imaging-based alignment measures. J Orthop Res. 2013;31(3):441-7. doi:10.1002/jor.22246.
10. Collins NJ, Bierma-Zeinstra SMA, Crossley KM, van Linschoten RL, Vicenzino B, van Middelkoop M. Prognostic factors for patellofemoral pain: a multicentre observational
analysis. Br J Sports Med. 2013;47(4):227-33. doi:10.1136/ bjsports-2012-091696.
11. Cook C, Mabry L, Reiman MP, Hegedus EJ. Best tests/clinical indings for screening and diagnosis of patellofemoral pain syndrome: a systematic review. Physiotherapy. 2012;98(2):93-100.
12. Noehren B, Pohl MB, Sanchez Z, Cunningham T, Lattermann C. Proximal and distal kinematics in female runners with patellofemoral pain. Clin Biomech (Bristol, Avon). 2012;27(4):366-71. doi:10.1016/j.clinbiomech.2011.10.005. 13. Weiss L, DeForest B, Hammond K, Schilling B, Ferreira
L. Reliability of goniometry-based Q-angle. PM R. 2013;5(9):763-8.
14. Powers CM, Mafucci R, Hampton S. Rearfoot posture in subjects With patellofemoral pain. J Orthop Sport Phys Ther. 1995;22(4):155-60.
15. Witvrouw E, Callaghan MJ, Stefanik JJ, et al. Patellofemoral pain: consensus statement from the 3rd International Patellofemoral Pain Research Retreat held in Vancouver, September 2013. Br J Sports Med. 2014;48(6):411-4. doi:10.1136/bjsports-2014-093450.
16. Ferrari D, Kuriki HU, Silva CR, Alves N, Mícolis de Azevedo F. Diagnostic Accuracy of the Electromyography Parameters Associated With Anterior Knee Pain in the Diagnosis of Patellofemoral Pain Syndrome. Arch Phys Med Rehabil. 2014;95(8):1521-6. doi:10.1016/j.apmr.2014.03.028.
17. Crossley KM, Bennell KL, Cowan SM, Green S. Analysis of outcome measures for persons with patellofemoral pain: which are reliable and valid? Arch Phys Med Rehabil. 2004;85(5):815-22. doi:10.1016/S0003-9993(03)00613-0. 18. Cunha RA, Costa LOP, Hespanhol Junior LC, Pires RS, Kujala
UM, Lopes AD. Translation, cross-cultural adaptation, and clinimetric testing of instruments used to assess patients with patellofemoral pain syndrome in the Brazilian population. J Orthop Sports Phys Ther. 2013;43(5):332-9. doi:10.2519/ jospt.2013.4228.
19. Kujala UM, Jaakkola LH, Koskinen SK, Taimela S, Hurme M, Nelimarkka O. Scoring of patellofemoral disorders. Arthroscopy. 1993;9(2):159-63. Available at: http://www.ncbi. nlm.nih.gov/pubmed/8461073.
20. Oliveira VM, Detoni GC, Ferreira C, Portela BS, Queiroga MR, Tartaruga MP. Inluência do gradiente de inclinação na pronação subtalar em corrida submáxima. Acta Ortop Bras. 2013;21(3):163-6.
21. Harrell Jr FE, Lee KL, Mark DB. Multivariable prognostic models: Issues in developing models, evaluating assumptions and adequacy, and measuring and reducing errors. Stat Med. 1996;15(4):361-87.
22. Piazza L, Vidmar MF, Bortoluzzi LF, Pimentel GL, Santos GM. Avaliação isocinética , dor e funcionalidade de sujeitos com síndrome da dor patelofemoral. Fisioter e Pesqui. 2013;20(2):130-5.
23. Souza TR De, Zambelli R, Pinto DA, et al. Pronação excessiva e varismos de pé e perna : relação com o desenvolvimento de patologias músculo-esqueléticas – Revisão de Literatura. Fisioter Pesqui. 2011;18(1):92-8.
25. Neal BS, Griiths IB, Dowling GJ, et al. Foot posture as a risk factor for lower limb overuse injury: a systematic review and meta-analysis. J Foot Ankle Res. 2014;7(55). doi:10.1186/ s13047-014-0055-4.
26. Aliberti S, Costa MSX, João SMA, Pássaro A de C, Arnone AC, Sacco I de CN. Clinical rearfoot and knee static alignment measurements are not associated with patellofemoral pain syndrome. Fisioter e Pesqui. 2012;19(1):45-51.
27. Mizuno Y, Kumagai M, Mattessich SM, et al. Q-angle inluences tibiofemoral and patellofemoral kinematics. J Orthop Res. 2001;19(5):834-40. doi:10.1016/S0736-0266(01)00008-0. 28. Utting MR, Davies G, Newman JH. Is anterior knee pain a
predisposing factor to patellofemoral osteoarthritis? Knee. 2005;12(5):362-5. doi:10.1016/j.knee.2004.12.006.
29. Herrington L. Does the change in Q angle magnitude in unilateral stance difer when comparing asymptomatic individuals to those with patellofemoral pain? Phys Ther Sport. 2013;14(2):94-7.
30. Freedman BR, Brindle TJ, Sheehan FT. Re-evaluating the functional implications of the Q-angle and its relationship to in-vivo patellofemoral kinematics. Clin Biomech. 2014;29(10):1139-45. doi:10.1016/j.clinbiomech.2014.09.012. 31. Powers CM. The inluence of altered lower-extremity
kinematics on patellofemoral joint dysfunction: A theoretical perspective. J Orthop Sports Phys Ther. 2003;33(11):639-46. 32. Tiberio D. The efect of excessive subtalar joint pronation