1
A Work Project, presented as part of the requirements for the Award of a Masters Degree in Economics from the NOVA – School of Business and Economics
MENTAL HEALTH AND THE CRISIS: EVIDENCE FROM SHARE
Carla Adriana dos Santos Ferreira no.636
A Project carried out on the Economics course under the supervision of:
Prof. Pedro Pita Barros
2
MENTAL HEALTH AND THE CRISIS: EVIDENCE FROM THE
SHARE SURVEY
Abstract
Mental health constitutes a significant share of the global burden of disease. It is shaped
to a great extent by socioeconomic factors and is vulnerable to external shocks. The recent
financial crisis brought about stressors prone to trigger and aggravate mental illnesses.
This project presents a micro analysis of the effect of the economic crisis on mental health
in eleven European countries, through the estimation of individual health production
functions accounting for socioeconomic controls and macroeconomic indicators. We find
that mental health has deteriorated since 2007, even though the development of
depression episodes is unchanged. Additionally, his variation can be partially attributed
to economic recession and budgetary cuts in health spending.
Key words: Mental Health, crisis, health production function
Acknowledgements
The author would like to thank their advisor, Professor Pedro Pita Barros. Comments by
their peers are also appreciated.
3 1 – Introduction
Mental health is defined by the WHO as "a state of complete physical, mental and social
well-being, and not merely the absence of disease”. A healthy mind is essential for the well-functioning of a human being (Sen, 1992), and neuropsychiatric (mental) disorders
have been estimated to account for 12% of the global burden of disease (Lopez, et al.
2006), rendering mental health to be as important as physical health and equally worthy
of concern. While illnesses may have a strong endogenous biological and genetic
component, mental health is significantly influenced by exogenous forces, acting through
socioeconomic channels that shape it throughout the life course (Fryers, Melzer, Jenkins,
& Brugha, 2005; Lorant, et al. 2003).
In light of the recent financial crisis, there has been a growing concern regarding public
health outcomes (Karanikolos, et al., 2013), in particular the mental health of the
population. Not only has the crisis taken its toll on public spending on health and health
systems, it has also brought about stressors prone to trigger episodes of mental illness or
aggravate preexisting ones, such as increased unemployment rates, cuts on social support
and precarious life conditions, and deteriorating health, to name a few.
The concerns spawned a great deal of studies regarding public health and the crisis. The
following work will specifically analyze how mental health for the older groups of the
population of 11 European countries has been affected by the financial crisis of 2008. We
present an individual-level micro analysis through the estimation of mental health
production functions that take into account covariates for the socioeconomic status and
indicators influenced by the crisis. The first estimation concerns a measure for mental
health called Zung Self-Rating Depression Scale (Zung, 1965), while the second runs a
4
becoming clinically depressed. We then take the estimated variation in mental health
caused by the crisis and economic downturn against a potential scenario where economic
growth remained on its trend, resorting to the prediction of the output gap – the distance to the potential level of GDP – to yield the variation assumed to be caused by the crisis alone. We find that average mental health has deteriorated since 2007, while the
emergence of depression has remained unchanged. Moreover, the variation on mental
health score associated with crisis variables varies across countries and explains the
differences in scores.
Section 2 provides a short summary of the literature on the determinants of mental health,
and the impact of the crisis on health indicators. Section 3 describes the data and the
methodology employed, and explains the construction of the mental health indicator.
Section 4 shows the variation in mental scores across years and the results of the
regressions, and Section 5 concludes with a discussion of the results, some limitations to
the analysis and possible policy implications.
2 – Literature Review
Financial crises and public health are intertwined issues, as the former comprises
spending restructures and adverse consequences for health and healthcare that need to be
fully comprehended. The body of work done on determinants of mental illness and how
public mental health has been shaped by the recent crisis can be linked together through
the role of social disadvantage indicators (unemployment, income) and public social
support.
The literature focusing on the determinants of mental health and common mental
disorders (non-psychotic depression and anxiety), although mainly epidemiological and
5
of previous studies on the impact of socioeconomic factors such as education, housing,
income, and occupational status, only differ on the degree of impact and significance of
certain variables (Lehtinen, Sohlman, & Kovess-Masfety, 2005). The WHO has released
a report on social determinants of mental health which provides an extensive review of
results on this subject and is most useful on understanding the broader picture (World
Health Organization and Calouste Gulbenkian Foundation, 2014). Mental health is found
to be determined to a great extent by social, economic and physical influences, and its
distribution comes as a consequence of social inequalities. The formation of mental health
is a process that begins before birth and accumulates throughout the lifespan, meaning
that initial disadvantages are important factors at every point in time. The main findings
report a strong correlation of mental health state with social status, and a higher
vulnerability of those most disadvantaged and in the lower ranks of the distribution. The
prevalence of common mental disorders is perpetuated by unemployment and poverty,
although these indicators do not serve as good predictors for the onset of an episode
(Weich & Lewis, 1998).
While the report draws a picture of those more prone to poor mental health, there are
other factors at the individual level that influence mental health stock. A review of
European country-level studies shows that positive mental health scores are higher for
men, and those in the highest ranks of the income gradient with access to social support,
significantly decreasing with age and adverse conditions such as poor housing or death
of a spouse (Lehtinen, Sohlman, & Kovess-Masfety, 2005). Educational attainment,
described as important factor in health formation (Kenkel, 1995), appears as a good
predictor of mental health state and may serve as a proxy for socioeconomic status
6
also a commonly used explanatory variable for the distribution of poor mental health, but
the descriptive nature of the data may be subject to biases as the social status seems to
lose its impact when controlling for other factors (Araya, Lewis, Rojas, & Fritsch, 2003).
Another indicator found to lose its impact is low social support - when referring to older
adults, its role is overtaken by physical health condition in explaining the onset of
depression (Kennedy, Kelman, & Thomas, 1990), which could mean that the impact of
social support on the elderly population may be channeled into mental health formation
through medical assistance.
As for the crisis, studies have come around to assess the health consequences, whether in
terms of policies and health systems changes or public health indicators. The trend for
Europe has impaired GDP growth and rising unemployment, but the growth of health
expenditures is not homogeneous across countries. While some increased their spending
to protect the health systems, others were forced to cut expenses. In what concerns public
health, emergence of economic downturns has been associated with an increase in
suicides, although with no evident impact on overall mortality (Baumbach & Gulis,
2014). At the country level, an example shows increased demand for mental and
addiction-related consultations has been verified in Spain (Gili, Roca, Basu, McKee, &
Stuckler, 2012), a country particularly affected by the crisis in the years following 2008.
There is therefore solid evidence for increased demand of mental health services in crisis
years, on the form of decreasing condition.
The key finding relating the work on mental health and its determinants, and the
assessments of the financial crises, is the role of social support. Both strands of literature
find that countries with higher levels of social spending and overall support present the
7
mitigate the impact of the increase in unemployment on suicide rates (Stuckler, Basu,
Suhrcke, Coutts, & Mckee, 2009). There is an obvious bridge between the two subjects:
the importance of social spending can be related to the role of socioeconomic indicators
in determining the incidence of mental illness, suggesting a channel through which the
crisis affects the population. This implies that the consequences for mental health will not
be uniform for every country and may vary according to the public policies.
3 – Data / Methodology
To work out the impact of the crisis in the mental health of the population, we turn to a
micro-level analysis instead of a macro one. We take individual responses across eleven
European countries as our output variable to build up micro health indicators, instead of
aggregate indicators, and will assess the changes in mental health through the estimation
of health production functions that account for socioeconomic influences as well and
exogenous macroeconomic variables. The aim is to attain a clear analysis, controlling for
social and personal influences, of whether mental health has deteriorated due to the crisis
or as a result of other conditions. In addition, provided that economic variables pose a
direct influence to individual mental health, we can estimate the variation in mental health
caused by the crisis alone when comparing to a scenario with no crisis, i.e. pre-crisis
forecasts, thus having the assumed true variation by country in mental health attributed
to the crisis.
For the assessment of mental health in Europe throughout the crisis, the data is be
withdrawn from the Survey of Health, Ageing and Retirement in Europe (SHARE), a
multidisciplinary cross-national European panel database of micro-data on health and
8
The motivation behind this choice is lies on the fact that the oldest groups of the
population, akin to those in the lowest socioeconomic ranks, are more prone to mental
illness. Not only does age have a negative effect on mental health, this effect is enhanced
as the individuals grow older since old age encompasses a faster deteriorating health, as
well as more precarious living conditions (e.g. decreased income, abandonment).
Moreover, these same conditions also make the older population more vulnerable to the
consequences of economic recession, as this segment will more likely rely on social
support for subsistence. Therefore, this analysis will focus on a more exposed part of the
European population and how their mental health has been affected by the crisis years.
The estimated panel model will contain data from three years corresponding to three
waves from the SHARE: 2007, 2011 and 2013. The first year captures the environment
before the onset of the 2008 crisis, while the two post-crisis years capture the changes in
our desired variables. We use two distinct years after 2008 to try to understand if, given
a decrease, we can already see an improvement in mental health in 2013. We expect to
observe a decrease in 2011, followed by a slight improvement on 2013 as some economies
begin to pick themselves up in terms of growth – an improvement, however, not expected to compensate the previous deterioration.
The withdrawn sample consists of eleven European countries: Austria, Germany,
Sweden, the Netherlands, Spain, Italy, France, Denmark, Switzerland, Belgium and the
Czech Republic. These are the countries for which the SHARE provides information for
the same individuals in the three aforementioned years. They do, however, constitute a
representative sample of Europe as a whole – Austria, Germany, the Netherlands, Switzerland and Belgium represent Central Europe; Sweden and Denmark represent
9
particularly affected by the crisis, with the Czech Republic, however, standing alone
representing Eastern Europe.
3.1 – Mental Health Indicator
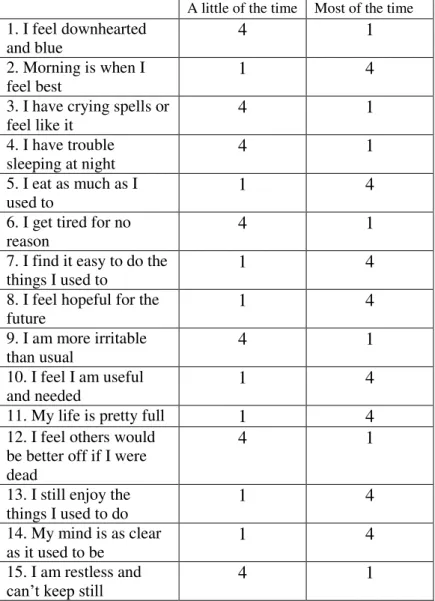
The mental health indicator is the Zung Self-Rating Depression scale (Zung, 1965). It
uses a set of twenty questions to build a score ranging from 20 to 80 that assesses
individual mental health in terms of depression. In other words, mental health can be seen
as a spectrum and the Zung Scale provides a feasible position within this spectrum
(Dungan, et al., 1998). Most depressed individuals score between 50 and 69, hence
positive mental health decreases with the score. This score does more than just diagnose
individuals with depression, it creates a gradient that allows distinction between mild and
severe illness. Not only does it show the incidence of depression, it also allows for a test
of difference in means between the desired periods, as episodes of depression may have
stayed constant but mental health as a whole may have deteriorated. The challenge here
is to match questions from the SHARE dataset regarding mental health to the subjective
questions of the indicator (Table 1 of the appendix). Due to lack of available data, five
questions were dropped from the score1 which will range from 15 to 60 in this study,
making the depression threshold stand now at 37,5. The direction of the score was also
inverted so that positive mental health increases with the score, for a faster interpretation
of the results (depression is then diagnosed for scores below 37,5).
4 – Results
The mental health indicator was constructed based on individual responses to the 15
questions of the survey. From our sample comprising 11 European countries we can both
1 As shown in the GHQ-12 and MHI-5 comparison (Hoeymans, A., Westert, & Verhaak, 2004), it is viable
10
take each country’s and the overall European mean score. The distribution of means is
presented in Graph 1, where country-level scores by year are show against the overall
average of the same period. Each point in the plot represents the country’s mean score and confidence interval, and the horizontal lines mark the average score for all 11
countries. Average mental condition has decreased over the three periods, with
statistically significant differences both at the aggregate and country-level (Tables 2,
Tables 2a) – k) of the appendix). While the relative position of each nation does not change significantly, all of them show a decreasing trend. The most affected regions,
Southern (Spain, Italy and France) and Eastern European (Czech Republic) remain below
average, which is coincidental with their exposure to the consequences of the crisis. Other
countries, while remaining above, have shifted their relative positions, with Denmark and
11
In terms of number of depression cases (those scoring below 37,5), the results comply:
the percentage of depressed elder individuals in Europe significantly increased by two
percentage points in the years after the crisis. However, this is not true for all the countries
in the sample, as we observe no significant differences in 5 out of 11 nations. The fact is
that, while mental health as a whole has deteriorated after the onset of the crisis, the
incidence of clinical depression does not appear to have uniformly changed. As
mentioned before, it is likely that mental health does not change uniformly across Europe
due to country differences.
But these numbers cannot be taken alone. The above discussion of mental health literature
points out age and social position as important determinants of mental state, as well as
physical condition (overall condition and the presence of long-term illness). Moreover,
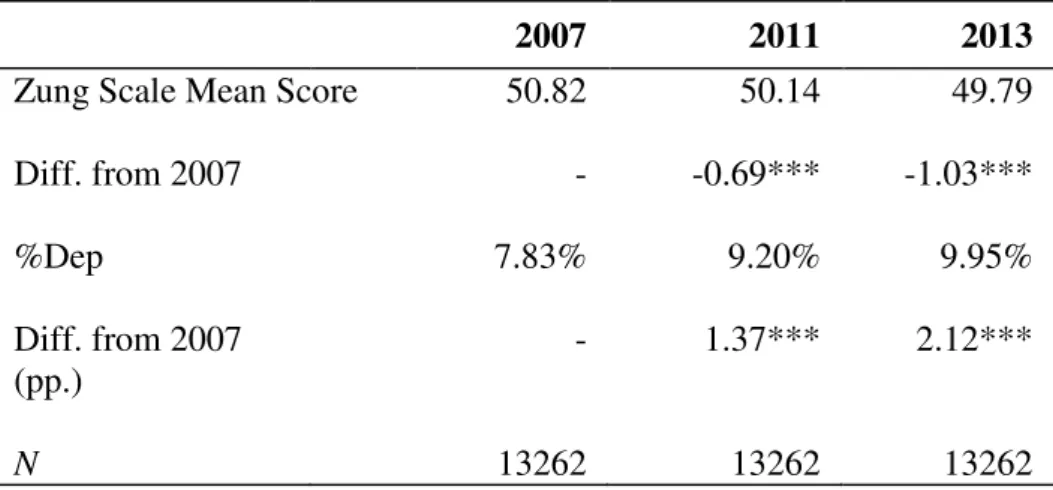
Table 2 – Differences in mean scores and proportion of depressed respondents since 2007
2007 2011 2013
Zung Scale Mean Score 50.82 50.14 49.79
Diff. from 2007 - -0.69*** -1.03***
%Dep 7.83% 9.20% 9.95%
Diff. from 2007 (pp.)
- 1.37*** 2.12***
N 13262 13262 13262
* p<0.10; ** p<0.05; *** p<0.01
our sample was withdrawn from the SHARE survey, meaning that we are analyzing
respondents over 50 years old – not only does health production deteriorate with age, the depreciation increases with time. Hence, this decrease in mental health condition can be
12
To account for all that, we first carry out an estimation of a health production function
that uses the Zung Scale indicator as the output variable to measure mental health. That
will tell us what factors had influence in this observed decrease, and whether we can relate
it to the onset of the crisis. Secondly, we use a probit panel regression to understand which
variables explain the emergence of depression cases, i.e. what causes an individual from
our sample to become (clinically) depressed. It may be important to distinguish the two
analysis because the decrease of the average mental health state may not imply an overall
increase of the clinical depression cases in some countries.
To perform this, a list of covariates is described below. For a quick consultation, a table
is available in the appendix (Table 3).
Age: the literature is quite strong on asserting the negative impact of ageing on
positive mental health (Lorant, et al., 2003), not only by common mental illnesses
but by increased prevalence of neurodegenerative disorders. Mental health
deteriorates with age as stressors accumulate throughout the lifespan, and through
the degeneration of cognitive abilities. But it may not be appropriate to assume the
relationship is linear – the deterioration (depreciation rate) of overall health is not a constant parameter as it increases with age, hence the assumption that the
contribution of age alone for mental health is uneven is a strong hypothesis to be
tested. Here, we will test the hypothesis of a quadratic relationship.
Education: education as an explanatory variable for mental health can be seen
through two different angles. Firstly, one can use educational level as a proxy for
individual socioeconomic status (Fryers, et al. 2005). Since mental health depends
on social position and inequality, with the higher ranks being the healthiest, it will
13
in the health production function for health formation models (Kenkel, 1995), since
it is assumed that highly educated individuals with know how to produce health more
efficiently with the available resources and have a higher initial stock of health ex
ante. From what could be collected from the database, we establish dummies for both
primary and secondary level of education. Education is here taken separately since
different levels may have different increments in the production function.
Gender: It has been medically documented that women are twice more likely than
man to develop mental illness (Bird & Rieker, 1999). Biologically, this is attributed
to genetic predisposition and differences in brain chemistry between the sexes,
causing women to be exposed to higher hormonal fluctuations strongly associated
with depression. Some other explanations do suggest that differences in prevalence
of mental illness between sexes are a consequence of reporting bias – an explanation that has been debunked. Gender here is taken to be equal to 1 if the respondent is
male.
Income: akin to education, income comes in here as a measure of socioeconomic
status. Like previous research has shown, there is an income gradient in the
distribution and prevalence of mental illness, therefore making it an important
variable in assessing mental health state. This variable may also capture changes in
income as a consequence of the crisis, and this must be taken into account in a further
interpretation of the results. Income is taken in a logarithmic scale for this estimation
for an easier interpretation, and all currencies are converted to euros.
Long Term Illness: like previously stated, physical conditions gave an important role
in explaining poor mental health. With a dummy variable that captures the presence
14
have an impact on mental health. This is a dummy equal to 1 if the respondent reports
a long-term illness.
Medical Service Consumption (nr. consultations): this variable will capture every
other condition not included in the question regarding long term illnesses, as the poor
mental state can also arise from recent medical conditions. It also captures the
respondent’s utilization of medical services.
Activity: daily exercise is advocated as a fairly good treatment against depressive
symptoms. A systematic review found exercise to be slightly more effective than
prescribed medication on improving depression outcome (Cooney, et al., 2013). This
may be due to the release of endorphins (feel-good brain chemicals) during physical
activity, and through improvements in the immune system. The results, however, are
somewhat weak as some are based on a small number of studies. Ciucurel and
Iconaru (2012) further find a strong association between sedentarism in the elderly
population and the development of depression. It is important to include an indicator
which measures how active an individual remains, as it will influence depression and
its onset. This variable is qualitative, and dummies are generated for the frequency
of physical acitivy.
Occupational Status: three dummies regarding occupation status are included, for
whether the respondent is unemployed, retired or on disability leave. Adverse life
conditions can manifest on employment status, hence it is important to distinguish
how the respondent left the workforce. Occupation can be a significant influence in
mental condition, as well as a consequence of the crisis, hence this variables can be
15
Alongside with the controls, the crisis impact on mental health is assessed through the
inclusion of two year dummies for 2011 and 2013 controlling for the years in our data
following 2008. If, by holding all else constant, the coefficients associated with the year
controls are negative and significant, part of the mental health (negative) variation can
then be attributed to the passing of those years alone – the years of crisis.
In addition to these, real GDP growth and unemployment rates for 2007, 2011 and 2013
are employed in the first regressions to account for the economic environment of each
period. These are macroeconomic variables easily perceived by the population in general
and may be viable when included in the regressions, serving also as a way of
understanding which forces of the economic environment are felt at the individual level.
The next analysis, however, will be managed through additional regressions employing
GDP output gap estimations (source: OECD). The output gap measures the deviation of
GDP from its trend – how much the indicator deviated from its potential level. In a scenario of economic downturn, as it was the onset of the 2008 crisis, GDP falls in
comparison with the potential trend and output gap estimations are negative. Using this
sort of variables makes it easier for generating a “counterfactual”; the output gap measures a deviation relatively to a potential level that serves as a “control group” not exposed to the crisis. If economic fluctuations are powerful enough to be felt in the mental
health production function at the individual, the macro variables should yield significant
coefficients, albeit going in different directions in each of our regressions: if, for instance,
economic growth has a positive impact on mental health, the coefficient should be
positive in the fixed-effects (positive increment in the Zung scale) and negative in the
16
The first function is attained by a fixed effects estimation separated by sex to account for
gender differences. The second part uses a probit panel estimation, both with and without
country dummies variables (Austria is omitted). The results are presented in Tables 4 &
5, respectively2.
Table 4 presents six fixed effects regression for the sample of eleven countries, either
pooled or separated by gender. The nonlinear relationship of age is disentangled through
the inclusion of the square of age, otherwise it would not be significant in this estimation.
Surprisingly enough, we see that age has a positive impact on individual mental health,
although this influence is mitigated as the subject grows older. A possible explanation is
the existence of two forces in ageing, the first acting towards improving (mental) health
(Van Landeghem, 2008) and the second acting through an increasing health depreciation
rate (Grossman, 2000). Another explanation comes from the fact that the sample itself
only captures the population over 50 years old. Following the age-dependent happiness
curve assumption by Van Landeghem (2008), it may happen that we are looking at the
lower end of the function and therefore only capturing post-middle age effects.
Regarding socioeconomic factors, the results are not conclusive. Education is not
significant in any specification, presenting a contradictory negative coefficient for the
female sample. The variable may not have any conclusive influence for two reasons: first,
the data only allowed distinction between primary/basic and secondary education, and
remained undistinguishable for any other schooling level; second, it is possible that the
impact of this variable is mitigated as one grows old and health deteriorates as a
consequence of old age and its problems. The same result goes for the income level
2 The regressions are not separated by country due to the inclusion of individual-invariant macroeconomic
17
Table 4 – Fixed-effect regression at individual level
Dependent variable
Zung Scale Zung Scale (Women)
Zung Scale (Men)
Zung Scale Zungscale (Women)
Zungscale (Men)
Age 1.263 1.367 1.060 1.258 1.354 1.061
(8.30)*** (7.43)*** (3.01)*** (8.28)*** (7.37)*** (3.01)***
Age^2 -0.008 -0.009 -0.007 -0.008 -0.009 -0.007
(13.35)*** (10.55)*** (8.06)*** (13.33)*** (10.46)*** (8.10)***
Educ1 0.129 -0.733 1.244 0.207 -0.647 1.336
(0.16) (0.67) (1.08) (0.26) (0.59) (1.16)
Educ2 0.301 -0.163 0.826 0.412 -0.066 0.953
(0.58) (0.23) (1.12) (0.79) (0.09) (1.29)
L. Term Illness -1.474 -1.540 -1.389 -1.478 -1.549 -1.391
(17.21)*** (12.88)*** (11.50)*** (17.26)*** (12.95)*** (11.52)***
LogIncome 0.002 -0.018 0.024 0.001 -0.018 0.024
(0.15) (1.03) (1.40) (0.11) (1.04) (1.37)
Actv – Rare 0.707 0.826 0.578 0.711 0.833 0.579
(5.44)*** (4.55)*** (3.15)*** (5.47)*** (4.58)*** (3.16)***
Act – Occas. 0.846 0.854 0.843 0.857 0.866 0.849
(7.56)*** (5.57)*** (5.20)*** (7.67)*** (5.65)*** (5.24)***
Act – Freq 0.886 0.721 1.077 0.903 0.741 1.089
(9.14)*** (5.33)*** (7.86)*** (9.33)*** (5.48)*** (7.95)***
Nr. Consult. -0.059 -0.057 -0.061 -0.058 -0.057 -0.061
(13.51)*** (9.97)*** (9.23)*** (13.47)*** (9.93)*** (9.23)***
Unemployed -1.145 -1.489 -0.705 -1.137 -1.483 -0.692
(4.09)*** (3.80)*** (1.79)* (4.06)*** (3.79)*** (1.76)*
Retired 0.332 0.091 0.630 0.344 0.124 0.627
(2.48)** (0.49) (3.30)*** (2.57)** (0.66) (3.28)***
Disabled -1.018 -1.211 -0.780 -1.007 -1.181 -0.778
(3.64)*** (3.14)*** (1.94)* (3.60)*** (3.06)*** (1.93)*
2011 year -0.910 -1.023 -0.595 -0.726 -0.931 -0.278
(1.85)* (1.84)* (0.46) (1.44) (1.62) (0.21)
2013 year -1.130 -0.992 -1.055 -0.971 -1.034 -0.607
(1.53) (1.19) (0.54) (1.29) (1.20) (0.31)
GDP growth 0.160 0.226 0.070 - - -
(4.03)*** (4.15)*** (1.22)
Unmp. Rate -0.025 -0.016 -0.037 - - -
(1.80)* (0.82) (1.93)*
Output Gap - - - 0.094 0.092 0.098
(4.04)*** (2.83)*** (2.98)***
Constant 4.553 -0.099 14.408 4.637 0.540 14.002
(0.54) (0.01) (0.67) (0.55) (0.06) (0.65)
R2 0.05 0.04 0.05 0.05 0.04 0.05
N 39,499 22,483 17,016 39,499 22,483 17,016
18
variable, with non-significant coefficients. But bearing in mind this sample comprises
very distinct countries with different economies, it is possible however for this to be a
result of different purchasing powers that complicate the inference of an income gradient.
These results may highlight the importance of physical health in the development of
mental illness in old age, as socioeconomic background loses its power in explaining
mental health distribution.
On that same page of physical health, the frequency of physical activity, a long term
illness and the number of doctor consultations within a month all present the expected
sign for the coefficients, supporting the inferences made above. As for occupational
status, unemployment and disability leaves are predictors of bad mental condition but,
surprisingly, retirement poses a highly positive influence. This may create two opposite
forces in the formation of elderly mental health – while the increasingly poor physical condition drives it down, the ability to quit the labor force at that time is a strong positive
influence. Once again, the role of social support is reinforced – the ability to retire comfortably can be of great importance to mitigate the adversities of poor health.
In terms of the crisis, the results indicate a somewhat significant negative impact of its
onset on mental health in Europe. Although not overall significant, the dummies for 2011
and 2013 indicate a decrease in average mental health following 2008. Gender differences
can additionally be noted, as the dummies are more significant for the female population
and with a more negative impact on mental health. Holding all other covariates constant,
we can infer that the climate of crisis alone taken by the year dummies has contributed to
worsen mental health outcomes in Europe. Adding to this, the significance of real GDP
19
well, while unemployment is only significant for the male one. A strong hypothesis
cannot be presented to support this finding, but it can be inferred that men may tend to be
more concerned about labor market conditions than women, while the female population
may remain more aware of economic growth. However, much like other determinants of
mental health, this inferences may be quite subjective and vary according to the chosen
sample. Nevertheless, the signs are compliant with the previous assumption, as we
observe mental health improving with economic growth and worsening with increasing
unemployment.
The last three regressions vary very little in terms of results, except for the year dummies.
The presence of the output gap drains the significance of the years of the crisis, possibly
because the former will be expected to comprise more information about the economic
scenario. No other macroeconomic variables were included due to collinearity issues.
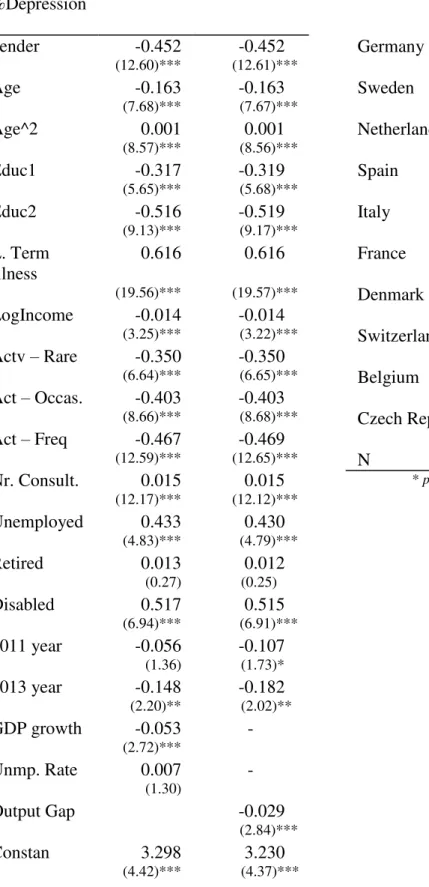
The results for the probits on Table 4 need a slightly different interpretation. The output
variable is a dummy equal to 1 if the respondent presents depression, i.e. scores below
37,5. Hence, this shows a binary outcome estimation for the probability an individual has
of developing depression, instead of the impact of each variable on the individual position
across the mental health spectrum.
In this model, all covariates have the predicted signs and are statistically significant.
Gender differences are evident and strongly significant, as women show a higher
predisposition for the development of depression. The probability of the onset of a
depression episode decreases with age, but at a decreasing rate – the nonlinear relationship is again employed in the probit – and by quitting the labor force by unemployment or disability leave. Education and income decrease the probability of an
20
Table 5 –Panel probit regressions for the onset of depression
* p<0.1; ** p<0.05; *** p<0.01 Output:
%Depression
gender -0.441 -0.452 -0.437 -0.452
(12.38)*** (12.60)*** (12.20)*** (12.61)***
Age -0.163 -0.163 -0.164 -0.163
(7.70)*** (7.68)*** (7.75)*** (7.67)***
Age^2 0.001 0.001 0.001 0.001
(8.54)*** (8.57)*** (8.58)*** (8.56)***
Educ1 -0.498 -0.317 -0.525 -0.319
(9.18)*** (5.65)*** (9.66)*** (5.68)***
Educ2 -0.553 -0.516 -0.581 -0.519
(10.13)*** (9.13)*** (10.61)*** (9.17)***
L. Term Illness 0.579 0.616 0.574 0.616
(18.65)*** (19.56)*** (18.50)*** (19.57)***
LogIncome -0.026 -0.014 -0.028 -0.014
(6.13)*** (3.25)*** (6.63)*** (3.22)***
Actv – Rare -0.338 -0.350 -0.351 -0.350
(6.46)*** (6.64)*** (6.70)*** (6.65)***
Act – Occas. -0.436 -0.403 -0.454 -0.403
(9.45)*** (8.66)*** (9.84)*** (8.68)***
Act – Freq -0.523 -0.467 -0.546 -0.469
(14.26)*** (12.59)*** (14.89)*** (12.65)***
Nr. Consult. 0.017 0.015 0.017 0.015
(14.13)*** (12.17)*** (14.22)*** (12.12)***
Unemployed 0.466 0.433 0.475 0.430
(5.20)*** (4.83)*** (5.29)*** (4.79)***
Retired 0.108 0.013 0.114 0.012
(2.29)** (0.27) (2.42)** (0.25)
Disabled 0.514 0.517 0.518 0.515
(6.96)*** (6.94)*** (7.00)*** (6.91)***
2011 year -0.206 -0.056 -0.356 -0.107
(5.57)*** (1.36) (7.22)*** (1.73)*
2013 year -0.437 -0.148 -0.571 -0.182
(7.88)*** (2.20)** (8.29)*** (2.02)**
GDP growth -0.124 -0.053 - -
(8.36)*** (2.72)***
Unmp. Rate 0.024 0.007 - -
(7.15)*** (1.30)
Output Gap - - -0.079 -0.029
(10.53)*** (2.84)***
Country Controls No Yes No Yes
Constant 4.056 3.514 4.238 3.450
(5.53)*** (4.71)*** (5.78)*** (4.67)***
21
that in this case the incidence of depression is mediated by a social gradient in our sample,
like shown in the literature. Physical activity and condition indicators also behave as
predicted. The differences come from the inclusion of country controls. As mentioned
before, depression distribution is not uniform across countries – it is easy to see on Tables 2 a) – k) that even the initial proportion of depressed respondents differs greatly, and the same goes for the consequent variation following the crisis. With that and the role of
public spending, it would be likely for the evolution of mental health to differ significantly
between European countries. From one model to the other, the significance of the
crisis-related variables disappears when the country dummies are introduced. While GDP and
unemployment presented strong predictors of depression onset, their role is mitigated
when controlling for the country – GDP has a lower impact and unemployment loses significance – which points towards the importance of each country’s individual role concerning public mental health. The most surprising finding, though, is the estimated
impact for the year dummies which turn out to decrease probability of depression in the
first estimation, although not significantly for 2011 in the second regression, suggesting
an improvement already on course (the full regression is presented in Table 4a) of the
appendix). The output gap regressions vary little, just like in the fixed-effects models, but
as expected has a good contribution on preventing the onset of depression.
From this first stage analysis, the conclusion are mostly in accordance with the previously
raised points. Mental health depends on endogenous socioeconomic cofactors as well as
physical ones, but is also shaped by external forces, both social and economic. However,
while the average mental level of the population has decreased in the past six years, the
actual number of depression cases in this sample varies according to country and is mostly
22
does not necessarily imply onset of depression. Mental health can be regarded as a
spectrum, and moving across the range of the indicator does not translate into a developed
illness. This is presumably one of the main reasons behind the uneven trends on
depression within countries.
The question may now be how much has each country’s average score changed as a result
of the downturn. This variation in mental health score is taken to be the value of the
estimated coefficients for the year dummies plus the coefficient associated to the variation
in the designated macro variable. However, had we chosen to measure GDP level or
growth by itself, we would have had to account for both the observed value in the crisis
setting and the previously forecasted value or the expected trend, to consequently subtract
those values and derive the effect truly generated by the crisis. Using notation from policy
analysis, the idea would have been to subtract the average value of the “control group” –
a potential economy with no crisis – to that of the “treatment group”– economy under crisis. Obviously, the designations are loosely employed here as there is no control or
direct counterfactual to the European economic situation, but resorting to GDP forecasts
is a potential way to tackle this issue. Nevertheless, we chose to employ the output gap
into our regression analysis as an easier approach to the issue. The output gap measures
the deviation of GDP from its potential level as a percentage of the latter. In other words,
it is in itself a measure of the difference between the observed and the counterfactual
value for GDP in each country. In the years following the crisis, the output gap is
predicted to be negative as recession drives GDP down; moreover, our estimated
coefficients are positive, hence negative output gap drives mental health further down.
The increment on mental health in each year will be given by:
23
The results by country are depicted in Graph 2. The gray bars are the increment in 2011,
and the upper white bars correspond to 2013. The entire bars represent the whole variation
in the Zung Scale score in 2013.
We can see that the (negative) variation attributed to 2013 is indeed much higher than the
variation in 2011 alone. This is attributable to both the higher coefficients and the more
negative GDP levels, as some countries remained in recession. Unfortunately, this implies
that mental health in Europe is not yet experiencing an improvement possibly because the
end of the crisis has only just begun. By the graph, the most affected countries are
unsurprisingly Spain, Italy and France, the proxy group for the South of Europe. The least
affected are those in Central Europe, followed by the North (despite Denmark having a
larger variation than France).
This differences in average variation in the Zung score are a consequence of differences
24
been mentioned in the probit estimations, where the importance of the country controls
had been highlighted. The aforementioned literature has also been keen on emphasizing
the role of social support in the prevention of mental illness, especially in the most
vulnerable segments of the population. Our sample specifically aims the population over
50 years old, which immediately indicates a strong dependence on social support systems.
As our analysis focuses on health, public health care spending is a fair proxy for support
in terms of health care. Truth is, health care expenditure has decreased relatively to GDP
since 2009 – the first measure was to increase health spending, but austerity-mediated budget cuts promptly decelerated its growth (Tables 5 a) – c) of the appendix, source OECD). Southern European countries displays the lowest shares, with Spain on the
bottom – consistent with its position in Graph 2. However, after 2011 this percentage began to grow again which would have been compatible with our previous expectations
of improved health outcomes in 2013. This leaves the hypothesis that improving mental
is more difficult after triggering a stressor and requires more time than expected.
5 – Discussion / Conclusion
This project focuses on mental health issues in Europe as a consequence of the financial
crisis and builds a regression analysis upon an individual mental health indicator. The
results, although small in magnitude, reveal a negative effect on mental condition strongly
associated with the years of economic downturn. The countries with higher budget cuts
are estimated to display lower average mental health scores, reinforcing the role of the
public health systems in answering to public health concerns, Furthermore, the results do
not differ much from the literature on determinants of mental health, but one should bear
in mind that the estimations were based on a very specific group of the population.
25
limitation comes from the collected data. The SHARE is a database designed to study
ageing and socioeconomic features of the elder population in Europe and only provides
data for respondents over 50 years of age. Even though it could make more sense to study
the most vulnerable groups, this sample is not taken to be representative of the population.
Our assumption here is that a significant part of the effect of the crisis is felt through the
cuts on public spending – but this may not be true when studying a younger, less dependable sample. Moreover, even though controls for physical condition were
included, it is important to note that this is a sample with presumable poor physical health,
a strong influence on overall mental outcomes. This must be taken into consideration for
policy implications in terms of health care spending.
Inserting macroeconomic indicators into micro-level functions may pose an additional
problem. It is possible that the relationship with individual mental health is not as strong
as estimated, since the assumption that variables such as GDP growth and unemployment
rate have a direct relevant effect at the micro level is a strong one. Further research should
be conducted in order to establish strong proxies for macro variables that directly
influence individual outcomes.
Nevertheless, the policy implications are straightforward in this matter. There is a strong
need to protect the vulnerable population in times of crisis – mental health is just one of the many aspects to be addressed. While the deterioration is not alarming, we expect to
raise awareness for the vulnerability of mental health in periods of economic stress, and
for the possible channels of action. Not only does the crisis triggers potential stressors, it
generates unstable living conditions. The designed approach should comprise both
medical assistance for mental health, as well as a stronger concern for the lower
26
Still, it should be noted that these results apply to overall individual mental health as a
relative position in a spectrum. Assessing the development of clinical depression requires
a both more thorough and more medicine-oriented approach, with a stronger biological
and biochemical background. Nevertheless, the WHO statement clearly indicates that one
should not aim solely at mental illness and overlook poor mental health by itself, hence it
is crucial to control for these crisis related variations.
References
Araya, R., Lewis, G., Rojas, G., & Fritsch, R. (2003). Education and Income: which is more important for mental health? Journal of Epidemiology & Community Health(57), 501-505.
Baumbach, A., & Gulis, G. (2014). Impact of Financial Crisis on Selected Health Outcomes in Europe. European Journal of Public Health, 24(3), 399-403.
Bird, C., & Rieker, P. (1999). Gender Matters: an integrated model for understanding men's and women's health. Social Science and Medicine, 48, 745-755.
Cooney, G., Dwan, K., Greig, C., L. D., Rimer, J., Waugh, F., . . . G., M. (2013). Exercise for depression. Cochrane Database of Systematic Reviews, 9.
Dungan, W., McDonald, M., Passik, S., Rosenfeld, B., Theobald, D., & Edgerton, S. (1998). Use of the Zung Self-Rating Depression Scale in Cancer Patients: Feasibility as a Screening Tool. Psycho-Oncology, 7, 483-493.
Fisher, M., & Baum, F. (2010). The social determinants of mental health: implications for research and health promotion. Australian and New Zealand Journal of Psychiatry, 44, 1057-1063.
Fryers, T., Melzer, D., Jenkins, R., & Brugha, T. (2005). The distribution of the common mental disorders: social inequalities in Europe. Clinical Practice and Epidemiology in Mental Health.
Gili, M., Roca, M., Basu, S., McKee, M., & Stuckler, D. (2012). The mental health risks of economic crisis in Spain: evidence from primary care centres, 2006 and 2010. European Journal of Public Health, 23(1), 103-108.
Grossman, M. (2000). The Human Capital Model. In A. Culyer, & J. Newhouse (Eds.), Handbook of Health Economics (Vol. 1, pp. 348-408).
27
Karanikolos, M., Mladovsky, P., Cylus, J., Thomson, S., Basu, S., Stuckler, D., . . . McKee, M. (2013). Financial Crisis, Austerity and Health in Europe. The Lancet, 381, 1323-1331.
Kenkel, D. (1995). Should you eat Breakfast? Estimates from Health Production Functions. Health Economics, 4, 15-29.
Kennedy, G., Kelman, H., & Thomas, C. (1990). The Emergence of Depressive Symptoms in Late Life: the Importance of Declining Health and Increasing Disability. Journal of Community Health, 15(2), 93-104.
Lehtinen, V., Sohlman, B., & Kovess-Masfety, V. (2005). Level of positive mental health in the European Union: Results from the Eurobarometer 2002 survey. Clinical Practice and Epidemiology in Mental Health, I(9).
Lopez, A. M., Ezzati, M., Jamison, D., & Murray, C. (2006). Global and regional burden of disease and risk factors, 2001: systematic analysis of population health data. The Lancet, 367, 1747-1757.
Lorant, V., Deliège, D., Eaton, W., Robert, A., Philippot, P., & Ansseau, M. (2003). Socioeconomic Inequalities in Depression: A Meta-Analysis. American Journal of Epidemiology, 152(2), 98-112.
Sen, A. (1992). Inequality Reexamined. Oxford: Oxford University Press.
Stuckler, D., Basu, S., Suhrcke, M., Coutts, A., & Mckee, M. (2009). The public health effect of economic crises and alternative policy responses in Europe: an
empirical analysis. The Lancet, 374(9686), 315-323.
Van Landeghem, B. (2008). Human Well-Being over the Life Cycle: Longitudinal Evidence from a 20-Year Panel. LICOS Discussion Paper, No. 213.
Weich, S., & Lewis, G. (11 de July de 1998). Poverty, unemployment, and common mental disorders: population based cohort study. BMJ(317).
World Health Organization and Calouste Gulbenkian Foundation. (2014). Social Determinants of Mental Health. Geneva: World Health Organization.
28 Appendix
Table 1: Zung Self-Rating Depression Scale (adapted for this study)
A little of the time Most of the time
1. I feel downhearted and blue
4 1
2. Morning is when I feel best
1 4
3. I have crying spells or feel like it
4 1
4. I have trouble sleeping at night
4 1
5. I eat as much as I used to
1 4
6. I get tired for no reason
4 1
7. I find it easy to do the things I used to
1 4
8. I feel hopeful for the future
1 4
9. I am more irritable than usual
4 1
10. I feel I am useful and needed
1 4
11. My life is pretty full 1 4
12. I feel others would be better off if I were dead
4 1
13. I still enjoy the things I used to do
1 4
14. My mind is as clear as it used to be
1 4
15. I am restless and
can’t keep still 4 1
29
Tables 2a) – k): Differences in Mean Scores and proportion of depressed individuals for each individual country
a) Austria 2007 2011 2013
Zung Scale Mean Score
52.54 51.22 50.85
Diff. from 2007 - -1.33*** -1.69***
%Dep 5.17% 6.56% 9.15%
Diff. from 2007 (pp.)
- 1.39 3.98**
N 498 498 498
* p<0.1; ** p<0.05; *** p<0.01
b) Germany 2007 2011 2013
Zung Scale Mean Score
52.25 51.00 50.72
Diff. from 2007 - -1.25*** -1.53***
%Dep 3.88% 5.93% 5.60%
Diff. from 2007 (pp.)
- 2.05** 1.72*
N 927 927 927
* p<0.1; ** p<0.05; *** p<0.01
c) Sweden 2007 2011 2013
Zung Scale Mean Score
52.09 51.44 51.05
Diff. from 2007 - -0.65** -1.04***
%Dep 3.32% 4.31% 5.15%
Diff. from 2007 (pp)
- 0.99 1.83**
N 1196 1196 1196
30
d) Netherlands 2007 2011 2013
Zung Scale Mean Score
52.69 52.55 52.27
Diff. from 2007 - -0.14 -0.41
%Dep 4.01% 3.94% 4.38%
Diff. from 2007 (pp.)
- 0.07 0.37
N 1367 1367 1367
* p<0.1; ** p<0.05; *** p<0.01
e) Spain 2007 2011 2013
Zung Scale Mean Score
49.47 48.33 47.37
Diff. from 2007 - -1.14*** -2.10***
%Dep 13.36% 17.93% 21.29%
Diff. from 2007 (pp.)
- 4.57*** 7.93***
N 1151 1151 1151
* p<0.1; ** p<0.05; *** p<0.01
f) Italy 2007 2011 2013
Zung Scale Mean Score
47.51 46.93 49.79
Diff. from 2007 - -0.58** -1.80***
%Dep 14.39% 16.89% 18.78%
Diff. from 2007 (pp.)
- 2.50** 4.39***
N 1639 1639 1639
31
g) France 2007 2011 2013
Zung Scale Mean Score
48.33 48.24 48.30
Diff. from 2007 - -0.09 -0.03
%Dep 13.28% 12.83% 12.53%
Diff. from 2007 (pp.)
- -0.45 -0.75
N 1310 1310 1310
* p<0.1; ** p<0.05; *** p<0.01
h) Denmark 2007 2011 2013
Zung Scale Mean Score
53.19 52.75 52.69
Diff. from 2007 - -0.44* -0.5**
%Dep 3.80% 3.46% 3.46%
Diff. from 2007 (pp.)
- 0.34 0.34
N 1473 1473 1473
* p<0.1; ** p<0.05; *** p<0.01
i) Switzerland 2007 2011 2013
Zung Scale Mean Score
52.92 52.42 52.16
Diff. from 2007 - -0.50 -0.76**
%Dep 2.81% 3.28% 2.81%
Diff. from 2007 (pp.)
- 0.47 0.00
N 849 849 849
32
j) Belgium 2007 2011 2013
Zung Scale Mean Score
50.00 49.32 49.59
Diff. from 2007 - -0.68** -0.41
%Dep 9.09% 10.85% 10.80%
Diff. from 2007 (pp.)
- 1.76* 1.71*
N 1757 1757 1757
* p<0.1; ** p<0.05; *** p<0.01
k) Czech Rep. 2007 2011 2013
Zung Scale Mean Score
51.01 49.42 49.05
Diff. from 2007 - -1.59*** -1.96***
%Dep 7.11% 9.70% 10.95%
Diff. from 2007 (pp.)
- 2.59** 3.84***
N 1035 1035 1035
33
Table 3 –List of covariates employed in the regressions
List of covariates
Gender Gender=1 if respondent is male
Age Measured in years
Education Educ1=1 for primary education
Educ2=1 for secondary education
Long-term Illness =1 for a long term illness
Income Log of income level
Physical Activity (frequency) =1 for “Rare”
=1 for “Occasionally” =1 for “Frequently Medical Consultations No. of medical consultations in the last
month
Occupational Status =1 for “Unemployed”
=1 for ”Retired” =1 for “Disabled”
Year Dummies =1 for 2011
=1 for 2013
GDP Real GDP growth
Unemployment Rate Unemployment rate at the end of the
year
34
Table 5 a) –Full probit estimations with country controls
* p<0.1; ** p<0.05; *** p<0.01 %Depression
gender -0.452 -0.452
(12.60)*** (12.61)***
Age -0.163 -0.163
(7.68)*** (7.67)***
Age^2 0.001 0.001
(8.57)*** (8.56)***
Educ1 -0.317 -0.319
(5.65)*** (5.68)***
Educ2 -0.516 -0.519
(9.13)*** (9.17)*** L. Term
Illness
0.616 0.616
(19.56)*** (19.57)***
LogIncome -0.014 -0.014
(3.25)*** (3.22)***
Actv – Rare -0.350 -0.350
(6.64)*** (6.65)***
Act – Occas. -0.403 -0.403
(8.66)*** (8.68)***
Act – Freq -0.467 -0.469
(12.59)*** (12.65)***
Nr. Consult. 0.015 0.015
(12.17)*** (12.12)***
Unemployed 0.433 0.430
(4.83)*** (4.79)***
Retired 0.013 0.012
(0.27) (0.25)
Disabled 0.517 0.515
(6.94)*** (6.91)***
2011 year -0.056 -0.107
(1.36) (1.73)*
2013 year -0.148 -0.182
(2.20)** (2.02)**
GDP growth -0.053 -
(2.72)***
Unmp. Rate 0.007 -
(1.30)
Output Gap -0.029
(2.84)***
Constan 3.298 3.230
(4.42)*** (4.37)***
Germany -0.028 0.003
(0.24) (0.03)
Sweden -0.035 -0.018
(0.30) (0.16)
Netherlands -0.078 -0.048
(0.68) (0.43)
Spain 0.524 0.586
(4.10)*** (5.20)***
Italy 0.757 0.853
(6.98)*** (8.31)***
France 0.609 0.664
(5.72)*** (6.39)***
Denmark -0.370 -0.301
(3.18)*** (2.63)***
Switzerland -0.268 -0.274
(2.10)** (2.15)**
Belgium 0.429 0.501
(4.13)*** (4.88)***
Czech Rep. 0.437 0.469
(3.98)*** (4.29)***
35
Tables 6 a – c) – Health Expenditure as a percentage of GDP
a) Central Europe