Revista Brasileira de Geof´ısica (2004) 22(2): 115-125 © 2004 Sociedade Brasileira de Geof´ısica ISSN 0102-261X
www.scielo.br/rbg
SEISMIC ACTIVITY IN SENADOR S ´A-CE, BRAZIL, 1997–1998
George Sand Franc¸a
1, Joaquim Mendes Ferreira
2and Mario Koechi Takeya
3Recebido em 3 maio, 2004 / Aceito em 9 setembro, 2004 Received May 3, 2004 / Accepted September 9, 2004
ABSTRACT.The Tucunduba Dam is about 290 km West of Fortaleza, in Cear´a state. The seismic monitoring of the area, with a local network, began on June 11, 1997, soon after the occurrence of an event with magnitude3.2mbon June 09, 1997. The monitoring was done with one analog station (used for magnitude measurement and statistical control of the activity) and seven digital stations. The digital three-component stations were operated from June to November 1997. In this work, the data collected during digital monitoring was analyzed to determine hypocenters and focal mechanism. To determine the hypocenters, we used a half-space model, whose parameters were 5.95 km/s, for P-wave velocities, and 1.69 for the ratio between P and S-wave velocities. The active zone was nearly 1 km long, with depth between 4.5 and 5.2 km. With 16 events recorded in the same six stations, we determined the direction of the fault plane (NE-SW). The fault mechanism is strike-slip with a small normal component. The dip was estimated to be65◦SE using composite focal mechanisms and80◦SE from the P/S amplitudes ratios. Preliminary estimates of maximum horizontal compressive stress, from the P-axis direction, were in agreement with Ferreiraet al.(1998). The small difference is probably due to influence of the sedimentary basin on the regional stress. The active area is in accordance with seismicity described by Assumpc¸˜ao (1998).
Keywords: seismicity, focal mechanism, intraplate stress.
RESUMO.O Ac¸ude Tucunduba est´a localizado no munic´ıpio de Senador S´a, a aproximadamente 290 km a oeste de Fortaleza – CE. O monitoramento s´ısmico da regi˜ao foi realizado com uma rede sismogr´afica local e teve in´ıcio em 11 de junho de 1997, logo ap´os a ocorrˆencia de um evento com magnitude3,2mb, no dia 09 de junho de 1997. A rede era composta de uma estac¸˜ao anal´ogica (utilizada na determinac¸˜ao da magnitude e no controle estat´ıstico da atividade) e sete estac¸˜oes digitais. As estac¸˜oes digitais, com trˆes componentes cada, operaram no per´ıodo de junho a novembro de 1997. Neste trabalho foram analisados os dados coletados pelas estac¸˜oes digitais objetivando a determinac¸˜ao de hipocentros e mecanismos focais. Para determinac¸˜ao hipocentral, usamos um modelo de semi-espac¸o, de parˆametros iguais a 5,95 km/s, para a velocidade da onda P, e 1,69, para a raz˜ao entre as velocidades das ondas P e S. A zona ativa era de aproximadamente 1 km de extens˜ao e a profundidade variando de 4,5 a 5,2 km. Com um conjunto de 16 sismos, registrados na mesmas seis estac¸ ˜oes, foi determinado um plano de falha (NE-SW) com um mecanismo focal transcorrente e uma pequena componente normal. O mergulho foi estimado para est´a entre65◦SE, usando o mecanismo focal composto e80◦SE, atrav´es da raz˜ao das amplitudes P/S. Estimativas preliminares do esforc¸o m´aximo compressivo horizontal, a partir da direc¸˜ao do eixo-P, est˜ao de acordo com Ferreira et al. (1998). A pequena diferenc¸a pode ser devido `a influˆencia da bacia sedimentar no esforc¸o regional. O comportamento da atividade est´a de acordo com a sismicidade descrita por Assumpc¸˜ao (1998).
Palavras-chave: sismicidade, mecanismo focal, esforc¸o intraplaca.
Laborat´orio Sismol´ogico, Departamento de F´ısica Te´orica e Experimental, Universidade Federal do Rio Grande do Norte, Campus Universit´ario, 59072-970 Natal, RN,
Brazil – Fax: (84) 3215-3791
INTRODUCTION
The Northwest of Cear´a is an area of seismic activity known since the XIX century (Ferreira & Assumpc¸˜ao, 1983; Berrocal et al., 1984; Ferreiraet al., 1998). On June 09, 1997, an event with mag-nitude3.2mb(Intensity III-IV MM) occurred in the district of
Ser-rota, Senador S´a-CE, scaring the local population. The growth of the seismic activity in Serrota, especially in the Tucunduba Reser-voir, led the Universidade Federal do Rio Grande do Norte (UFRN) to study the seismic activity, in order to determine the hypocen-ter and displacement mechanism with high precision and to try to understand the local seismicity.
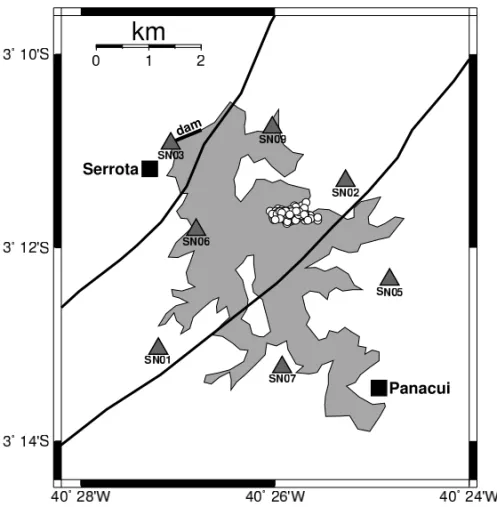
For this study, an analog station and a digital network with se-ven stations were installed (Figure 1). The analog station opera-ted from June 11, 1997 to August 14, 1998 and the digital network from June 18 to November 05, 1997. The analog station was used in the statistics of the earthquakes as well as to obtain the magni-tude from the duration (mD =1.64 logD−0.97), using the
same parameters as Blum & Assumpc¸˜ao (1990), since the analog station operated in the same conditions.
LOCAL GEOLOGY
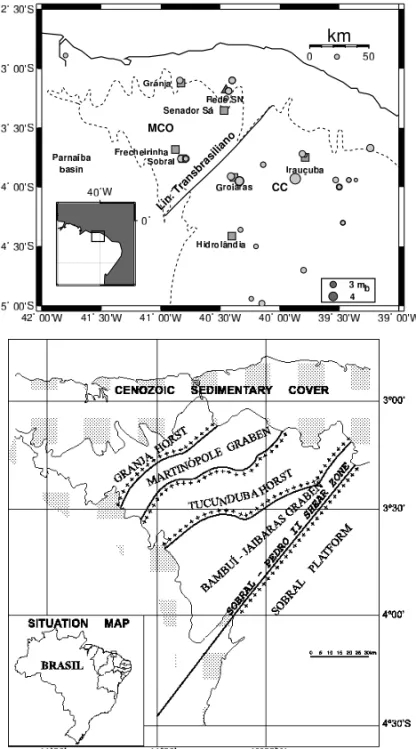
The seismic area is part of the Borborema province which is divided in to five tectonic domains (Brito Neves et al., 2000). The Northwest of Cear´a is formed by two of these domains; the Medium Corea´u Domain (MCO) and the Cear´a Central Domain (CC)(Figure 2a).
The CC domain consists of gneissic basement formed during the Transamazonian collage and contains a series of middle Neo-proterozoic supracrustal sequences or remanent of folds belts and expressive Brasiliano plutonism.
The dam is located at the boundary of the MCO domain, more precisily on the Tucunduba horst (Figure 2b). The MCO domain is bounded by the cenozoic sedimentary cover, CC domain and Parna´ıba basin. The domain is characterized by a series of gra-bens and horsts lying along SW-NE (Torquato & Nogueira Neto, 1996) whose boundary faults in the same direction (Transbrasi-liano Lineament or Sobral-Pedro II Shear zone) and consists of basement high-grade methamorphic rocks and pelitic-carbonate (2.5 Ga) fold belts(Figure 2b). Figure 1 shows two faults that cross the dam, those faults were mapped by DNPM (1971).
SEISMIC ACTIVITY
The seismic activity in the Northwest of Cear´a is known since last century (Ferreira & Assumpc¸˜ao, 1983), as shown in Table 1. After two events with magnitude 3.9 and 4.1mbin Groa´ıras in 1988, the
Universidade Federal do Rio Grande do Norte installed a network of stations in order to study the activity of Groa´ıras. This network also allowed the study of other close areas that consequently had been also studied (Ferreiraet al.1998). Table 1 and Figure 2 show the main events that occurred in the Northwest of the Cear´a.
A large event in the Tucunduba Dam, with magnitude3.2mb,
occurred on June 9, 1997 and was felt mainly in Serrota, a small village in Senador S´a, by the margins of the dam (Figure ), where roofs and windows were shaken, school materials fell off desks and, the inhabitants were frigtened (Franc¸a, 1999). Subsequently, on June 11, 1997, an analog seismograph station, using an MEQ-800 with smoked paper recorder (SN1A), was installed. A local network with seven digital short period portable stations were also installed, on June 18, 1997. Except for station SN03, all the stati-ons were installed in granitic/gneissic bedrocks of the crystalline basement, allowing low noise and clear P and S wave arrivals. The digital station clocks were corrected every hour using GPS and P-wave readings had an accuracy to±0.001s.
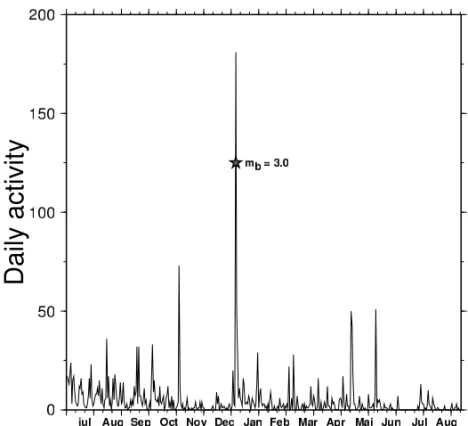
Station SN1A operated from June 11, 1997 to August 14, 1998, recording a total of 2217 events (Figure 3), and the largest magnitude wasmb= 3.0 on December 12, 1997.
Determination of Hypocenters
Hypocenters were determined using the program HYPO71 (Lee & Lahr, 1975). Half-space velocity models have produced results with considerable accuracy when applied to several areas of Bra-zilian Northeast (Ferreiraet al., 1987; 1995; 1998; Takeyaet al.,
1989; Nascimento, 1997). This half-space model was adopted, since the seismic area is in the precambrian basement composed of consolidated rocks and low attenuation, generating clear P and S waves arrivals in the seismographs (Figure 4).
Various tests were made to find the best P velocity (vP) and
(vP/vS) ratio. We varied the P wave velocity between 5.4 and
6.45 km/s and thevP/vSratio between 1.60 and 1.74. The
ve-locity model with the lowest root mean square (rms) time resi-dual hadvP/vS= 1.69 andvP= 5.95 km/s. The value forvP
is acceptable, since in different parts of the world, vP in
GEORGE SAND FRANC¸A, JOAQUIM MENDES FERREIRA and MARIO KOECHI TAKEYA
117
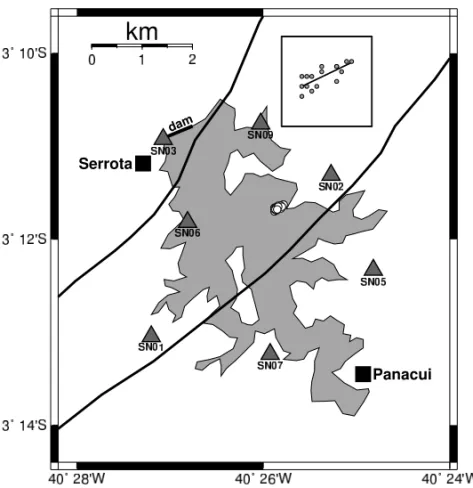
Figure 1– Map of the locations of the seismographic stations. The triangles represent the seismographic stations. At SN01 an analogical (SN1A) and a digital station were deployed. The squares represent the small villages; lines crossing the dam are faults (DNPM, 1973). Cicles are epicenters recorded by local network. The 160 selected events (circles), recorded by at least four stations (rms≤0.02 s, erh≤0.02 km, erz≤0.2 km).
Figura 1–Mapa das estac¸˜oes sismogr´aficas. O triˆangulo representa a estac¸˜ao sismogr´afica. A estac¸˜ao anal´ogica (SN1A) foi instalada na mesma localizac¸˜ao de SN01. Os quadrados indicam as localidades maiores pr´oximas ao ac¸ude e as linhas que interceptam o ac¸ude indicam falhas mapeadas (DNPM, 1973). C´ırculos s˜ao os epicentros registrados pela rede local. Os 160 eventos selecionados (c´ırculos), registrados em pelo menos em 4 estac¸˜oes (rms≤0,02 s, erh≤0,02 km, erz≤0,2 km).
As can be seen, all events occurred inside the lake, in a zone about 1 km long with depths between 4.5 and 5.2 km, approxima-tely an cluster with probable direction E-W. The Tucunduba dam, constructed in 19191, has the maximum height of 17.6 m and a depth of 10 m. According to Baecher and Keeney (1982), the pro-bability of induced seismic activity at this hight is very low, less than 10%. Moreover, there is no information about the change in the water level before or the seismic activity during and after impoundment. Thus, the induced seismicity was ruled out.
FAULT PLANE
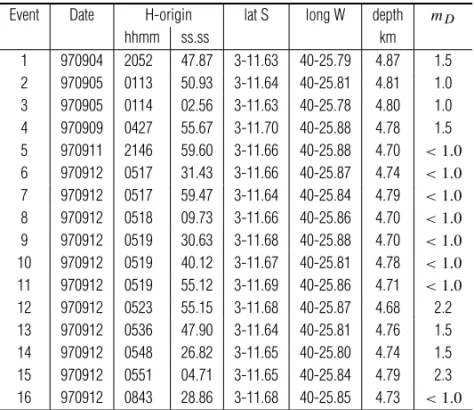
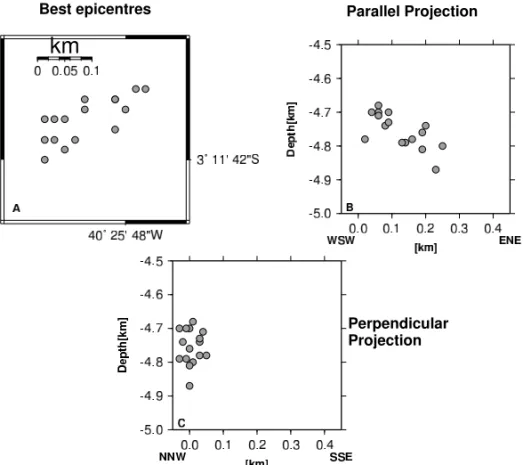
To estimate the fault plane, we used the 16 best-located events recorded at the same six stations (Table 2, Figure 5). The hypo-centers were distributed along a 0.3 km length, with depth varying from 4.68 to 4.87 km (Figure 6).
Using these data, we determined, using least squares, the
di-rection and the dip of the fault plane. The azimuth was60◦±10◦
and the dip88◦±11◦. Projections of the hypocenters parallel and perpendicular to the fault plane are shown in the Figure 6. The vertical and horizontal maximum errors observed for this set of data were 0.1 km, while the range of the active zone was of 0.3 km and the variation in depth was of 0.2 km. In these conditions, the hypocentral distribution can provide only a rough estimate of the fault plane orientation.
FOCAL MECHANISMS
Composite focal mechanisms were determined using clear P wave first motions with aid of the FPFIT program (Reasenberg & Oppe-nheimer, 1985). The FPFIT program does a grid search to find the solution that minimizes a weighted sum of discrepancies in the polarities, considering both the estimated variance of the data and the theoretical P wave radiation amplitude (Reasenberg &
Table 1– The main events ever recorded in the Northwest of the Cear´a with magnitude≥ 3.0mb and intensity≥ I VMM (MM - Modified Mercalli, RBGf - Boletim S´ısmico da Revista Brasileira de Geof´ısica, IAG - Instituto de Astronomia, Geof´ısica e Ciˆencias Atmosf´ericas).
Tabela 1–Os principais eventos registrados no Noroeste do Cear´a com magnitude≥3.0mbe in-tensidade≥ I V MM (MM - Mercalli Modificada, RBGf - Boletim S´ısmico da Revista Brasileira de Geof´ısica, IAG - Instituto de Astronomia, Geof´ısica e Ciˆencias Atmosf´ericas).
Local Date Mag Int. Reference (mb) (MM)
Granja 1942 3.0 IV Ferreira & Assumpc¸˜ao, 1983 S.L. do Curu 15/12/1974 3.3 VII Ferreira & Assumpc¸˜ao, 1983
Itapaj´e 25/02/1987 3.0 IV RBGf Groa´ıras 01/04/1988 4.1 V-VI RBGf Groa´ıras 01/04/1988 3.9 - RBGf Frecheirinha 27/12/1989 3.2 IV-V RBGf Irauc¸uba 19/04/1991 4,8 VI-VII RBGf Groa´ıras 10/05/1995 3.4 - RBGf Frecheirinha 22/04/1997 3.2 - UFRN/IAG
Senador S´a 09/06/1997 3.2 - UFRN/IAG Senador S´a 12/12/1997 3.0 - UFRN/IAG
Table 2– Events recorded by at least the six stations. H-origin is the true origin,mD is the duration magnitude using the same parameters as Blum & Assumpc¸˜ao (1990) (mD = 1.64+log D−0.97).
Tabela 2–Eventos registrados nas mesmas seis estac¸˜oes. H-origin ´e a hora de origem,
mD ´e a magnitude de durac¸˜ao usando os mesmos parˆametros de Blum & Assumpc¸˜ao (1990) (mD=1,64+log D−0.97).
Event Date H-origin lat S long W depth mD
hhmm ss.ss km
1 970904 2052 47.87 3-11.63 40-25.79 4.87 1.5 2 970905 0113 50.93 3-11.64 40-25.81 4.81 1.0 3 970905 0114 02.56 3-11.63 40-25.78 4.80 1.0 4 970909 0427 55.67 3-11.70 40-25.88 4.78 1.5 5 970911 2146 59.60 3-11.66 40-25.88 4.70 <1.0
6 970912 0517 31.43 3-11.66 40-25.87 4.74 <1.0
7 970912 0517 59.47 3-11.64 40-25.84 4.79 <1.0
8 970912 0518 09.73 3-11.66 40-25.86 4.70 <1.0
9 970912 0519 30.63 3-11.68 40-25.88 4.70 <1.0
10 970912 0519 40.12 3-11.67 40-25.81 4.78 <1.0
11 970912 0519 55.12 3-11.69 40-25.86 4.71 <1.0
GEORGE SAND FRANC¸A, JOAQUIM MENDES FERREIRA and MARIO KOECHI TAKEYA
119
Figure 2– Simplified maps of NW Cear´a; a. Map showing the two main domains in NW Cear´a. The Medium Corea´u Domain = MCO, the Cear´a Central Domain = CC and Transbrasiliano lineament. The dashed line is the limit of the sedimentary basins. Cicles are epicenters recorded by the UFRN network. Triangles indicate seismic stations. b. Figure showing the location of the Bambui-Jaibaras, and Martin ´opole grabens separated by the Tucunduba horst (Figure taken from Sialet al., 2000 – p. 550, Fig. 9).
Figura 2–Mapa simplificado do NW do Cear´a, Brasil; a. Mapa mostra dois dom´ınios principais no NW do Cear´a. O dom´ınio do M´edio Corea´u = MCO , o dom´ınio do Cear´a Central = CC e o Lineamento Transbrasiliano. Linha tracejada ´e o limite da bacia sedimentar. C´ırculos s˜ao epicentros re-gistrados pela rede da UFRN. Triˆangulo indica estac¸˜ao s´ısmica. b. Figura mostra a localizac¸˜ao dos grabens Bambui-Jaibaras e Martin´opole separados pelo horst Tucunduba (Figura cedida por Sial et al., 2000 - p. 550, Fig. 9).
Oppenheimer, 1985). In order to improve our estimates, we used the information contained in the amplitude ratios of P and S waves (SV/SH, SV/P and SH/P ratios) to restrain the number of possi-ble nodal-plane solutions (e.g. Kisslinger 1980; Kisslinger et al. 1982). This estimate is for individual events where we used the code focmec, developed by Snoke et al. (1984).
Figure 3– Tucunduba activity. Number of daily events recorded by SN1A station from June 11, 1997 to August 14, 1998.
Figura 3–Atividade de Tucunduba. N´umero de sismos registrados por dia pela estac¸˜ao SN1A, no per´ıodo de 11 de junho de 1997 a 14 de agosto de 1998.
Figure 4– Seismogram recorded at SN07 station with clear P and S arrivals in the vertical component. Event n◦15 (table 2) with magnitude 2.3m
b.
GEORGE SAND FRANC¸A, JOAQUIM MENDES FERREIRA and MARIO KOECHI TAKEYA
121
Figure 5– Map of epicenters with 16 selected events (circles), recorded by at least six stations. Triangles indicate seismic stations. Squares represent a closer look of the epicenters.
Figura 5–Mapa epicentral dos 16 eventos selecionados (c´ırculos), registrados nas mesmas seis estac¸˜oes. Triˆangulo indica estac¸˜ao s´ısmica. Quadrado representa uma ampliac¸˜ao dos epicentros.
Table 3 and Figure 8. The solution of the focal mechanism is ap-proximately a NE-SW fault, with strike-slip dextral movement with normal component. The fault plane was chosen by taking into ac-count the hypocentral distribution (Figure 5). The composite focal mechanism solution is a strike-slip type, which is predominant in the northeast of Brazil (Assumpc¸˜aoet al., 1985; 1989; Ferreira
et al.,1995; 1998). The direction of the P axis (278◦), obtained using FPFIT, differs by6◦from the maximum horizontal compres-sive stress (S Hmax), obtained by Ferreiraet al.(1998) in the NE
Cear´a region.
Secondly, for individual focal mechanism, we used selected six events from Table 2 (Table 4), using as our selection crite-rion the largest number of clear polarities of the S wave. The re-sults obtained through FOCMEC are in Table 4, limiting the range of orientation (between60◦and90◦) and dip (between0◦and
30◦) of the B (null axis), A and N (corresponding to Herrmann’s X and Y axes) axes, with a step of2◦. The solutions that satisfy
the polarity data and that fit the amplitude ratios within a given maximum residual in terms of log (amplitude ratio). The results showed a strike-slip mechanism. The average strike for all events
was65◦±19◦. The average dip was80◦±9◦. These average
values were close the values obtained by fitting of the fault plane by least squares and composite focal mechanisms (FPFIT).
To estimateSH maxusing the individual focal mechanism, we
averaged of the P-axes directions, since all events are strike-slip. The obtained value was265◦, near the values obtained by FPFIT
(278◦) for the direction of the P axis it differ by about20◦from the value ofSH maxfor northwestest Cear´a (293◦) obtained by
Ferreiraet al.(1998).
DISCUSSION
A network composed of seven portable digital stations, almost all installed in granitic/gneissic bedrocks of the crystalline basement, was used to monitor the seismic activity in the Tucunduba Dam. It was possible to obtain records of good quality, with clear P and S waves. In addition, the network configuration used two stati-ons that were installed close to the epicentral area. Thus, it was possible to determine the hypocenters with high accuracy.
Figure 6– A) Detailed map of epicenters in Figure 5. B and C) Projections of the hypocenters on the vertical plane across the probable fault plane (Parallel and Perpendicular), respectively.
Figura 6–A) Mapa detalhado dos epicentros na Figura 5. B e C) Projec¸˜oes dos hipocentros no plano vertical ao longo do prov´avel plano de falha (Paralelo e Perpendicular, respectivamente).
Table 3– Result of the composite focal mechanism using FPFIT program (Reasemberg & Oppenhei-mer, 1985).
Tabela 3–Resultado do mecanismo focal composto usando o programa FPFIT (Reasemberg & Oppenheimer,1985).
Azimuth Dip Rake P-Az/plunge T-Az/plunge
60◦±11◦ 65◦±5◦ −174◦±4◦ 278◦ 27◦ 15◦ 14◦
inside the Tucunduba Reservoir.
A set of 16 events recorded by the same six stations was selec-ted to define a fault plane, yielding values of60◦for the azimuth and88◦for the dip.
The focal mechanism solution shows a dextral NE-SW strike-slip fault with normal component. This solution is consistent with a succession of horsts and grabens in the MCO domain (direc-tion NE-SW), with the same direc(direc-tion as the main faults in the northwest of Cear´a. The fault plane was chosen by taking into account the hypocentral distribution (Figure 6). The direction of the P axes (278◦), obtained by composite focal mechanism, dif-fers by15◦from the direction of the horizontal maximum stress
(SH max), obtained by Ferreiraet al.(1998). In the determination
of individual focal mechanisms, there are three or four stations with the same polarities, which may indicate that mechanisms do not change much. Thus the strike-slip mechanism is fully in ac-cord with previous results. The average direction of the individual planes are65◦for the azimuth and80◦for the dip, which are close to the values obtained by the composite mechanism and le-ast squares plane fitting. As the direction of horizontal maximum stress (SH max) was265◦, it differs1◦from the best estimated
by Ferreiraet al.(1998).
GEORGE SAND FRANC¸A, JOAQUIM MENDES FERREIRA and MARIO KOECHI TAKEYA
123
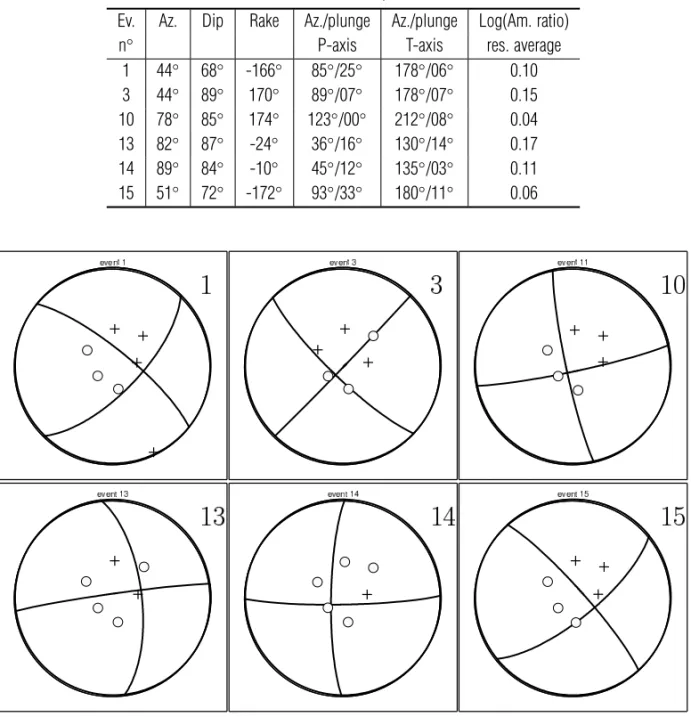
Table 4– Results of focal mechanism – FOCMEC. All solutions show strike-slip mechanism with focal mechanism event numbers corresponde to Table 2.
Tabela 4–Resultado do mecanismo focal – FOCMEC. Todas soluc¸˜oes mostram mecanismos transcorrente onde o n´umero do mecanismo focal corresponde aos eventos na Tabela 2.
Ev. Az. Dip Rake Az./plunge Az./plunge Log(Am. ratio) n◦ P-axis T-axis res. average
1 44◦ 68◦ -166◦ 85◦/25◦ 178◦/06◦ 0.10
3 44◦ 89◦ 170◦ 89◦/07◦ 178◦/07◦ 0.15
10 78◦ 85◦ 174◦ 123◦/00◦ 212◦/08◦ 0.04
13 82◦ 87◦ -24◦ 36◦/16◦ 130◦/14◦ 0.17
14 89◦ 84◦ -10◦ 45◦/12◦ 135◦/03◦ 0.11
15 51◦ 72◦ -172◦ 93◦/33◦ 180◦/11◦ 0.06
Figure 7– Focal mechanisms using FOCMEC and half-space model; + = up and◦= down; Numbers refer to table 2.
Figura 7–Mecanismos focais usando FOCMEC, com modelo de semi-espac¸o; + = up e◦= down.
Brazil (Assumpc¸˜aoet al., 1985; 1989; Ferreiraet al., 1995; 1998). TheSH maxestimated has a small difference. Probably, that
diffe-rence is because Ferreiraet al., (1998) used events to the South of the active area and that the line of the coast suffers more flexural effect than area to the South.
The events at Senador S´a are consistent with the stress regime determined by Ferreiraet al. (1998) in NW Cear´a (EW compres-sion, NS extension) and can be used to extend the stress province towards the coastline.
ACKNOWLEDGMENTS
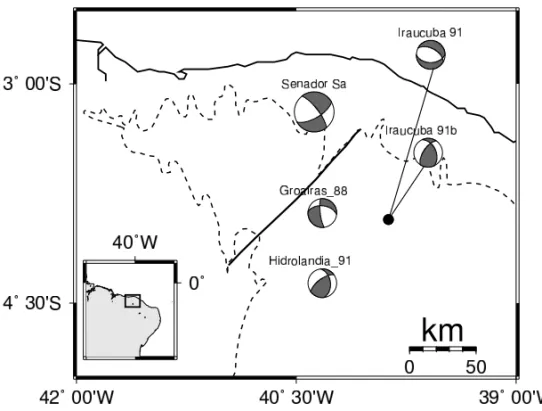
Figure 8– Composite Focal Mechanism for the 16 events of Senador S´a (Table 1). Lower hemisphere, equal-area projections. Black and white quadrants Circles denote compressive and extensive first motions, respectively. Others mechanisms from Ferreiraet al.(1998).
Figura 8–Mecanismo focal composto para 16 eventos de Senador S´a (Tabela 1). Hemisf´erio inferior, projec¸˜ao de “equal-area”. Quadrantes preto e branco (nos c´ırculos) representam primeiro movimento compressivo e extensivo, respectivamente. Outros mecanismos foram obtidos por Ferreira et al. (1998).
providing us Figure b. Maps were plotted using GMT (Wessel & Smith, 1991) and seismograms were analysed with SAC (Golds-teinet al.,2001). GSF is supported by CNPq (309975/2003-4).
REFERENCES
ASSUMPC¸˜AO M. 1998. Seismicity and Stress in the Brazilian Passive Margin. Bull. Seism. Soc. Am., 88(1): 160–169.
ASSUMPC¸˜AO M, SU´AREZ G & VELOSO JA. 1985. Fault plane solutions of intraplate earthquakes in Brazil: some constrains on the regional stress field. Tecnophysics, 113: 283–293.
ASSUMPC¸˜AO M, FERREIRA JM, CARVALHO JM, BLUM ML, MENEZES EA, FONTENELE D & AIRES A. 1989. Seismic activity in Palhano, CE, October 1988, preliminary results. Rev. Bras. Geof´ıs., 134: 11–17.
BAECHER GB & KEENEY RL. 1982. Statistical Examination of Reservoir-induced Seismicity. Bull. Seismol. Soc. Am., 72: 553–569.
BERROCAL J, ASSUMPC¸˜AO M, ANTEZANA R, DIAS NETO CM, ORTEGA R, FRANC¸A H & VELOSO JAV. 1984. Sismicidade do Brasil. Instituto de Astronomia, Geof´ısica e Ciˆencias Atmosf´ericas, Universidade de S˜ao Paulo, 320 pp. (in Portuguese).
BLUM ML & ASSUMPC¸˜AO M. 1990. Estimativa do parˆametro b dos sis-mos de Palhano, CE, de outubro de 1988. XXXVI Congr. Brasileiro de Geologia, Natal, RN. Anais, 5: 2160–2163 (in Portuguese).
BOLETIM S´ISMICO. published monthly in Rev. Bras. Geof.
BRITO NEVES BB, DO SANTOS EJ & VAN SCHMUS WR. 2000. Tecto-nic history of the Borborema Province, Northeastern Brazil. In Cordani U, Milani EJ, Thomaz Filho A & Campos DA, eds., Tectonic evolution of South America31stInternational Geological Congress, Rio de Janeiro, Brazil, p. 151–182.
CHRISTENSEN NI. 1982. Seismic velocities, in: Charmichael RS (Ed.), Handbook of Physical Properties of Rocks, Vol II CRC Press, Boca Raton, FL, p. 2–228.
CHRISTENSEN NI & MOONEY WD. 1995. Seismic velocity structure and composition of the continental crust: a global view. J. Geophys. Res., 100: 9761–9788.
DNPM. 1973. Projeto Jaibaras. 1:100.000.
FERREIRA JM & ASSUMPC¸˜AO M. 1983. Sismicidade do Nordeste do Brasil. Rev. Bras. Geof´ıs., 1: 67–88 (in Portuguese).
FERREIRA JM, TAKEYA MK, COSTA JM, MORREIRA JAM, ASSUMPC¸˜AO M, VELOSO JAV & PEARCE RG. 1987. A continuing intraplate earthquake sequence near Jo˜ao Cˆamara – Northeastern Brazil – preliminary results. Geophys. Res. Lett., 14: 1402–1405.
GEORGE SAND FRANC¸A, JOAQUIM MENDES FERREIRA and MARIO KOECHI TAKEYA
125
FERREIRA JM, OLIVEIRA RT, TAKEYA MK & ASSUMPC¸˜AO M. 1998. Su-perposition of local and regional stresses in northeast Brazil : evidence from focal mechanisms around the potiguar marginal basin. Geophys. J. Int., 134: 341–355.
FRANC¸A GS. 1999. Estudo s´ısmico no Ac¸ude Tucunduba, Senador S´a. CE. Dissertac¸˜ao de Mestrado PPGG/UFRN, 85 p. (in Portuguese).
GOLDSTEIN P, DODGE D & FIRPO M. 2001. SAC2000: Signal pro-cessing and analysis tools for seismologists and engineers, UCRL-JC-135963, Invited contribution to the IASPEI, International Handbook of Earthquake and Engineering Seismology.
KISSLINGER C. 1980. Evolution of S to P amplitude ratios for determi-ning focal mechanisms from regional network observations. Bull. Seism. Soc. of Am. 70: 999–1014.
KISSLINGER C, BOWMAN JR & KOCH K. 1982. Determination of focal mechanism from SV/P amplitude ratios at small distances. Phys. Earth and Planet. Int., 30: 172–176.
LEE WHK & LAHR JC. 1975. HYPO71(revised): a computer program for determing hypocenter, magnitude, and first motion pattern of local earth-quakes. U.S. Geol. Surv. Open File Rep., 75–311, 114pp.
NASCIMENTO AF. 1997. Estudo da sismicidade induzida pelo reservat´orio da barragem do Assu (RN) Dissertac¸˜ao de Mestrado
PPGG/UFRN, 68 p. (in Portuguese).
REASENBERG P & OPPENHEIMER D. 1985. FPFIT, FPPLOT and FP-PAGE: Fortran computer programs for calculating and displaying earth-quake fault-plane solutions. U. S. Geol. Surv. Open File Rep., 85–739, 109p.
SIAL AN, FERREIRA VP, DE ALMEIDA ARet al. 2000. Carbon isotope fluctuations in Precambrian carbonate sequences of several localities in Brazil. An. Acad. Bras. Ciˆenc., 72(4): 539–558.
SNOKE JA, MUNSEY JW, TEAGUE AG & BOLLINGER GA. 1984. A pro-gram for focal mechanism determination by combined use of polarity and SV-P amplitude ratio data. Earthquake Notes, 55(3): 15.
TAKEYA M, FERREIRA JM, PEARCE RG, ASSUMPC¸˜AO M, COSTA JM & SOPHIA CM. 1989. The 1986-1988 intraplate earthquake sequence near Jo˜ao Cˆamara, northeast Brazil-evolution of seismicity. Tectonophysics, 167: 117–131.
TORQUATO JR & NOGUEIRA NETO JA. 1996. Histografia da regi˜ao de dobramentos do m´edio corea´u. Rev. Bras. de Geociˆencias, 24(4): 303– 314 (in Portuguese).
WESSEL P & SMITH WHF. 1991. Free software helps maps and displays data: Eos Trans. AGU, 72: V441 445–446.
NOTES ABOUT THE AUTHORS
George Sand Le˜ao Ara´ujo de Franc¸a.Doctor in Geophysics at University of S˜ao Paulo (2003); worked at Seismological Observatory of University of Bras´ılia (2003), and at the Department of Physics in the Federal University of Rio Grande do Norte (2004-present). Main interests: intraplate seismicity, local and reservoir induced seismicity, crustal and upper mantle structure.
Joaquim Mendes Ferreira.Doctor in Geophysics at University of S˜ao Paulo (1997); worked at Department of Physics of UFRN since 1976 and with Seismology since 1979. Main interests: intraplate seismicity, local and reservoir induced seismicity, seismic risk assessment.