ISSN online: 1807-1775
DOI: 10.4301/S1807-17752013000200004
_____________________________________________________________________________________ Manuscript first received/Recebido em 02/05/2012 Manuscript accepted/Aprovado em: 31/03/2013 Address for correspondence / Endereço para correspondência
Fabrício Sobrosa Affeldt, Professor at IFRS Federal Institute of Education, Science and Technology of Rio Grande do Sul Business Administration Course Rua Carmense, 85 – Bairro Rubem Berta – CEP 91180-310 – Porto Alegre – RS – Brazil Telephone: +55 (51) – 9999 6377 E-mail:
Sady Darcy da Silva Junior, Professor at IFRS Federal Institute of Education, Science and Technology of Rio Grande do Sul , Business Administration Course. Rua Dr. Egon Renner, 40 – Bairro Aberta dos Morros – CEP 91751-500 – Porto Alegre – RS – Brazil Telephone: (51) – 8183-9383 E-mail:
Published by/ Publicado por: TECSI FEA USP – 2013 All rights reserved.
INFORMATION ARCHITECTURE ANALYSIS USING BUSINESS
INTELLIGENCE TOOLS BASED ON THE INFORMATION
NEEDS OF EXECUTIVES
Fabrício Sobrosa Affeldt Sady Darcy da Silva Junior
Federal Institute of Education, Science and Technology of Rio Grande do Sul Porto Alegre, Brazil
______________________________________________________________________
ABSTRACT
Devising an information architecture system that enables an organization to centralize information regarding its operational, managerial and strategic performance is one of the challenges currently facing information technology. The present study aimed to analyze an information architecture system developed using Business Intelligence (BI) technology. The analysis was performed based on a questionnaire enquiring as to whether the information needs of executives were met during the process. A theoretical framework was applied consisting of information architecture and BI technology, using a case study methodology. Results indicated that the transaction processing systems studied did not meet the information needs of company executives. Information architecture using data warehousing, online analytical processing (OLAP) tools and data mining may provide a more agile means of meeting these needs. However, some items must be included and others modified, in addition to improving the culture of information use by company executives.
Keywords: business intelligence, information needs, information architecture, OLAP,
1 INTRODUCTION
Information technology should help organizations to understand their position in relation to their competitors, learn about their customers, monitor relationships with suppliers and control strategic objectives (Venkatraman; Henderson, 2004). Business Intelligence (BI) technology aims to improve the quality of information delivered to managers; it is being increasingly used in the business environment and has been the subject of scientific research.
BI, or business intelligence, encompasses broad concepts: a) an intelligence tool based on information and monitoring the environment using data from various sources (Petrini; Pozzebon; Freitas, 2004); b) a technological tool to support managerial business decisions in organizations by means of software. With respect to technology, systems centralize information from multiple data sources, in large quantities, stored in data warehouse systems (Inmon, 1997) or data marts (Kimball, 1998), with flexibility in accessing, structuring and navigating through information (Barbieri, 2001; THOMSEN, 2002).
Information architecture is an important factor in making businesses more agile and based on factual analysis, rapidly and consistently providing company executives with the necessary information so that decisions can be made based on these analyses (Tupper, 2011; Thomsen, 2002; Inmon; Terderman; Imhoff, 2001).
In a survey of large Brazilian companies, Petrini, Pozzebon and Freitas (2004), found that 73% had been using BI for just over 3years. The authors concluded that its implementation, at that time, was based more on technological objectives than information needs. This led to problems in the initial use of BU technology, whether in establishing information needs, defining its relevance for the business or identifying the necessary indicators. In a more recent study, Popovic and Jaklic (2010) reported that investment in Business Intelligence in Latin America is on the rise. Brazil alone spent US$ 251 million on the sector in 2009, with a trend toward growth in the coming years. This type of technology has long been restricted to large companies. However, research points to an increase in its use among small and medium-sized companies. A study by the Gartner Group (Gartner, 2011) observed that many companies use BI, but some still fail in extracting the benefits of this technology and have a long way to go in building an architecture that will enable them to get the best results from this type of solution. A similar conclusion was reached by Popovic and Jaklic (2010) when analyzing the impacts of BI implementation on information quality. The authors report that a gap still exists between the needs of executives and the information provided by the system.
The importance of dynamic and agile analysis of the data registered and organized via traditional transaction processing systems justifies the study of BI application and the possibility of better information use, employing a method to define and prioritize the necessary company information for executive decision-making. This gives rise to the research question for the present study: how can information architecture meet the information needs of executives using Business Intelligence (BI) tools?
JISTEM, Brazil Vol. 10, No.2,May/Aug 2013, pp. 251-270 www.jistem.fea.usp.br
The information architecture used by the company was analyzed within a framework of Business Intelligence. Architecture and technology were evaluated based on the information needs of executives, identified through semi-structured interviews, secondary data and the suggestions of company IT analysts.
The paper is structured as follows: Sections 2, 3 and 4 address, respectively, theoretical aspects concerning information and executive decisions, information needs, and Business Intelligence. Section 5 discusses the methodological aspects of the study, while section 6 describes the case study performed. Section 7 deals with information architecture and an analysis of information needs, and section 8 contains the final considerations, limitations and challenges for future studies. This is followed by a list of references used in the study.
2 THE IMPORTANCE OF INFORMATION IN EXECUTIVE DECISIONS
The strategic management of organizations is a broad concept which, according to Wright, Kroll and Parnell (1997), refers to senior management methods for achieving results in accordance with the missions and objectives of the organization as a whole. These methods are often linked to formal plans for defining elements that serve as a guide in organizational strategy. Mintzberg, Ahlstrand and Lampel (2000) reported that most management methods are based on evaluating strengths, weaknesses, threats and opportunities, establishing goals and devising action plans.
Information is essential to planning and decision-making; however, its complexity and the speed with which it must be processed and analyzed, combined with the accelerating pace of change in the economic processes of globalization and business, has made this process increasingly critical (Porter, 1990). Cohesive information is one of the elements executives use when making decisions, requiring a basis which enables data analysis in order to generate information. Knowledge is considered an important economic resource and is created based on the ability to interpret facts, create ideas, innovate products, perceive complex relationships and solve problems (Davenport, 1998; Choo, 2004).
As well as being responsible for decision-making, an executive’s role includes disseminating, monitoring and being a spokesperson for organizational information (Mintzberg, 1972). It is on the basis of information that relationships are built and data are transformed into relevant information, allowing effective solutions to be created for the organization and society as a whole.
3 THE INFORMATION NEEDS OF EXECUTIVES
information needs, the large amounts of data stored within the systems and the need for human intervention in order to make information available.
Executives process information from a variety of internal and external sources, making decisions, formulating strategies, and distributing information both within and outside the company. This is achieved based on their own ideas as well as through internal operations, events, analyses, trends and even pressures. The key to a support system for company executives is relevant information that is delivered quickly and cohesively, enabling decisions to be made (Mintzberg, 1972) that are not only based on facts and structured information, but are also affected by factors such as affection, preferences and experiences (Simon, 1965).
Choo (2004) proposes that information not be considered as an object (resource), but rather the result of people, constituting meaning through messages and insinuations, since it resides not in artifacts (systems, spreadsheets, documents), but in the minds of people. Hence, there are three basic steps to obtain and use information: a) information
needs: represent cognitive gaps that prevent people from progressing and cause
uncertainty. In this respect, determining these needs should not only consider the
question ‘what do we need to know?’, but also ‘why do we need to know?’, ‘what is the issue in question?’, ‘what do we already know?’, ‘what can we expectto find’ and ‘how will this help?’; b) search for information: after identifying the need, based on determining the possible sources, select which sources to use, locating or contacting and interacting with the sources. Choosing and searching for information is influenced by the amount of time, effort, cost required for interaction, complexity and environment; c)
using information: how an individual uses the information selected: contextual
development, understanding a particular situation, knowing how and what to do, gathering facts, confirming another piece of information, forecasting future events, motivating or sustaining personal involvement, developing and improving relationships and personal accomplishment. People can choose to suppress these needs, avoiding problems and declining to search for information. On the other hand, they can also opt to seek information, understand it and use it, carrying out their roles.
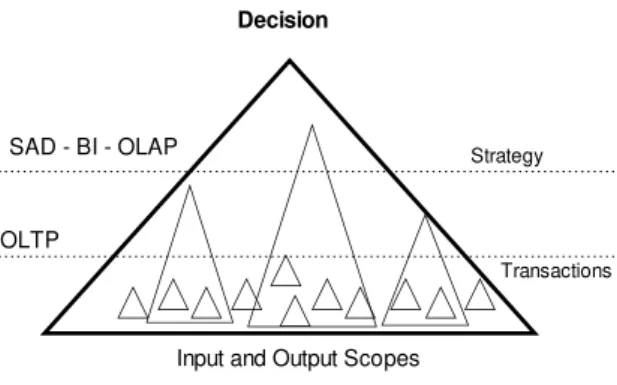
JISTEM, Brazil Vol. 10, No.2,May/Aug 2013, pp. 251-270 www.jistem.fea.usp.br Decision
SAD - BI - OLAP
OLTP
Transactions Strategy
Input and Output Scopes
Figure 1: Scope of Decisions.
Source: Thomsen (2002).
Information need is a fundamental issue in the development of a system, but other elements surrounding it must also be analyzed, such as searching and use. The development of a system should always take into account the supply of useful information to solve problems, considering its quality and quantity. The process of decision-making and information sharing for the entire organization is performed based on technological tools, the most suitable of which is called Business Intelligence (Barbieri, 2001; Thomsen, 2002; Petrini, Pozzebon; Freitas, 2004).
4 BUSINESS INTELLIGENCE (BI), TECHNOLOGY AND INFORMATION ARCHITECTURE
Business Intelligence (BI) can be conceptualized as a set of information systems that support decision making, based on other data storage, analysis and data mining technologies (Thomsen, 2002). However, there are theoretical gaps in some aspects of the concept that best defines Business Intelligence as a technological tool. Suppliers of IT solutions hold a variety of views in relation to the operational scope of these systems and their emergence. BI is geared towards obtaining information using data stored in transactional databases (Degent, 1986; Barbieri, 2001; Quandt; Fernandes, 2003). In this respect, the aim of a BI system as a technology is to create a structure that transforms data registered within the organization into information useful in decisionmaking, thereby creating value for the company (Thomsen, 2002).
Business Intelligence consists of three basic components: a) data storage, in data warehouses (DW) and data marts (DM) (Inmon, 1997; Kimball, 1998; Serra, 2002); b) analysis tools, called On Line Analytical Processing (OLAP), that allow navigation among information (Tomsen, 2002); c) data mining (data mining), which enables the extraction and discovery of patterns of information in data and specific cases (Harrison, 1998; Taurion, 1997).
The implementation of BI technology provides better results, however, when aligned with two elements. First, it should be based on the information needs of executives, enabling them to centralize information regarding the critical success factors (Rockart, 1979) of an organization. According to Petrini, Pozzebon and Freitas (2004), another important issue is that implementation should be based on supporting executive decisions, that is, on information relevant to the business and indicators created in accordance with strategic objectives. Barbieri (2002) suggests that BI also incorporate balanced scorecard indicators (Kaplan; Norton, 1997), vital for extracting strategic information from transaction processing systems.
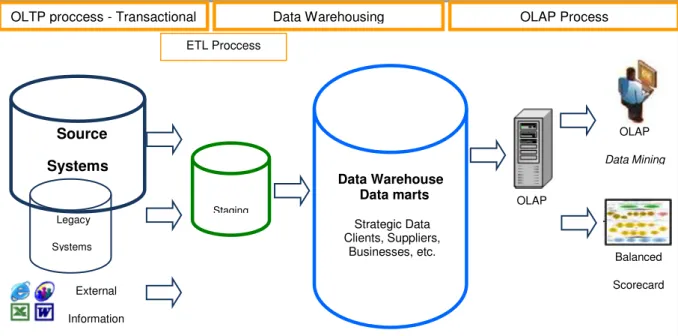
In order to achieve the desired results, it is essential that technological tools be used to construct information architecture that supports decisions. As per Tupper (2011), information architecture supports executive tasks and it supplies specific numbers, reports, access to data and forms, allowing learning to occur regarding the products and services of a company, thereby improving business performance based on facts and dimensions. Figure 2 depicts a framework with the Technologies and components of an information architecture system.
Figure 2: Framework of Information Architecture.
Source: Author, based on theoretical reference.
According to Barbieri (2001), strategic business plans (SBP), the IT plan (ITP) and balanced scorecard (BSC) must be aligned. Business Intelligence (BI) technology should provide the data required for the plans and indicators of the BSC as the core technology, since it defines the structures of information needs that can be stored in the
Data Warehouse
Data marts
Staging Legacy
Systems
External Information
OLAP
OLAP Data Mining
Balanced Scorecard
OLTP proccess - Transactional Data Warehousing OLAP Process
ETL Proccess
Strategic Data Clients, Suppliers,
Businesses, etc.
Source
JISTEM, Brazil Vol. 10, No.2,May/Aug 2013, pp. 251-270 www.jistem.fea.usp.br
system. The SBP has been considered an administrative technique that creates awareness of certain elements among the entire organization: strengths, weaknesses, goals, targets, threats and opportunities, among others (Rezende, 2002). The ITP, on the other hand, refers to the need for strategic, tactical and operational structuring of “IT and its resources: hardware, software, telecommunications systems, data and
information management” (Rezende, 2002, p. 20).
Construction of an information architecture system should follow a gradual
process of analysis and development, based on what Inmon (1997) calls the “data warehousing process”. This allows the use of a database stage for extracting,
transforming and loading data (ETL process). Data warehousing can be performed
using source systems, either the organization’s own integrated system or external
systems, such as: electronic spreadsheets, workflow systems and information obtained online.
5 RESEARCH METHODOLOGY
Research was conducted using a case study, the method recommended in order to understand phenomena and their contexts in the stages of development. This strategy is generally applied in studies investigating a contemporary phenomenon within its actual social context and in what ways boundaries between the phenomenon and social context are not clearly defined (Yin, 2001). In addition, a set of systematic and rational activities was used to achieve objectives, evaluating and correcting errors. Data were collected from multiple sources, primarily via in-person semi-structured interviews (the questionnaire applied is presented in Annex I), analysis of information needs, a variety of documents and comparison with information systems.
The case study was based on the relationship between the following factors: the research question, extent of control of researchers and time of the phenomena studied. The study was developed based on the relationship between Business Intelligence (BI) technology and the information architecture capable of satisfying information needs for decision making by executives. Research was conducted in three stages. The first phase, Research preparation, was conceptual in nature. This involved defining the theoretical foundation to be used, the theme (information architecture and Business Intelligence) and objective of the study. The definition of the subject was related to the choice of theoretical approaches for the investigation: determining a basic area for the bibliographic review, defining the research problem and justifying the study.
The second stage was that of Research Planning and included conceptual and practical elements, aimed at establishing conceptual relationships in relation to theoretical aspects and methodology. A schedule was drawn up by analyzing IT literature, information needs, information architecture and BI and its technological components. A research protocol was compiled, in which variables were grouped into: organizational context, planning of IT resources, human resources and information needs.
information required for information architecture. With respect to data analysis, each interview lasted approximately seventy minutes (average duration). Transcribing each interview took on average three and a half hours. Execution was divided into steps, aimed at collecting primary and secondary data to construct the proposed result.
a. Interviews with Business Managers: focusing on obtaining important information regarding how executives perceived the company under study in relation to information technology, information systems and human resources (people). A total of seven business executives were interviewed, from different areas of the organization. Interviews were numbered and classified, with only some excerpts from the transcriptions presented in this study. During this process, the information needs of executives were also identified, serving as a basis in analyzing whether these were met
by the organization’s existing information architecture system.
b. Interviews with IT Analysts: these interviews were conducted in order to compare the perception of company IT analysts regarding information technology, information systems and information needs against those of the executives. A total of six IT analysts were surveyed, who catered to the organization's business departments. Interviews were numbered and classified, with only some excerpts from the transcriptions presented in this study. The IT analysts provided support in analyses of existing secondary data, assisting in the understanding of the data models and systems in operation;
c. Study of the Company Business: important in order to associate business processes with analytical solutions and information needs. In the specific case studied, this step proved to be significant in the analysis of the company context, containing different businesses. Understanding of the business was achieved by studying secondary data, cross-referenced against interviews and with the support of IT analysts (interviewees);
d. Study of Information Architecture Capabilities in Meeting Information Needs: achieved by analyzing the architecture and information from source systems. Source systems are the sources of registered data that were used to construct the
organization’s information architecture system. Among the data analyzed, the following are found: configuration information, databases, documentation on strategic plans and system reports, obtained from company management.
JISTEM, Brazil Vol. 10, No.2,May/Aug 2013, pp. 251-270 www.jistem.fea.usp.br
6 CASE STUDY
This section discusses the organization under study and describes the collection and analysis of primary and secondary data.
6.1 The Organization Under Study
The case study was conducted in an organization that operates a variety of businesses in the service sector. It consists of four companies that represent the Rio Grande do Sul business sector, with activities geared towards promoting and developing the economy of that state and Brazil as a whole. The first company operates within the education and technological services industries, the second in the social arena, the third promotes integration between universities and businesses and the fourth carries out services in the fields of economic research, industrial certification and other services catering to industries. This organization was selected because it has an integrated system with a single database for most operational applications, and its information architecture was in the implementation phase, using BI.
6.2 Primary Data
Primary data were gathered through interviews. This section briefly describes the analysis of these data, in accordance with the sections of the research instrument. The content of interviews was evaluated and high, average and low values were assigned to classify variables. High, average and low levels were recorded in studies by Reich and Benbasat (1996) and Audy and Brodbeck (2203), with levels in the present study attributed by the researchers based on content analysis of the interviews. The analyses presented were grouped, that is, they represent summaries of interviews with business executives and IT analysts. Several contradictions emerge from the analyses, and are remarked on when this occurs.
6.2.1 Organizational Context
The assessment of the organizational context aimed to obtain a general overview in relation to the use of IT and how executives perceived the position of this department within the organization. This section provides a description of variables such as the
focus of the organization’s IT department and receptiveness to new technologies, in
order to determine the perception of the interviewees regarding these variables.
According to the analysis performed and the interviews conducted, the focus of the IT area is that of providing operational support for business. Evaluations of the interviews indicated concern regarding the strategic use of information. For example, we identified a need to create a platform of more detailed information, enabling better relationships with clients and the use of existing databases to add value.
The organizational context assessment found that interviewees perceived the capability of meeting informational needs at operational level (corporate) as high. Fulfillment of these needs at the final product level (in areas associated with management) was perceived as average, with improvement needed. There is a clear need for the use of tools to improve the strategic fulfillment of information needs, as demonstrated by an excerpt from one of the interviews:
be made available, meaning these areas lack fast access to this data (Entrevista 005, 2004, p.1)
6.2.2 Planning for IT Resources
This section addresses the perception of interviewees concerning planning and investment for resources related to technological aspects, including: hardware, software, telecommunications systems, management of data and operating systems.
The organization adopts a single planning methodology for all the companies that make up the System, with a centralized IT department. Differences were observed with respect to system development. A certain maturity was highlighted in resource planning, since it has been carried out in line with this methodology for several years by most of the companies.
6.2.3 Human Resources
In relation to human resources, we evaluated issues such as professional IT qualifications, training of system users, participation in ITP and SBP and effective knowledge of the business among IT professionals. Regarding the qualification and training of IT professionals, most of the interviewees attributed high levels. This point
was also emphasized for planning of the organization’s IT area. Knowledge of the
business among IT professionals was considered average.
6.2.4 Information Needs
The information needs of executives were studied based on the concept of Critical Success Factors - CSF (Rockart, 1979), analyzing whether these were provided
by the organization’s current transaction processing systems. Information needs were investigated through interviews with company executives and IT analysts and the analysis of documents, systems in use and database models.
It was found that measurement of indicators via transaction processing systems was only partially achieved and that some were not integrated into the corporate systems. For example, some indicators are entered manually and measured through electronic spreadsheets. One interviewee emphasized the need for systematic control of indicators using IT tools, specifically Business Intelligence (BI):
We are currently developing a tool to monitor the metrics. At operational level we have tools with these characteristics, but we feel they can be enhanced, improved. We understand that Business Intelligence tools, for example, exhibit components that meet these needs (Entrevista 006, 006, 2004, p. 6-7).
With respect to the existence of specific systems for obtaining strategic information, most interviewees cited BI tools. BI has been gradually implemented within the organization, initially in specific areas where its implementation could be assessed and modifications recommended for specific solutions. Decision support systems, data warehousing, data mining and balanced scorecards were cited as tools for indicator analysis.
JISTEM, Brazil Vol. 10, No.2,May/Aug 2013, pp. 251-270 www.jistem.fea.usp.br Chart 1 Main Information Needs
Subject Information Brief Description Inf.(1) Source
Cost Control
Revenue generated by marketing agents
Percentage of revenue generated by marketing agents for other Units.
Y IS (2)
Education Technical Man-hours Number of man-hours spent on technical and technological services.
Y IS
Interviews Education Placement Rate Percentage of graduates inserted into the
labor market
N BSC (3)
Strategic Recurring Revenue Rate of Committed Recurring Revenue Y BSC Strategic Projects and actions Number of projects and actions that
ensure quality and innovation in Technological Services.
Y Interviews
Strategic Projects and Partnerships
Number of projects and partnerships established and maintained with other organizations.
Y IS
Strategic Joint projects Number of projects involving more than one Unit
Y BSC IS Strategic Brand Recognition Perception of the general public (media,
companies and potential clients) regarding the brand.
N BSC
Strategic Operating Results Growth capacity calculated by the difference between current income less current expenditure.
Y BSC
Client Profile
Perceived value of the service provided
Estimated perceived benefit by the companies serviced.
N BSC
Client Profile
Special service for contributors
Indicator design plan including number of visits, priority service and price differences according to size and demand.
N BSC Interviews Client Profile Client satisfaction with Professional education
Rate of client satisfaction with Professional Education
N BSC
Client Profile
Satisfaction with Technological and Technical Services.
Rate of client satisfaction with technical and technological services.
N BSC
Services to Society
Number of individuals benefitted
Number of direct beneficiaries of social responsibility initiatives
Y BSC
Services to Society
Percentage of
investments in social initiatives
Expenditure on social initiatives in relation to the revenue budget.
Y BSC
Source: Authors.
(1) Inf. : Indicates whether the information can be obtained by the organization’s current systems;
(2) IS – Integrated System, automates the operational processes of organization units.
It is important to underscore that the items presented in Chart 1 represent the main needs among all of those identified. These indicators may consist of other indicators in the form of calculations. A total of 170 key indicators were identified, with a variety of sources and formulas, classified by subject into 9 proposed data marts (DM). Two main causes were cited in relation to difficulties obtaining information and performance indicators: transaction processing systems not containing the information and the profile of information use. In other words, the executives do not yet have a culture of using analytical tools, representing a challenge for the organization.
6.3 Secondary Data
The secondary data in this research were the study of company business and its source systems.
6.3.1 Study of the Company Business:
A Study of the Company Business was conducted in order to relate business processes with analytical solutions and information needs, and involved an analysis of systems and system models, cross-referenced against interviews and supported by IT analysts.
The operational structure of the company provides services in the following areas: social, education, technology, international relations and foreign trade, agribusiness, business expansion and incentive, infrastructure, competitiveness, economic research and studies, legal consultancy, the environment and sustainable development, support for micro and small industries and labor relations.
One of the companies in the organization uses the BSC tool (Kaplan; NORTON, 1997) as part of its strategic planning. The methodology has been in place for approximately two and a half years and enables planning to be measured using objectives, indicators and targets. It also allows communication planning for the entire company via a strategy map. The method is currently under development in another company within the group. However, the existing information architecture does not yet provide access to these metrics in BI tools. They are measured separately, as confirmed in interviews with both company executives and IT analysts.
6.3.2 Study of the Source Systems
The companies are interconnected by an Integrated Management System, referred to as the IMS in this study. It consists of several modules that provide most of the transaction controls needed for process management. The IMS modules were developed internally by organization employees, in accordance with the specific needs of each area. They are maintained according to demand in the business areas and carry out specific functions, including: accounts payable, accounts receivable, tax control, inventory control, accounting and cost control. All the systems are integrated into a single database.
The role of the main system modules is summarized in Chart 2, together with the
type of support the system provides to the organization, indicated by: ‘O’, for operational support, ‘M’, for management support and ‘S’ for strategic support.
Strategic support systems are capable of providing information that can be
JISTEM, Brazil Vol. 10, No.2,May/Aug 2013, pp. 251-270 www.jistem.fea.usp.br Chart 2: Main IMS Modules.
Module Brief Description Support
Health Agenda
Allows appointment scheduling for healthcare professionals, controls medical charts, refers services to suppliers and maintains records of leave.
O
Scheduling Manages spaces administered by the Gated Community System, Exhibition Center and Theater. Performs
scheduling, rental and quoting for spaces and services in the Mobile Units and areas of the Sporting Centers
O, M
Revenue Controls operations responsible for monitoring payments from institutional funds, identifying late payments, and forecasting amounts receivable. Controls installments related to transactions following audit visits. Controls direct and indirect revenue.
O, M, S
Corporate Records
Services all the companies, recording information pertaining to industries within Rio Grande do Sul, products, raw
material and performance markets. Also contains data on individuals and legal entities such as suppliers, clients, associations, unions and federations.
O, M
Accounts Payable
Enables the preparation, control and execution of payments to suppliers, comprising the following modules: maintaining a record of suppliers and bank details, maintenance of payment documents, forecasted payments, payment control reports, reports of payments made to suppliers, as well as accounting.
O, M, S
Accounts Receivable
Operates the records of agreements between the organization and client companies, for payments with installments by employees in the units. Manages billing documents, as well as overdue, maturing and defaulted payments
O, M, S
Inventory Control
Maintains records of the physical and financial inventories of products in the business units, issues inventory statements and calculates the average cost of merchandise, as well as recording accounting operations.
O, M
Asset Control Registration and control of the inclusion and handling of all assets and property, managing processes related to definite equity write-off, enabling the registration of changes or additions to assets.
O
Tax Control Performs bookkeeping and tax control operations, consisting of: Input and Output records, Inventory Records, Calculation Records, Voluntary Disclosure, Tax files (GIA, DIRF and GPS). Enables the registration of tax documents, calculation of tax debits and credit and issuing invoices.
O, M
Bidding and Purchasing
Enables a Bidding Process for purchases, controls the receipt of proposals for supply, issues Purchase Orders and monitors and records negotiations with suppliers. Issues operational and management reports.
O, M
Marketing Maintains clients records; classification of customers by market segment,; preparation and monitoring of initiatives and campaigns.
Action Plan Allows the planning of expenditure, performance and
strategic positioning of units and management. It is currently being adapted to balanced scorecard use.
O, M, S
Accountability Gathers accounting information in all activity centers. The information is sent to other systems, serving as a basis for accounting and cost control.
O, M
ISS – Integrated School System
System composed of six modules aimed at addressing the specificities of administration in Operating Units within the education sector.
O, M, S
Training System
Maintains a record of scheduled and completed training. Tabulates quantitative information (times and amounts) for the forecasted budget against actual results.
O, M, S
Source: Authors.
Remarks: Compiled based on Strategic IT Planning (ITP) and analyses of interviews, secondary documents and system manuals.
7 Analysis of Organizational Information Architecture
Based on the research phases previously described, the organization has taken steps to define its information architecture using technological components of Business Intelligence. The following section contains a description of the architecture and the analysis regarding the fulfillment of information needs.
The organization designed nine data marts (DM) which, once fully “loaded” with the relevant information, will form the corporate data warehouse (DW) (KIMBALL, 1998). Implementation is underway using dimensional models, storing tables based on facts and dimensions. The following data marts were designed:
1) Strategic information: provides information on the strategic performance of different units within the organization, such as: monthly performance reports (strategic indicators); margin indicators for organizational managers and detailed information regarding organizational units;
2) Sales Analysis: provides information such as the average ticket for business units; information regarding the division of sales (counter; card; check; company agreements); time comparisons (previous month, last month of the year); progress (through graphs); participation by branches and employees (clerks and managers); participation by suppliers and products in sales;
3) Client Profile: provides information regarding loyalty programs and promotional campaigns, customer segmentation (by category, age range, gender, socioeconomic profile and occupation, among other criteria); will allow market basket analysis (product mix vs. ticket level);
4) Human Resources: supplies information that facilitates the sizing of teams (total number for the company and by area), redistribution of personnel by shift and performance analysis in business areas;
JISTEM, Brazil Vol. 10, No.2,May/Aug 2013, pp. 251-270 www.jistem.fea.usp.br
6) Cost Management: supplies information on the administration of operating expenses (fixed and variable) for companies and business units.
7) Educational Services: reports on the loyalty programs for students; participation of contributing companies; promotional campaigns for courses; customer segmentation and correlation (correlation of courses for students/clients);
8) Technical Services: technical, laboratory and workshop services provided to clients;
9) Social Services: services provided to society (education, health, leisure, dentistry and disease prevention services).
The basic structure of the main database tables developed to hold the data marts is presented in Chart 3, with the relevant classification.
Chart 3: Description of the multidimensional tables designed.
Table Main Functions Fact /
Dimension Student Enables the registration and control of student
records.
Controls loyalty programs, classification, study levels and occupation.
Dimension
Campaign Maintains a history of marketing campaigns, recording the effectiveness and return on each campaign.
Maintains a history of social initiatives.
Dimension
Client Enables the registration and control of customer records.
Controls loyalty programs, classification, study levels and occupation.
Dimension
Corporate Controls the history of organizational structure. Enables sub-classification by holding, region, zone and neighborhood.
Dimension
Expenditure Maintains a history of all types of company expenditure.
Dimension
Distribution Allows the control and distribution of meal vouchers through the Distribution and Assembly Center.
Allows the control and distribution of products by warehouses.
Dimension
Inventory Maintains a history of inventory control for products in the business units.
Dimension
manufacturer Maintains records of product manufacturers. Dimension Branches Enables the monitoring of branches of company
units (business units, drugstores, operating and educational units, Finance units).
Allows differentiation by type, capacity, status and location.
Dimension
Supplier Maintains a history of product suppliers. Dimension Personnel Maintains a history of employee profiles for the
organization (all levels).
Geography Maintains a record of the locations of all company units.
Enables localization by country, state, city, neighborhood and zip code.
Dimension
Partners Maintains a history of partner organizations and institutions, including universities, the
government, companies and non-governmental organizations.
Dimension
Product Maintains a history of products, product departments, product groups and subgroups, recording all product-related information. Records product classes and the classification history of products.
Dimension
Time Maintains a history of data scaled by time, such as year, semester, quarter, month, week, day.
Allows time-based comparison.
Dimension
Type of Receipt
Allows differentiation between types of payment receipts for sales and purchases. Associates forms of payment (cash, card, company agreements and others).
Dimension
Shifts Monitors shifts to keep a record of sales history.
Enables analyses regarding sales “peaks" on a
given day.
Dimension
Campaigns Maintains a record of marketing campaigns and students enrolling.
Fact
Citizenship Maintains a record of citizenship initiatives carried out by the company and organizations responsible for services to society.
Fact
Accounting Maintains a history of accounting records. Fact Billing Records the billing history for all companies
within the organization.
Fact
Enrollments Maintains a history of student enrollments for the organizations providing services in the education area.
Fact
Payments Records payments made and received. Fact Source: Authors.
The information architecture is gradual and consists of three basic BI technology components: storage, analysis and mining. With respect to storage components, the model includes dimension tables based on the concepts of facts and dimensions, using data marts and gradual data warehousing (Kimball, 1998).
JISTEM, Brazil Vol. 10, No.2,May/Aug 2013, pp. 251-270 www.jistem.fea.usp.br
In regard to mining tools, the information architecture system will include data mining applications enabling searches for relationships between the information stored on databases (DMs and DWs) and patterns discovered in information that supports business decision making. This component is not yet in use and, as such, a more extensive analysis is not possible.
Based on an assessment of the information architecture, and cross-referencing against interviewee responses, it is evident that the system satisfies the proposed theoretical requirements presented in the theoretical framework of this study, with most components of the framework found in the literature present in the system.
On the other hand, the information needs identified were only partially met. Although the organization has already partially implemented information architecture, the strategic use of information was considered low, a fact evident in the responses of interviewees. This indicates a need for greater development of the architecture in order to align the information obtained in the process with strategic organizational objectives. The outcome of this study is similar to that reported by Popovic and Jaklic (2010) in that a gap exists between the needs of executives and the information they receive, particularly from a strategic standpoint. It was observed that most of the information
needed is present in the organization’s transaction processing system, but it is not yet used analytically via OLAP tools. Moreover, the interviewees reported that not all the required information is delivered quickly and cohesively and not all the executives have a culture of using this information effectively to generate new opportunities.
The information architecture was found to be well-structured, but progress is needed with respect to meeting the existing information requirements. Furthermore, we believe that in addition to improvements in technological development and the information provided by the architecture, the cultural issue in relation to strategic use of this information should be addressed within the organization.
8 FINAL CONSIDERATIONS
BI technology supports the structuring of information, delivering it rapidly and cohesively so that personnel may use it to improve business performance. In the present study, tools were analyzed in relation to the fulfillment of executive’s information needs, from a theoretical and practical perspective. The information architecture of an organization provides a means of constant connection with its clients, suppliers and partners, and should be geared towards strategic management.
The strategic management process can be supported by BI technology through architecture of information that should integrate and centralize different data sources, whether internal or external. The construction of information architecture performed in this study led to the conclusion that BI tools can be important in providing business executives with the necessary information.
We believe that the objective of the study was accomplished through analysis of the information architecture and comparison against the information needs of executives, identifying a number of gaps for the organization. A long-term assessment is needed to determine whether effective use of BI technologies in the organization will indeed result in strategic improvements in performance or the creation of new business.
Limitations were present with regard to the qualitative nature of the study, since conclusions cannot be generalized. The case study conducted provided greater depth; however, the practical conclusions cannot be generalized for other organizations, serving only as context for research. An additional limitation was that the study came to a close prior to complete implementation of the information architecture system. Thus, it was not possible to evaluate all the outcomes, although some areas had already shown good results.
It is suggested that future studies conduct research and analysis focusing on the effective results of implementing BI technology, determining whether this brings real benefits to company performance and allows the creation of new business or changes in existing business. Another challenge would be to analyze companies that have already adopted BI, ascertaining whether the method of constructing the architecture was based on the information needs of executives.
REFERENCES
Audy, J. N; Brodbeck, A. F. (2003). Sistemas de Informação: Planejamento e Alinhamento Estratégico nas Organizações. Porto Alegre: Bookman.
Barbieri, C. (2001). BI – Business Intelligence: Modelagem e Tecnologia. Rio de Janeiro: Axcel Books.
Choo, C. W. (2004). Preenchendo as Lacunas Cognitivas: Como as Pessoas Processam Informações. in DAVENPORT, T. H.; MARCHAND, D.; A. DICKSON, T. Dominando a Gestão da Informação. Porto Alegre: Bookman.
Davenport, T. H. (1998). Ecologia da Informação: Por Que Só a Tecnologia Não Basta para o Sucesso da Informação. São Paulo: Futura, 1998.
Degent, R. J. (1986). A importância Estratégica e o Funcionamento do Serviço de Inteligência Empresarial. Revista de Administração de Empresas, v. 26, n. 1, p.77-83.FULD, L. (2011). The New Competitor Intelligence. New York: Wiley, 1995, pp. 417-436.
Gartner, Group. Key Issues for Analytics, Business Intelligence and Performance Management, 2011. Disponível em: < http://www.gartner.com/technology/it-glossary/business-intelligence.jsp>. Acesso em: 20/01/2012.
Harrison, T. H. (1998). Intranet Data Warehouse. São Paulo: Berkeley, 1998.
IDC. (2011). IDC Brasil divulga panorama do mercado de BI na América Latina. Disponível em: <http://www.idclatin.com>. Acesso em: 06/06/2011.
Inmon, W. H. (1997). Como Construir o Data Warehouse. Rio de Janeiro: Campus.
Inmon, W. H.; Terderman, R. H.; Imhoff, C. (2001). Data Warehousing: Como Transformar Informações em Oportunidades de Negócios. São Paulo: Berkeley.
JISTEM, Brazil Vol. 10, No.2,May/Aug 2013, pp. 251-270 www.jistem.fea.usp.br
Kimball, R. (1998). Data Warehouse Toolkit: Técnicas para Construção de Data Warehouses Dimensionais. São Paulo: Makron Books.
Mintzberg, H. (1972). The Myths of MIS. California Management Review, pp. 92-97.
Mintzberg, H; Ahlstrand, B; Lampel, J. (2000). Safári de Estratégia. Porto Alegre: Bookman.
Petrini, M.; Freitas, M. T.; Pozzebon, M. (2006). Inteligência de Negócios ou Inteligência Competitiva? Noivo Neurótico, Noiva Nervosa. In: Anais do 28º ENANPAD, Salvador - BA.
Petrini, M.; Pozzebon, M.; Freitas, M. T. (2004). Qual é o Papel da Inteligência de Negócios (BI) nos Países em Desenvolvimento? Um Panorama das Empresas Brasileiras. In: Anais do 28º ENANPAD, Curitiba - PN.
Popovic, A.; Jaklic, J. (2010) Benefits of Business Intelligence System Implementation: an Empirical Analysis of the Impact of BI System Maturity on Information Quality. European, Mediterranean & Middle Eastern Conference on Information Systems .
Porter, M. E. (1990). Vantagem Competitiva. Rio de Janeiro: Campus.
Quandt, C. O.; Fernandes, A. C. C. B. (2003). Aplicação do Conceito de Inteligência Competitiva e seu Impacto no Processo Estratégico em Organizações do Terceiro Setor. In: Anais do 27º ENANPAD, Atibaia - SP.
Reich, B. H.; Benbasat, I. (1996). Measuring the Linkage between Business and Information Technology Objectives. MIS Quarterly, p. 55-81.
Rezende, D. A. (2002). Tecnologia da Informação Integrada à Inteligência Empresarial: alinhamento estratégico e análise prática nas organizações. São Paulo: Atlas.
Rockart, J. F. (1979). Chief Executives Define Their Own Data Needs. Harvard Business Review. 57(3), pp. 81-93.
Serra, L. (2002). A Essência do Business Intelligence. São Paulo: Berkeley.
Simon, H. (1965). Comportamento Administrativo. Rio de Janeiro: USAID.
Taurion, C. (1997). Data Warehouse: Estado da Arte e Estado da Prática. Developers’ Magazine, Rio de Janeiro, n.6, p.10-11, fevereiro.
Thomsen, E. (2002). OLAP: Construindo Sistemas de Informações Multidimensionais. Rio de Janeiro: Campus.
Tupper, C. D. (2011). Data Architecture: From Zen to Reality. Burlington-EUA: Elsevier.
Venkatraman, N.; Henderson, J. C. (2004). Plataformas de Negócios para o Século XXI. in DAVENPORT, T. H.; MARCHAND, D.; A. DICKSON, T. Dominando a Gestão da Informação. Porto Alegre: Bookman.
Wright, P.; Kroll, M. J.; Parnell, J. (1997). Strategic Management: Concepts. 4th ed. Prentice-Hall.
Yin, R. K. (2001). Estudo de Caso – Planejamento e Métodos. 2 ed. Porto Alegre: Bookman.
ANNEX I
Semi-Structured Questionnaire used for the Interviews No. Questions – Organizational Context
OC-1 What is the focus of the IT area in the organization (operational, strategic)?
OC-2 What is your perception in relation to receptiveness regarding new information technologies (is there resistance or not)?
OC-3 In your opinion, is there adequate proximity between management, IT professionals and information users? Why?
OC-4 In general, how do you perceive the alignment between IT and the business strategy of your organization?
OC-5 How do you perceive the complexity of an IT department in meeting the needs of a variety of organizations with different needs?
OC-6 What is your perception of the integration issue, where information systems are used by more than one company?
OC-7 What is your opinion regarding the fulfillment of information needs within the business areas?
No. Questions – Planning of Information Technology
IT-1 How are the IT Resources of the organization planned in accordance with the needs of the different areas / Business Units?
IT-2 How do IT Resources receive investments within the organization?
No. Questions - People
PEO-1 Are personnel in the IT department qualified and trained to meet the needs of your area and the company?
PEO-2 Are system users trained/skilled in using the systems, according to your area?
PEO-3 Do system users and executives from the different areas participate in the planning and design of the systems?
PEO-4 Do executives from the different areas participate in planning for the IT department?
PEO-5 Do IT personnel have knowledge of the business for the area in which they operate? How are they trained?
No. Questions - Information Needs
IN-1 What are the main indicators or strategic information needs of your business?
IN-2 Do the current Information Systems allow access to and control of these indicators?
IN-3 Are there specific systems that can be used to obtain this information?
IN-4 What are the main problems with obtaining this information using the current systems?
IN-5 Where (documents, reports, systems) would it be most appropriate to search for these metrics?
IN-6 How frequently (monthly, weekly, fortnightly) are these indicators monitored?
IN-7 How frequently (monthly, weekly, fortnightly) are these indicators revised and reformulated?
REMARKS:
a) The questions are not restrictive and the script (open-ended) allows for questions that are not included.
b) The script was used to guide the interviews, taking into account the approach and fluency of interviewees;
c) The interviews were recorded, with the authorization of interviewees, and transcribed for subsequent data analysis;