R. Cont. Fin. • USP • São Paulo • v. 19 • n. 46 • p. 86 - 107 • janeiro/abril 2008
CORPORATE INTEREST RATE RISK MANAGEMENT WITH
DERIVATIVES IN AUSTRALIA: EMPIRICAL RESULTS*
LUIZ AUGUSTO FERREIRA CARNEIRO Professor Doutor do Departamento de Contabilidade e
Atuária da Faculdade de Economia, Administração e Contabilidade da Universidade de São Paulo – Campus Capital
E-mail: luiz.carneiro@fi pecafi .org
ABSTRACT
Financial and insurance theories explain that large widely-held corporations manage corporate risks if doing so is cost-ective to reduce frictional costs such as taxes, agency costs and financial distress costs. A large number of previous empirical studies, most in the U.S., have tested the hypotheses underlying corporate risk management with financial derivative instruments. In order to quantify corporate hedge demand, most previous studies have used the ratio of principal notional amount of derivatives to company size, although they recognize that company size is not an appropriate proxy for financial risk. This paper analyzes the interest-rate-risk hedge demand by Australian companies, measured through the ratio of principal notional amount of interest rate derivatives to interest-rate-risk-bearing liabilities. Modern panel data methods are used, with two panel data sets from 1998 to 2003 (1102 and 465 observations, respectively). Detailed information about interest-rate-risk exposures was available after manual data collection from financial annual reports, which was only possible due to specific reporting requirements in Australian accounting standards. Regarding the analysis of the extent of hedge, our measurement of interest-rate-risk exposures generates some significant results di erent from those found in previous studies. For example, this study shows that total leverage (total debt ratio) is not significantly important to interest-rate-risk hedge demand and that, instead, this demand is related to the specific risk exposure in the interest bearing part of the firm’s liabilities. This study finds significant relations of interest-rate-risk hedge to company size, floating-interest-rate debt ratio, annual log returns, and company industry type (utilities and non-banking financial institutions).
Keywords: Interest rate risk management. Derivatives, Hedging IFRS. Panel-data estimation. JEL classification: C13, C23, G32, N27.
MICHAEL SHERRIS BA, MBA, FIAA, FIA, FSA School of Actuarial Studies
University of New South Wales – Sydney – Austrália E-mail: [email protected]
Recebido em 15.02.2008 • Aceito em 03.03.2008
* Este artigo foi apresentado na Conferência Anual da American Risk and Insurance Association – ARIA, em Washington, agosto de 2006.
RCF-46-USP_A7-Corporate.indd 86
R. Cont. Fin. • USP • São Paulo • v. 19 • n. 46 • p. 86 - 107 • janeiro/abril 2008
1 INTRODUCTION
The relative importance of corporate interest-rate-risk management has been analysed by previous studies in the United States and in Australia. Bodnar et al. (1998 [9]) show the results from a survey of financial risk manage-ment by U.S. non-financial firms. About 50% of the firms in the survey state that they use derivatives. Among de-rivative users, 83% use dede-rivatives to hedge for eign ex-change risk, 76% use derivatives to hedge interest rate risk and 56% use derivatives to hedge commodity price risk. Therefore, the survey indicates that corporate foreign-ex-change-risk hedging in the United States is relatively more important. However, a survey by Benson and Oliver (2004 [4]) shows that interest-rate-risk hedging is relatively more important to non-financial compa nies in Australia. In their survey, 76% of the respondents use derivatives. Among the respondents, 63% use derivatives to hedge interest rate risk, 58% use deriva tives to hedge foreign exchange risk and 29% use derivatives to hedge commodity price risk. In fact, the relative greater importance of interest rate risk in Aus tralia must be one of the reasons why Austra-lian accounting standards require companies to report this risk with more detail.
Bartram (2001 [2]) points out the importance of inter-est rate risk management for non-financial corporations. He argues that interest rate risk has direct e ects on financial assets and liabilities but that there are also indirect e ects on the value of real assets and projects. However, the fact that financial firms have a larger proportion of non-financial assets in their balance sheets makes it more di cult for them to match financial assets and liabilities, in order to achieve complete immunization. Therefore, this study recognises the importance of the interest rate risk management of non-financial companies through the risk con trol of interest-rate-bearing liabilities.
This paper analyzes the corporate demand for interest-rate-risk management in Australia.We show that previous studies have faced data limitations in order to measure relevant variables. For example, due to limitations in the information available in financial reporting, most previous studies were not able to quan tify firms’ financial risk expo-sures. In consequence, the usual dependent variable used to measure the extent of financial hedging is the ratio of principal notional amount of derivatives to firm size. Most previous studies explicitly recognise the limitations of us-ing this variable, but no better variable was available under the accounting standards in force at the time the data was generated. Therefore, this study builds on previous studies in the sense that it is able to measure the interest-rate-risk exposures of non-financial Australian companies.
Since 1997 Australian accounting standards require detailed reporting of compa nies’ interest-rate-risk expo-sures. According to the reporting rules in force since 1997, Australian companies are required to report the value of interest-rate-risk exposures and the extent to which these exposures are hedged with derivative financial instruments. Therefore, a manual collection of this detailed information makes it possible to measure the extent of interest-rate-risk hedging with the ra tio of principal notional amount of derivatives to total interest-rate-risk-bearing liabilities. As far as we are aware, this is the first empirical study to measure the risk exposure of corporate interest-rate-risk-bearing liabilities. This has impor tant implications to the empirical results, as shown in the following sections.
The two data sets used in this study cover respectively 1102 and 465 observa tions from 1998 to 2003. The first data set is used in a probit model to analyse the corporate decision to hedge interest rate risk. As in many previous studies, the binary dependent variable is equal to 1 if the company hedges with interest-rate derivatives and equal to 0 if otherwise. The empirical results are similar to those in previous studies, finding a significant importance of com-pany size to the decision to hedge with derivatives. The second data set is used to analyse the extent of hedging1.
The analysis is done with different model specifications and by comparing the results of using two different depen-dent variables: 1) the ratio of principal notional amount of interest-rate derivatives to company size, which is the de-pendent variable used in previous studies; and 2) the ratio of principal notional amount of interest-rate derivatives to total interest-rate-risk-bearing li abilities.
The results show how some estimates are very differ-ent depending on the de penddiffer-ent variable used. For exam-ple, when the dependent variable is the ratio of principal notional amount of derivatives to company size the re-sults show a significance of leverage, which is a common result in previous results using this dependent variable (for example, see Samant (1996 [46]). However, leverage is not significant if the dependent variable is the ratio of the principal notional amount of derivatives to inter-est-rate-risk-bearing liabilities. In this case, it is possible to notice the significant importance of the proportion of floating-interest-rate risk debt. Finally, the paper con-cludes that future research will benefit from more detailed hedging reporting due to the recent changes implement-ed by the International Financial Reporting System (IFRS), whose hedging reporting re quirements became operative in January 2005.
1 We assume that firms hedge interest rate risk when they use derivatives to switchthe interest rate of their future interest payments from floating to fixed.
RCF-46-USP_A7-Corporate.indd 87
R. Cont. Fin. • USP • São Paulo • v. 19 • n. 46 • p. 86 - 107 • janeiro/abril 2008
2 THEORETICAL MOTIVATIONS FOR CORPORATE
RISK MANAGEMENT WITH DERIVA TIVES
For perfect, frictionless market assumptions hedging decisions have been shown to be irrelevant to the share-holders of the firm that hedges the risk. However the theo-retical assumptions under which hedging is irrelevant do not hold in prac tice and real world hedging decisions add value to a firm under more realistic market assumptions. By relaxing the theoretical assumptions, hedging becomes important in the risk and capital management of the firm.
The classic paper of Modigliani and Miller (1958 [40] and 1963 [41]) showed that under conditions of perfect capital markets, and some other conditions2, the fi nancial
decisions of a firm are irrelevant in the sense that they do not change the total value of the firm. This follows from the fact that shareholders can reverse engineer the financing decisions of the firm on their own account at fair market prices. Corporate risk management with derivatives is part of the financial deci sions of the firm, so it is also irrelevant under these conditions.
The problem of asymmetric information is approached by Mayers and Majluf (1984 [37]) in a model in which managers of the firm know more about the firm’s value than potential investors. The model assumes no taxes, transaction costs or other capital market imperfections. It shows that in some cases management, if it acts on the behalf of existent shareholders, will not issue shares even if it means giving up a good investment opportu-nity (a positive-NPV project). That happens because the cost to existent shareholders of issuing shares at a cheap price may be higher than the return of the investment opportunity. Therefore, their model predicts that firms would prefer debt to equity if they need exter nal funds because debt issue will not make the stock price to fall. Thus, a firm with good financial slack (large amount of cash or marketable securities, or the ability to issue risk-free debt) would undertake any positive-NPV projects, but companies facing financial distress would eventually pass up some profitable in vestment opportunities. May-ers and Majluf (1984 [37]) suggest that firms can build up financial slack by restricting dividends when investment expenditures are low.
Stulz (1984 [50]) points out the role of risk aversion of managers to explain cor porate hedging. Stulz states that managers decide the hedging policy of the firm, but not shareholders. It is assumed that managers choose policies that maximize their expected lifetime utility given their compensation contract and their ex pectation of the ac-tions shareholders or other potential investors can take to decrease their expected utility. Unlike outside stockhold-ers, managers may not be able to fully diversify since they may hold a relatively large portion of their wealth in the
firm’s stock. Thus, risk averse managers will tend to en-gage the firm in a more active hedging policy.
Smith and Stulz (1985[49]) show that value-maximiz-ing firms will hedge for three reasons: (1) taxes, (2) costs of financial distress, and (3) managerial risk aver sion. If corporate tax expenses are a convex function of taxable income, then, by Jensen’s inequality, hedging can reduce the variability of taxable income and the expected value of taxes. Smith and Stulz state that hedging can mitigate costs of financial distress by reducing expected transac-tion costs of bankruptcy. Also, firms may gain from in-creasing the price of new debt by including contractual provisions (convenants) in bond issues, which guarantee potential bondholders that firms will hedge after the sale of debt. Finally, hedging can increase firm value by reduc-ing the compensation required by managers to bear their nondi versifiable claims on the firm. However, hedging will increase firm value only if it is cost-effective.
Breeden and Viswanathan (1998 [11]) and DeMarzo and Duffe (1995 [16]) argue that managers may hedge so as to protect their reputation as good professionals, which is assessed by the job market based on their firms’ perfor-mance.
Froot et al. (1993 [23]) also suggest that firms can avoid having to pass up profitable investment opportuni-ties through reducing variability of cash flow with financial hedging. Their rationale is that market imperfections make ex ternal financing more costly than financing with internal funds. Additionally, the marginal cost of external financing increases with the amount already raised externally. They argue that a shortfall in cash may be costly to the firm not only because of expensive outside financing, but also because of some decrease in investment. Because of the diminishing marginal returns of investment, it is necessary to reduce the level of investment in order to compensate for the more expensive external financing, whose marginal costs increase with the quantity of outside money raised. Therefore, hedging can increase the value of the firm by reducing variability in cash flows.
Schrand and Unal (1998[48]) approach the multiple sources of risk which are bundled together in a single as-set or liability and which affect the distribution of firms’ cash flows. For example, one single asset can be subject to many risks such as: input and output price risk; foreign ex-change rate risk; interest rate risk; credit risk; liquidity risk; market risk; regulatory risk; political risk; com petition risk etc. However, firms can reallocate these risks using cash market or derivative instruments. Risk reallocation is desir-able because firms have a com petitive advantage in bearing risks related to their activities (core-business risk) but have
2 Other conditions are: individuals have equal access to the capital market; ho mogeneous expectations and information is costless to both investors and firms; andinvestment strategies of firms are given.
RCF-46-USP_A7-Corporate.indd 88
R. Cont. Fin. • USP • São Paulo • v. 19 • n. 46 • p. 86 - 107 • janeiro/abril 2008 no competitive advantage in bearing most financial risks
(homogeneous risk). Schrand and Unal define coordinated risk management as the process of simultaneously increas-ing core-business risk and decreasincreas-ing homogeneous risk to achieve or maintain a target total risk level. They provide empirical evidence of this happening in the savings and
loan industry by examining firms which con verted from mutual to stock ownership structure. Their findings indi-cate that firms may use hedging not only for risk reduc-tion, but also for reaching a risk allocation that represents the most favourable risk-return trade-off.
3 INTEREST RATE SWAPS
The theories above explain that cash-flow volatility is costly for the firm because of capital market imperfections. However, in the specific case of hedging interest risk with swaps, hedging can also be explained because it can lower the cost of debt financing.
Visvanathan (1998 [53]) discusses many theories that explain the use of interest rate swaps. The assumption is that companies prefer long-term fixed-rate debt, but in-terest rates for this type of debt are very high. Therefore, companies borrow short-term (floating-rate) debt and then use interest rate swaps to create “synthetic” long-term fixed-rate debt.
According to Flannery (1986 [19]), Diamond (1991 [17]), and Titman (1992 [51]) borrowing firms with private informa-tion on their future performance may prefer short-term debt when they expect to obtain favourable results in the short term. In fact, if results turn out to be favourable then they will be able to benefit from lower interest loans. The asymmet-ric information problem comes from the fact that prospective creditors may believe that companies seeking fixed-rate long-term debt may be not expecting favourable results so that the interest rate should account for a higher risk of default.
Another explanation is that creditors are subject to agency costs of debt, such as the “underinvestment” and
the “risk-shifting‘” problems. Wall (1989 [54]) points out that creditors would require a higher rate to compensate the higher risk of fixed-rate long-term debt.
Therefore, in both cases above firms have an incentive to issue short-term debt and then use interest rate swaps to obtain a “synthetic” long-term fixed-rate debt which has a lower interest rate than the original long-term fixed-rate debt.
Important factors in interest rate hedging are: 1) the benefits of hedging for reducing the costs related to cash-flow volatility (expected tax costs; costs of financial distress; agency and asymmetric information costs); 2) the benefits of interest rate hedging in reducing the cost of interest ex-penses; 3) the extent of ex-ante interest rate exposure, i.e., the relative contribution of interest rate risk to total cash-flow volatility. Empirical evidence of these theories is given by Saunders (1999 [47]), for interest rate swaps. DaDalt, Gay and Nam (2002 [15]) provide empirical evidence that currency derivatives, besides interest rate derivatives, can also mitigate asymmetric information problems. They pro-vide epro-vidence that both the accuracy and consensus in mar-ket analyst’s earnings fore casts are higher for firms that use derivatives than for those that do not.
4 TESTABLE HYPOTHESES
Two different dependent variables are used to measure interest rate risk hedging activity. The first dependent vari-able is the principal notional value of interest rate deriva-tives scaled by company size, which, as stated before, has been used by most previous studies on hedging demand. The choice of this dependent vari able by previous research-ers was mainly due to the limited information required in financial reporting by accounting standards at the time pre-vious studies were written. The second dependent variable used aims to overcome this limitation and is based on the ratio of principal notional amounts of interest rate deriva-tives to total interest-rate-risk-bearing liabilities, as men-tioned above. In fact, the measurement of interest rate risk exposures being hedged was only possible due to reporting requirements existing in Australia since 1997. However, this information is not available in electronic data bases and had to be collected manually from financial reports.
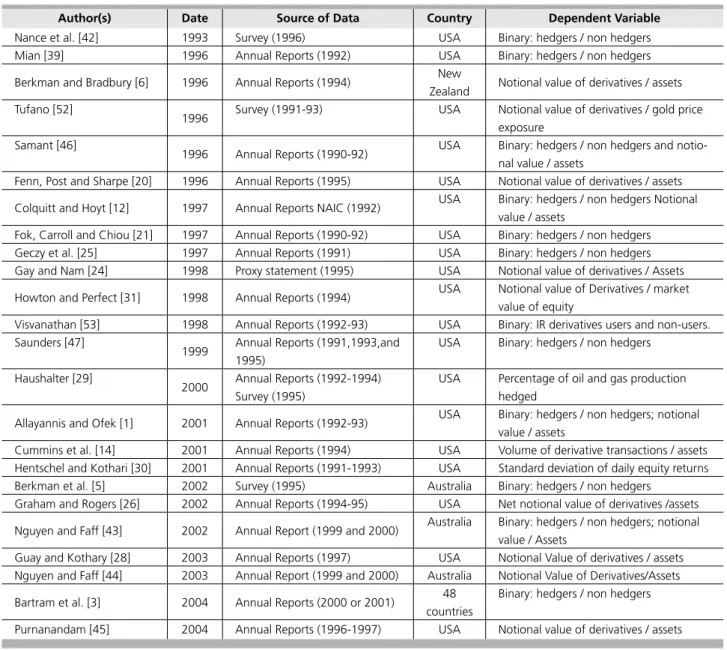
Table 1 gives details of the sample size, the company type investigated, the data source, the year the data sets refer to, the country from which companies are studied and the scope of financial instruments investigated. It can be seen that only 7 out of these 30 empirical studies were done with data sets from countries other than the United States. Regarding the demand for hedging with deriva tives, four previous studies include data from Australian companies (One of the four studies, Bartram et al. ([3] 2004), covers 48 countries including Australia). However, all of these four studies were unable to measure the risk exposures be ing hedged, so that the dependent variable used is the principal notional amount of derivatives scales by company size.
The hypotheses tested empirically in this paper can be classified into the fol lowing groups: 1) Taxes; 2) Cost of Financial Distress3; 3) Underinvestment Problem; 4)
Eco-nomies of Scale; 5) Shareholders’ value creation.
3 Includes substitutes for hedging, which can also be used to mitigate costs of financial distress
RCF-46-USP_A7-Corporate.indd 89
R. Cont. Fin. • USP • São Paulo • v. 19 • n. 46 • p. 86 - 107 • janeiro/abril 2008
Table 1 Previous Empirical Studies Hedging Demand
Author(s Year Sample size Company type Source Country Year Data Scope
Nance et al. 1993 434 Nonfinancial Survey USA 1986 Derivatives
Berkman and Bradbury
1996 244 Nonfinancial Annual Reports New
Zealand
1994 Derivatives
Fenn, Post and Sharpe
1996 384 Nonfinancial Compact
Disclosure and Compustat
USA 1994 IR derivatives
Mian 1996 169 Nonfinancial Annual Reports USA 1992 FX and IR
derivatives
Samant 1996 354 No banks or
utilities
Compact Disclosure and Compustat
USA 1990-91 IR swaps
Tufano 1996 48 Gold Mining Survey USA 1991-93 Commodity
price der. Colquitt and
Hoyt
1997 571 Life Insurers Annual reports USA 1991 or 1992
Derivatives
Fok, Carroll and Chiou
1997 331 Nonfinancial Annual Reports USA 1990-92 Derivatives
Geczy et al. 1997 372 Nonfinancial Annual Reports USA 1991 FX derivatives Gay and Nam 1998 486 Nonfinancial Swaps Monitor
Database
USA 1995 All and IR
derivatives Howton and
Perfect
1998 451 Nonfinancial Annual Reports USA 1994 All, FX and IR derivatives Visvanathan 1998 410 Nonfinancial S&P 500 reports USA 1992,
1993
IR derivatives
Saunders 1999 297-438-497 Nonfinancial Annual reports - Compustat
USA 1991, 1993,
and 1995
IR derivatives
Haushalter 2000 100 Oil & Gas Annual Reports/ Survey
USA 1992-95 Commodity
price der. Allayannis and
Ofek
2001 724 Nonfinancial Annual Reports USA 1992-93 FX
deriva-tives
Cummins 2001 1216 and
1668
Insurers Annual reports
NAIC
USA 1994 Derivatives
Hentschen and Kothary
2001 297-260-283 Nonfinancial Annual Reports/ Compustat
USA 1991, 1992,
1993
Derivatives
Berkman et al. 2002 158 Industrial and mining
Survey Australia 1995 FX, IR,
comm. price der. Graham and
Rogers
2002 442 Nonfinancial SEC’s EDGAR/
Compustat
USA 1994 or
1995
FX and IR derivatives Nguyen and Faff 2002 239-230 nonbanking Connect4 Australia
1999-2000
Derivatives
Guay and Kothary
2003 234 Nonfinancial Compustat USA 1997 FX, IR,
comm. price der. Nguyen and Faff 2003 239-230 nonbanking Connect4 Australia 1999-2000 Derivatives Bartram et al. 2004 178 in
Australia (7309)
Nonfinancial Thompson Analytics DB and Global R.
48 countries
2000 or 2001
Derivatives
Purnanandam 2004 3000 Nonfi nancial Compustat USA
1996-1997
FX and IR derivates
RCF-46-USP_A7-Corporate.indd 90
R. Cont. Fin. • USP • São Paulo • v. 19 • n. 46 • p. 86 - 107 • janeiro/abril 2008
4.1 Taxes:
The convexity of the effective tax function can create incentives for firms to hedge. However, the progressivity of corporate tax rates are not the only rea son for the convex-ity of the effective tax function. Tax preference items such as tax loss carry-forwards, investment tax credits and for-eign tax credits can also affect the convexity of the effective tax function [Graham and Smith (1999 [27])].
Therefore, there are two factors that can affect this con-vexity:
(1) The progressivity in the corporate tax rate.
(2) Tax credits (or “tax preference items”) such as tax loss carry-forwards and carry-backs, investment tax credits and foreign tax credits. Because these tax credits can only be used if companies have a suffciently large pre-tax income, companies have an incentive to hedge and increase the likelihood of being able to use their tax credits as soon as possible.
Therefore, tax issues provide the following hypothesis4
in relation to corporate hedging:
4 All hypotheses here assume “ceteris paribus”.
Hypothesis 1 (H1): The higher the convexity of the corporate ef fective tax function the higher the corporate demand for hedging.
The following proxy variables will be used to test this hypothesis in this paper:
Proxy for H1:
• Future tax benefits scaled by the book value of assets.
Companies with large amounts of future tax benefits have a motiva tion to increase the likelihood that future pre-tax income is positive, so that they can make use of their tax credits.
The following studies use proxies to measure the ef-fect of tax credits carried forward. Geczy et al. (1997 [25]), Graham and Rogers (2002 [26]), and Pur nanandam (2004 [45]) use a similar proxy, the net operating losses (NOL) scaled by the book value of assets. Nance at al. (1993 [42]), Tufano (1996 [52]), and Visvanathan (1998 [53]) scale net operating losses by firm’s market value. Two studies (Fok, Carroll and Chiou (1997 [21]) and Gay and Nam (1998 [24])) do not scale the value of net operating losses. Four other studies (Mian (1996 [39]), Berkman and Bradbury (1996 [6]), Howton and Perfect (1998 [31]), Al-layanis and Ofek (2001 [1]), and Berkman et al. (2002 [5])) use a dummy value that assumes value equal to 1 when the firm has net operating losses to be carried forward and value zero otherwise.
Nance et al. (1993 [42]) argue that the benefit of hedg-ing on expected taxes is due to the convexity of the effec-tive tax function, so that the appropriate factor for scaling tax preference items is the firm’s expected taxable income. However, proxies for expected taxable income, such as EBITDA, may assume negative value, thus generating bias. The argument here for using the book value of as sets as a scaling factor is the assumption that expected taxable
income and book value of assets should be proportional across firms. Any cross-section variation in this proportion should be small relative to the cross-section variation in future tax benefits.
Graham and Smith (1999 [27]) argue that the existence of NOL carry-forwards does increase the tax incentive to hedge for firms with expected profits. However, they also argue that NOL carry-forwards provide a disincentive to hedge in the case of company with expected losses, which could make the impact of NOL carry-forwards on the deci-sion to hedge ambiguous. Graham and Rogers (2002 [26]) also point out that existent tax credits, such as NOL carry-forwards, can be a proxy for financial distress, rather than a tax motivation to hedge.
4.2 Expected Costs of
Financial Distress Hypothesis
If hedging can reduce variability of future financial re-sults then it can also reduce the expected costs of financial distress. As explained before, these costs can be classified as both direct and indirect bankruptcy costs.
Therefore, expected costs of financial distress provide the following hypothesis in relation to corporate hedging:
RCF-46-USP_A7-Corporate.indd 91
R. Cont. Fin. • USP • São Paulo • v. 19 • n. 46 • p. 86 - 107 • janeiro/abril 2008 It is important to recognise two components of a com-pany’s expected costs of financial distress: 1) the extent of the exposure to financial risk; 2) the proba bility of adverse financial outcomes. Therefore, proxy variables used to test this hypothesis should be able to take these two compo-nents into account.
For example, if a company has a high financial leverage then the extent of its expected costs of financial distress will depend not only on the size of debt but also on the vari-ability of total debt. Although leverage is a relevant proxy for expected financial distress costs, ideally one should also be able to measure other factors that could influence these costs. In fact, some of these factors can be diffcult to mea-sure, for example: company’s risk appetite, operational risk, regulatory risk, competition risk, regulatory risk, and politi-cal risk. Also, at the empiripoliti-cal research level, it is diffcult to quantify important factors such as corre lations between as-sets and liabilities. These correlations are important to pro-vide a measure of total financial risk.
Therefore, despite the fact that financial leverage is generally accepted as a proxy for total financial risk, one
Hypothesis 2 (H2): The higher the expected costs of financial dis tress the higher the corporate demand for hedg ing.
should, where possible, quantify the original sources of financial risk and how they relate to each other. An ex-ample is the case in which a company has a “not so high” debt-to-equity ratio but there is much mismatch between assets and liabilities. In this case there is also a high expected cost of financial distress due to the high probability that the payment of liabilities will not be honoured.
The level of debt risk also has to be considered. For ins-tance, a company could have a “not so high” debt-to-eq-uity ratio but most of its debt could be very uncertain, e.g., all of the debt could be indexed to a floating interest rate. Here the probability of financial distress is high despite the fact that leverage is not so high.
Finally, one should ensure that leverage is measured be-fore the company hedges, so that it reflects the company’s ex ante financial risk. For example, in the case of insurers, leverage is affected after reinsurance is contracted, since there is a reduction in the outstanding claims reserve.
The following proxy variable will be used to test hypo-thesis 2 (H2) in paper:
Proxies for H2:
• The ratio of total liabilities to total assets (Leverage). • The ratio of current assets to current liabilities (Current Ratio). • Free cash flow (scaled by asset value).
• The ratio of financial assets to financial liabilities (Financial Ratio).
• The ratio of floating interest rate debt to total interest bearing liabilities (Float Ratio). • Earnings per share (EPS).
All previous studies use some measure of financial lever-age as a proxy for a firm’s financial distress. This study mea-sures leverage by the ratio of total liabilities to total assets, as also used by Graham and Rogers (2002 [26]), Nguyen and Faff (2002 [43]), Bartram et al. (2004 [3]), and Purnanandam (2004 [45]). Other studies use proxies such as the ratio of capital to debt or the ratio of debt to equity.
The current ratio is used as a measure of financial li-quidity and is equal to the ratio of current assets to cur-rent liabilities. It measures the firm’s ability to hon our its liabilities in the short run. This same liquidity measure was use by Nance et al. (1993 [42]), Mian (1996 [39]), Fok et al. (1997 [21]), and Nguyen and Faff (2002 [43]).
Free cash-flow is used as a proxy for financial distress/streng-th and equals distress/streng-the operational cash flow minus capital
expendi-ture and dividends. It is a measure of a firm’s liquidity after the firm has paid for everything, including investments. For exam-ple, Saunders (1999 [47]) also free cash flow to measure liqui-dity and test the asset substitution hypothesis. Some previous studies classify liquidity as a “hedging substitute”, instead of associating it directly to financial distress. This is in line with the argument by Froot, Scharfstein and Stein (1993[23]) that external financing is costlier than internal financing. Therefore, it can be argued that less liquid firms have a smaller financial buffer and should then be more likely to hedge with derivatives. However, it is only true if we observe ante liquidity. It is ex-pected that after firms hedge they may obtain a higher level of (ex-post) liquidity. Because the data used in this paper contains only ex-post liquidity, the hypothesis here is that higher liquidi-ty is related to more interest-rate-risk hedge5.
5 It is important to consider that derivatives are off-balance-sheet financial instru ments, so they do not directly affect balance-sheet accounts. For example, interest-rate-risk hedging can change the firm’s debt composition (the floating-to-fix mix) without changing the value of total debt. Therefore, with the exception of “free cash flow”, the other proxy variables for hypothesis 2 can be considered as ex-ante proxy variables.
RCF-46-USP_A7-Corporate.indd 92
R. Cont. Fin. • USP • São Paulo • v. 19 • n. 46 • p. 86 - 107 • janeiro/abril 2008 Financial reports from Australian companies provide
enough detail about finan cial assets and liabilities6. This
study also uses the ratio of financial assets to financial liabilities (Financial Ratio) to measure the firm’s financial strength. This proxy was not found in previous studies. Because interest rate is a financial risk, it makes sense to use a measure of financial strength based on financial as-sets and liabilities.
Because this study aims to analyse the corporate de-mand for interest rate hedg ing, it is important to use an explanatory variable which proxies for interest rate risk exposure. We use the ratio of floating interest rate to to-tal interest-rate-risk bearing liabilities. Graham and Rogers (2002 [26]) also use a similar explanatory variable, the sum of debt in current liabilities plus long-term floating debt, scaled by total debt.
Earnings per share (EPS) equal the net profit after tax, less outside equity in terests and preference dividends di-vided by diluted weighted number of shares
outstand-ing duroutstand-ing the year. Again, some previous studies classify dividend pay out as a “hedging substitute” item. How-ever, the hypothesis here is that a higher dividend payout decreases the chance that funds will be available to pay fixed liabilities. Dividend policy can also be a proxy for growth opportunities, but this problem is overcome with the use of a specific proxy (research and development ex-penditure – R&D).
4.3 Underinvestment Cost Hypothesis
Financially distressed firms may reject positive NPV projects because the bene fits would accrue mainly to bond-holders at the sharebond-holders’ expense. Therefore, hedging can mitigate the agency cost of underinvestment through reduction of the probability of future financial distress.
Theory indicates that the underinvestment problem is greatest for leveraged firms which have significant growth options in their investment set. This implies the following hypothesis:
6 Financial assets include for example cash, receivables, and investment accounted for using the equity method. Financial liabilities include payables and bank overdrafts and loans. Financial assets and liabilities are also classified in three categories related to interest rate: floating interest, fixed interest rate, and non-interest bearing.
Hypothesis 3 (H3): The higher the growth opportunities of the leveraged firm the higher the corporate demand for hedging.
The following proxy for growth opportunities is used:
Proxies for H3:
• Research and development expenditure (R&D) scaled by total assets.
Many previous empirical studies also use R&D ex-penses to test the underinvest ment motivation to hedge (NANCE et al., (1993 [42]), FOK et al., (1997 [21]), GEC-ZY et al., (1997 [25]), GAY; NAM, (1998 [24]), HOW-TON; PERFECT, (1998 [31]), ALLAYANNIS; OFEK, (2001 [1]), GRAHAM; ROGERS, (2002 [26]); PURNANAN-DAM, (2004 [45])). Another common proxy variable used in previous studies is the market-to-book ratio. However, while most previous studies found statisti cally significant results for R&D, most results using the mar-ket-to-book ratio were insignificant or the sign of the estimated coeffi cient was different than ex pected. One possible reason for this is the diffculty in measuring the firm’s book value, used in the market-to-book ratio cal-culation. For example, it is diffcult to value a firm’s intan-gible assets. Similarly, existing fixed assets are also dif-fcult to value unless a market for used equipment exists. For these reasons, the proxy for growth opportunities in this study is only based on R&D.
4.4 Scale Economies Hypothesis
Firm size is a proxy for many factors that impact the corporate demand for hedg ing. Yet, there is much contro-versy about the relation between these factors and firm size. For example, it is argued that even small bankruptcy costs can be suffcient to induce large firms to hedge, if the reduction in expected bankruptcy costs exceeds the costs of hedging. However, Warner (1977 [55]) finds that bank-ruptcy costs are less than proportional to firm size, so that the reductions in expected bankruptcy costs are greater for small firms, which, for this reason, should be more likely to hedge. In the case of reinsurance, Mayers and Smith (1990 [38]) argue that bankruptcy costs should have a higher im-pact on smaller firms, and that small firms are less likely to have the “specialized internal talent“ available in larger firms, so that they would tend to reinsure more. Nance et al. (1993 [42]) argue that smaller US firms are more likely to have taxable income in the progressive region of the tax schedule, again implying that they are more likely to hedge.
RCF-46-USP_A7-Corporate.indd 93
R. Cont. Fin. • USP • São Paulo • v. 19 • n. 46 • p. 86 - 107 • janeiro/abril 2008 Cummins et al. (2001 [14]) also argue that larger insurers may be more diversified and therefore would demand less additional risk management instru ments.
However, on the other side, Block and Gallagher (1986 [7]) and Booth, Smith and Stulz (1984 [10]) argue that hedging programs exhibit informational scale economies and that larger firms are more likely to hedge. Also, in the
case of derivative markets, there are significant scale econ-omies in the structure of trans action costs, implying that large firms are more likely to hedge with these in struments. Thus, despite the fact that most empirical results show a significant relation between hedging and company size, it is argued that the relation be tween hedging and firm size is theoretically undetermined.
Hypothesis 4 (H4): company size has an effect on hedging demand, although the sign of the effect is ambiguous a priori.
Proxies for H4:
• natural logarithm of company’s total book asset value
Almost all previous empirical studies also use some proxy for company size. Like many previous studies (Al-layannis and Ofek (2001 [1]), Graham and Rogers (2002 [26]), Guay and Kothary (2003 [28]), Nguyen and Faff (2003 [44]), and Bartram et al.(2004 [3])), this study uses the natural logarithm of total assets. Instead, Fok et al. (1997 [21]) and Saunders (1999 [47]) use the total value of assets to proxy company size. Most other empirical stud-ies measure company size by using the market value of equity plus the book value of debt.
4.5 Corporate Hedging and Shareholder’s Value Creation
Risk management at the firm level is only economically feasible if the increase in firm value is greater then the hed-ging costs, and if shareholders cannot benefit from a simi-lar increase in value by managing risk on their own account at a lower cost. Therefore, if firms hedge, it is expected that hedging is being used to increase firm value through reduc-tion in taxes, costs of financial distress and agency costs. Therefore, the following hypothesis is assumed:
Hypothesis 5.1 (H5.1): hedging increases the value of the firm through reduction in taxes, expected costs of financial distress and agency costs.
There are many variables that could be used to measure the increase in firm value, such as return on investment (ROI), return on assets (ROA), economic and market value added (EVA and MVA), Tobin’s Q, price-earnings ratio, and
stock price return. This study uses the annual log return in stock prices to proxy the increase in firm value. The ratio-nale is that more interest-rate-risk hedging is associated with higher annual increase in share price.
Proxy for H5.1:
• annual log return in share price.
Finally, Table 2 summarizes the hypotheses to be tes-ted and the expectes-ted esti mation results in this paper.
Table 2 Hypotheses Tested on Corporate Hedging
Explanatory Variable Hypothesis Expected Sign
Future Tax Benefit H1 (+)
Leverage H2 (+)
Financial Ratio H2 (–)
Float Ratio H2 (+)
Current Ratio H2 (–)
Free Cash Flow H2 (–)
Earnings per Share (EPS) H2 (+)
D&E H3 (+)
Ln Assets H4 (+/–)
Ln Returns H5 (+)
RCF-46-USP_A7-Corporate.indd 94
R. Cont. Fin. • USP • São Paulo • v. 19 • n. 46 • p. 86 - 107 • janeiro/abril 2008
5 PREVIOUS STUDIES AND DATA AVAILABILITY
When mentioning the previous empirical studies on interest-rate-risk hedging, it is important to take into ac-count the acac-counting standards in force at the time the studies were written. In fact, despite the substantial im-provements in hedg ing reporting, the accounting stan-dards in the U.S. in the 1990s imposed some limitations to empirical work. An important limitation was the unavail-ability of quantified financial risk exposures. With this, the principal notional amount of derivatives (scaled by com-pany size) was the most used proxy for hedging activity in previous studies. Fortunately, since 1997 the Australian accounting standards require detailed information on in-terest risk exposures of Australian corporations and on the hedging instruments used to manage these exposures. Be-cause of this, this study is able to show the improvements in empirical analysis that are possible when one is able to quantify the exposures being hedged.
Since January 2005, many countries, including Australia, have adopted the accounting standards issued by the Inter-national Accounting Standard Board (IASB). Therefore, these countries will benefit from a standardized Interna tional Fi-nancial Report System (IFRS). With regards to the fiFi-nancial reporting of derivative financial instruments, the IFRS fol-lows the developments of stan dards previously required by accounting boards in many countries, such as the Finan-cial Accounting Standard Board (FASB) in the US and the Australian Ac counting Standard Board (AASB) in Australia. Although the US did not fully adopt the IFRS in 2005, the FASB and the IASB have been working in the convergence of their accounting standards since 2002, so that the remain-ing dif ferences are expected to be overcome soon.
Most previous studies on the corporate demand for hedging with derivatives are based on reported data from US companies in the 1990s, when disclosure of derivative financial instruments became compulsory. However, the extent of informational disclosure on derivatives differed substantially in the US and in Australia until the conver-gence of accounting standards in January 2005.
In particular, since 1997 Australian companies have started to report more de tailed information about the hed-ging of interest rate risk with derivatives. An important difference from the US reporting requirements was that Australian companies had to report interest rate risk
expo-sures, measured by interest-rate risk-bearing item, besides the notional amount of derivatives used. Since 1990 the FASB had required US companies to report the notional amounts of derivatives used, but not the value of hedged items. Graham and Rogers (2002[26]) state that Current financial reporting guidelines do not require firms to disclose the underlying asset and/or liability that is being hedged with a derivative contract. Thus, most previous studies based on US companies could not measure ex-ante risk exposures directly, so that the “hedge ratio” could also not be precisely calculated. In fact, the FASB only made the reporting of financial risk exposures compulsory since December 2000, with FASB Statement No. 133.
This fact explains why most previous empirical studies on the corporate demand for hedging with derivatives by US companies were based primarily on the no tional amount of derivatives scaled by company size. In fact, this was the best proxy available for hedging activity at the time they were written. Exceptions to this are previous studies based on the commodity price hedging in the gold industry (Tufa-no (1996 [52])) and in the oil and gas industry (Haushalter (2000 [29]) and Lookman (2004 [36])), in which proxies for the hedge ratio are built based on the level of expected future production. However, for these proxies to be appro-priate, the level of production must be close to the level of sales (the sales revenue is the hedged item). Furthermore, these previous studies on commodity price risk provide results that cannot be generalized to all companies since they refer to risks specific to the gold mining and the oil and gas industries. More general results are obtained with studies on foreign exchange risk or interest risk, since they are common in all types of companies.
Table 3 shows previous studies on hedging with de-rivatives since 1993. The ta ble shows the authors’ names; the year of publication; the data source, the time range and the country from which data was collected; and the dependent vari able used in the studies. It can be seen that, with the exception of Haushalter (2000 [29]) and Lookman (2004[36]), all other previous studies used the ratio of no-tional value of derivatives to asset value as a proxy to the hedge ratio.
6 ACCOUNTING STANDARDS IN THE US
Table 4 lists the FASB Accounting Standards that affected the reporting of cor porate risk management with derivatives until the adoption of the IFRS in 2005.
The FASB Statement No. 105 was a product of the first phase on disclosure of information about financial instru-ments in the US. With this statement, in 1990 US com-panies were required to report notional principal amounts of financial instruments with off-balance-sheet risk (i.e.,
the risk of accounting loss for finan cial instruments that exceeds the amounts reported on the balance sheet) and concentrations of credit risk (e.g., the maximum amount of exposure on such fi nancial instruments should any party to the agreement fail to perform his or her duties). This standard applied primarily to swap contracts and required disclo sure of the face or contract amount and the nature and terms of the instrument.
RCF-46-USP_A7-Corporate.indd 95
R. Cont. Fin. • USP • São Paulo • v. 19 • n. 46 • p. 86 - 107 • janeiro/abril 2008
Table 3 Previous Studies on Corporate Hedging: Data and Proxies Used
Author(s) Date Source of Data Country Dependent Variable Nance et al. [42] 1993 Survey (1996) USA Binary: hedgers / non hedgers Mian [39] 1996 Annual Reports (1992) USA Binary: hedgers / non hedgers
Berkman and Bradbury [6] 1996 Annual Reports (1994) New
Zealand Notional value of derivatives / assets Tufano [52]
1996 Survey (1991-93) USA Notional value of derivatives / gold price exposure
Samant [46]
1996 Annual Reports (1990-92) USA Binary: hedgers / non hedgers and notio-nal value / assets
Fenn, Post and Sharpe [20] 1996 Annual Reports (1995) USA Notional value of derivatives / assets
Colquitt and Hoyt [12] 1997 Annual Reports NAIC (1992) USA Binary: hedgers / non hedgers Notional value / assets
Fok, Carroll and Chiou [21] 1997 Annual Reports (1990-92) USA Binary: hedgers / non hedgers Geczy et al. [25] 1997 Annual Reports (1991) USA Binary: hedgers / non hedgers Gay and Nam [24] 1998 Proxy statement (1995) USA Notional value of derivatives / Assets
Howton and Perfect [31] 1998 Annual Reports (1994) USA Notional value of Derivatives / market value of equity
Visvanathan [53] 1998 Annual Reports (1992-93) USA Binary: IR derivatives users and non-users. Saunders [47]
1999 Annual Reports (1991,1993,and 1995)
USA Binary: hedgers / non hedgers
Haushalter [29]
2000 Annual Reports (1992-1994) Survey (1995)
USA Percentage of oil and gas production hedged
Allayannis and Ofek [1] 2001 Annual Reports (1992-93) USA Binary: hedgers / non hedgers; notional value / assets
Cummins et al. [14] 2001 Annual Reports (1994) USA Volume of derivative transactions / assets Hentschel and Kothari [30] 2001 Annual Reports (1991-1993) USA Standard deviation of daily equity returns Berkman et al. [5] 2002 Survey (1995) Australia Binary: hedgers / non hedgers
Graham and Rogers [26] 2002 Annual Reports (1994-95) USA Net notional value of derivatives /assets
Nguyen and Faff [43] 2002 Annual Report (1999 and 2000) Australia Binary: hedgers / non hedgers; notional value / Assets
Guay and Kothary [28] 2003 Annual Reports (1997) USA Notional Value of derivatives / assets Nguyen and Faff [44] 2003 Annual Report (1999 and 2000) Australia Notional Value of Derivatives/Assets
Bartram et al. [3] 2004 Annual Reports (2000 or 2001) 48 countries
Binary: hedgers / non hedgers
Purnanandam [45] 2004 Annual Reports (1996-1997) USA Notional value of derivatives / assets
Table 4 FASB Statements and Hedging Reporting
FASB Statement
No.
Statement Title Issued Date Operative Date
FAS 105 Disclosure of Information about Financial Instru ments with Off-Balance-Sheet
Risk and Financial Instruments with Concentrations of Credit Risk 1990 Mar 1990 Jun FAS 107 Disclosures about Fair Value of Financial Instru ments 1991 Dec 1992 Dec
FAS 119 Disclosure about Derivative Financial Instru ments and Fair Value of Financial
Instruments 1994 Oct 1994 Dec
FAS 133 Accounting for Derivative Instruments and Hedg ing Activities 1998 Jun 1999 Jun (deferred to 2000 Jun)
FAS 138 Accounting for Certain Derivative Instruments and Certain Hedging
Activi-ties-an amendment of FASB Statement No. 133 2000 Jun 2000 Jun
FAS 149 Amendment of Statement 133 on Derivative In struments and Hedging
Activities 2003 Apr 2003 Jun
RCF-46-USP_A7-Corporate.indd 96
R. Cont. Fin. • USP • São Paulo • v. 19 • n. 46 • p. 86 - 107 • janeiro/abril 2008 Since December 1992, the FASB Statement No. 107
re-quired entities to disclose the fair value of financial instru-ments, both assets and liabilities recognized and not rec-ognized in the statement of financial position. Therefore, with this state ment the fair value of derivative financial instruments had to be reported.
However, the data sets available in the U.S. in the early 1990s imposed some lim itations on empirical analysis. Hentschel and Kothari (2001 [30] p.117) analyse the use of derivatives with a sample of US corporation from 1991 to 1993. In their conclusions they comment that Our data show the considerable limitations of the deriva-tives disclosures under the current US accounting standards. Firms do not have to disclose the sign or the magnitude of their derivative exposures, only the notional principal of their positions. (...) The crudeness of the information makes it diffcult to determine whether an individual firm is reducing or taking risks with derivatives.
Since December 1994, the FASB Statement No. 119 re-quired disclosure of amounts, nature, and terms of derivative financial instruments that were not subject to FASB State-ment No. 105 because they did not result in off-balance-sheet risk of accounting loss. It was applicable to derivative financial instruments such as futures, forwards, swaps, op-tion contracts and other financial instruments with similar characteristics. Also, for the first time this standard required a distinction to be made between financial instruments held or issued for trading purposes and financial instruments
held or issued for purposes other then trading.
We can notice from Table 3 that the first empirical studies tested the decision to hedge or not to hedge with derivatives (FRANCIS; STEPHAN, (1993 [22]); NANCE; SMITH; SMITHSON, (1993 [42]); DOLDE, (1995 [18]); WYSOCKI, (1996 [56]); MIAN, (1996 [39]); COLQUITT; HOYT, (1997 [12]); FOK; CARROLL; CHIOU, (1997 [21]); GCZY; MINTON; SCHRAND, (1997 [25]). These studies classified companies between hedgers and non-hedgers, built a binary dependent variable, and then used a probit/ logit econometric model to test the decision to hedge.
Since December 2000, FASB Statement No. 133 re-quired more detailed infor mation on the fair value of assets and liabilities involved in the corporate risk management activities. This time, disclosures applied in determining the fair value of a financial instrument, with detailed in-formation required not only for derivative instruments, but also for the hedged items. Therefore, this statement required the identification of the hedging instrument, the hedged item, the nature of the risk being hedged, and how the hedging instrument’s effectiveness in offsetting the exposure to changes in the hedged item’s fair value attributable to the hedged risk was assessed. Despite the data availability on hedged items since FASB Statement No. 133, Table 3 shows that the most recent studies in the US did not make use of this type of information. Last-ly, the FASB Statements No. 138 and 194 amended and clarified the reporting structure defined in the Statement No. 133.
Table 5 AASB Statements and Hedging Reporting
Statement No. Statement Title Issued Date Operative Date AASB 1034 (1996) Information to Be Disclosed in Financial Re ports 1996 Dec 1997 30 June AASB 1033 and AAS 33 (1996) Presentation and Disclosure of Financial Instruments 1996 Dec 1997 31 Dec AASB 1034 (1999) Financial Report Presentation and Disclosures 1999 Oct 2001 30 June AASB 1033 and AAS 33 (1999) Presentation and Disclosure of Financial Instru ments 1999 Oct 2001 Jan
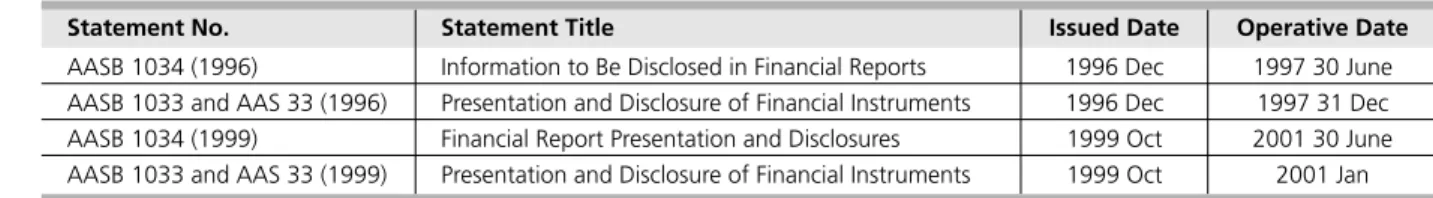
7 ACCOUNTING STANDARDS IN AUSTRALIA
Regarding the Australian reporting standards, the first requirements of finan cial reporting of derivatives instru-ments appeared in the Australian Accounting Standard 33 (AAS 33, and AASB 1033) in December 1996. The AASB 1034, also issued at that time, defined the more general requirements for the financial reports. Both AAS 33 and AASB 1034 were amended by their then new versions in 1999 (See Table 5 ).
Although AAS 33 did not require very detailed infor-mation on derivative in struments in general (if we compa-re with the equivalent compa-requicompa-rements made at that time by the FASB in the US), this accounting statement did require enough detailed information about interest rate risk expo-sures and their management with derivatives.
Since December 1997, Australian companies had to show in their annual reports their interest rate risk ex-posures and hedges by class of asset and liability. These classes are: 1) floating interest rate risk bearing; 2) fixed interest rate risk bear ing; and non-interest rate risk bearing (e.g., payments to trade creditors).
Therefore, with quantified interest rate risk exposures, by class of liability, and the corresponding notional princi-pal amounts of derivatives used, it is possible to measure ante interest rate risk exposure and the extent of ex-post hedging positions of Australian companies.
An important thing is that it was possible to first iden-tify whether companies were actually subject to interest rate risk because they had to report interest rate risk
expo-RCF-46-USP_A7-Corporate.indd 97
R. Cont. Fin. • USP • São Paulo • v. 19 • n. 46 • p. 86 - 107 • janeiro/abril 2008 sures even if they did not hedge these risks. Therefore, the classi fication of companies between hedgers and no-hedg-ers is more accurate.
Additionally, Statement AAS 33 required entities to state the objectives for holding or issuing derivative financial instruments, the context needed to un derstand those objectives, and their strategies for achieving those objectives. Therefore, this requirement made it possible
to verify whether companies were using derivatives and if their reasons for using derivatives were for hedging or trading purposes. A significant number of companies report their interest rate risk exposures together with the principal notional value of derivatives used to hedge them, which makes it possible to measure the size of hedges.
8 THE IFRS AND THE REPORTING OF HEDGING
Since 1 January 2005, the Australian equivalent of IFRS has been fully imple mented through accounting standards AASB 101-141. It is a requirement that all reporting enti-ties in Australia adopt the standards as they have replaced the previous Australian standards.
Differently from the AASB, the FASB has not adopted the IFRS at full in 2005. Instead, since 2002 the FASB and the IASB have been implementing two joint convergence projects. While significant progress towards international conver gence is expected to be made in the next few years, the volume and complexity of issues implied that many di-fferences between IFRS and the US GAAP remained beyond January 2005. However, the remaining differences in the reporting of derivatives and hedging are not substantial enough to cause any significant dis advantages between future studies that may be based on either IFRS or on the US GAAP.
For example, the IFRS provides enough detail on how to recognise (identify) and measure (quantify) financial as-sets and liabilities; derivatives (including embed ded deriva-tives); hedging instruments (derivative or non-derivative); and hedged items. Additionally, companies need to report hedging effectiveness, i.e., the de gree to which changes in fair value or cash flows attributable to a hedged risk are offset by changes in the fair value or cash flows of the hedging instrument.
Also important for future research on corporate risk management, the IFRS requires more detailed information about executives’ remuneration. Statement AASB 1046, operative since June 2004, requires companies to properly identify and quantify the following components of execu-tives’ remuneration: 1) primary benefits (cash salary, bo-nuses and profit-sharing); 2) post-employment benefits;
3) equity compensation (shares and options); 4) any other remuneration.
As far as interest rate risk hedging is concerned, state-ments IAS 39 / AASB 139 require risk identification and measurement in the following steps below:
• the portfolio of items to be hedged should be identified;
• analysis of the portfolio of items; • decision about how much to hedge; • decision about which interest rate to hedge; • designation of hedging instruments; • effectiveness analysis of the hedging;
• periodical measurement of the change in the fair value of the hedged items;
• periodical measurement of the change in the fair value of the hedging instru ments;
• identification of any hedging ineffectiveness.
It can be noticed that, in relation to the previous ac-counting standards, the IFRS provides substantial improve-ment on hedging reporting. An important point is that re-searchers will be able to have a clear idea of measurable risks faced by companies and how much of these risks are being hedged with financial or non financial instruments.
Therefore, future research will benefit from the avail-ability of “hedge ratio” of each hedged risk exposure in a given company. As shown before, the appropriate mea-surement of the “hedge ratio” is important for the robust-ness of empirical analysis of the demand for hedging, in the sense of correctly identifying which factors drive the corporate use of hedging instruments to manage different risk exposures.
Table 6 International Financial Reporting Standards
Statement No. Statement Title Issued Date Operative Date AASB 1046 Director and Executive Disclosures by Disclos ing Entities 2004 Jan 2004 30 Jun AASB 1046A Amendments to Accounting Standard AASB 1046 2004 Sept [ending] 2004 1 Jul
AASB 7 Financial Instruments: Disclosures 2005 Aug 2007 1 Jan
IAS 1 / AASB 101 Presentation of Financial Statements 2003 Dec / 2004 July 2005 1 Jan IAS 32 / AASB 132 Financial Instruments: Disclosure and Presentation 2003 Dec / 2004 July 2005 1 Jan IAS 39 / AASB 139 Financial Instruments: Recognition and Measurement 2003 Dec / 2004 July 2005 1 Jan
RCF-46-USP_A7-Corporate.indd 98
R. Cont. Fin. • USP • São Paulo • v. 19 • n. 46 • p. 86 - 107 • janeiro/abril 2008
9 THE AUSTRALIAN DATA SET ON INTEREST RATE RISK HEDGING
In order to analyse the corporate demand for interest rate risk hedging in Australia, two panel data sets are built based on financial information from S&P/ASX 300 compa-nies7, from 1998 to 2003.
The first panel data set contains financial information from 189 companies, which are classified into hedgers and non-hedgers. This data set is used to analyse the corpo-rate decision to hedge interest corpo-rate risk. The second data set contains only interest rate risk hedging companies. This data set contains observations from 78 companies, with detailed information about the interest rate risk ex-posures being hedged. In fact, this study focuses on cor-porate interest rate risk hedging because interest rate risk exposures are the only financial risk exposures that can be properly measured given the information available in the annual reports of Australian companies. Although other risks such as foreign currency risk and commodity price risk are reported, they are not reported in enough detail to be associated with the financial derivative instruments used to hedge them. On the other hand, Australian com-panies do report detailed information about their interest risk exposures and about the interest rate derivatives used. Moreover, a previous survey by Benson and Oliver (2004 [4]) shows that interest-rate-risk management is relatively more important for Australian companies than the man-agement of foreign currency and commodity price risks. A possible reason for this is that Australian companies tend to borrow money locally, so that most of the loans are in local currency.
Balance sheet data and stock price data were obtained from the ASPECT Finan cial data set and from the ASX Daily data set, provided by SIRCA8. Interest rate risk exposures
and hedging information are manually collected from an-nual reports provided by Connect49.
Some exclusions were necessary from the original data set. Judge (2003 [33]), p.19) explains that most previous
studies on hedging with derivatives restrict their analysis to the hedging activities of non-financial companies because finan cial firms are both users and providers of risk manage-ment products. However, in this study only financial insti-tutions which provide interest rate risk instruments, such as banks, are excluded from the sample, so that financial institutions that do not provide them, such as insurers, are not excluded. Other companies were also excluded be-cause there was not enough financial information about them, or because financial information was available only for a very limited number of years.
In order to create the first data set, which distinguishes companies that hedge interest rate risk from those which do not, all available annual reports from ASX 300 compa-nies were examined. After the exclusions mentioned above, the final data set comprises 189 companies. Companies are then classified as “hedgers” if they report the use of interest rate derivative instruments and as “non-hedgers” if otherwise, or if they report that they do not use inter-est rate derivatives. Therefore, out of 189 companies, 108 companies are classified as hedgers and 81 companies are classified as non-hedgers. Finally, a binary variable is cre-ated (“1” for hedgers and “0” for non-hedgers) so that it can be used in a probit regression to analyse the decision to hedge interest rate risk.
Table 7 shows the summary statistics for the data set used to analyse the corpo rate decision to use interest rate derivatives. The variables in Table 7 are proxies that potentially explain this decision.
The second data set is used to analyse the extent of interest rate hedging. It comprises of 78 hedging compa-nies compared to the 108 hedging companies in the first data set. The reason for this is that 30 hedging companies do not provide enough financial information so that inter-est rate exposures can be measured properly. Companies in this data set are able to report the value of their
inter-7 The S&P / ASX 300 index represented 91% of the Australian market at June 30, 2002. 8 Securities Industry Research Centre of Asia-Pacific (SIRCA) www.sirca.org.au
9 www.connect4.com.au. The University of New South Wales (UNSW) provides ac cess to data sets from both SIRCA and Connect4 to UNSW students and researchers. 10 “LN ASSETS” is the logarithm of assets value, which proxies for company size; “LEVERAGE” is the ratio of total liabilities to total assets; “LN RETURNS” is the annual log return in share prices; “FUTURE TAX BENEFIT” is the ratio of future tax benefits to total assets; “R&D” is the ratio of research and development expenditure to total assets; the “CUR. RATIO” is the ratio of current assets to current liabilities; “FREE CASH FLOW” is the ratio of free cash flow to total assets; and “EPS” are earnings per share.
Table 7 Summary Statistics – Hedgers and Non-Hedgers
Variable10 N Mean Median Max. Min. Skew.
Ln Assets 1102 19.471 19.884 25.900 10.030 –3.595 Leverage 1102 0.476 0.500 4.669 0.000 4.719 Ln Returns 1102 0.029 0.000 4.994 –2.940 1.013 Future Tax Benefi t 1102 0.015 0.007 0.173 0.000 2.644 R&D 1102 0.124 0.003 23.578 0.000 20.170 Cur. Ratio 1102 3.014 1.420 133.489 0.014 9.630 Free Cash Flow 1102 –0.043 –0.012 3.037 –1.558 2.307
EPS 1102 16.021 12.600 219.000 –402.000 –1.956
RCF-46-USP_A7-Corporate.indd 99
R. Cont. Fin. • USP • São Paulo • v. 19 • n. 46 • p. 86 - 107 • janeiro/abril 2008 est bearing liabilities and the principal notional amounts of interest rate derivatives used to hedge interest rate risk associated to these liabilities. In addition, all these compa-nies report a statement similar to the following:
The consolidated entity is exposed to changes in interest rates. The consol idated entity uses inte-rest rate derivative financial instruments to hedge its interest rate exposure. Derivative financial ins-truments are not held for spec ulative purposes.
This means that these companies have identified their interest risk exposures and reported the use of interest rate derivatives for hedging purposes only.
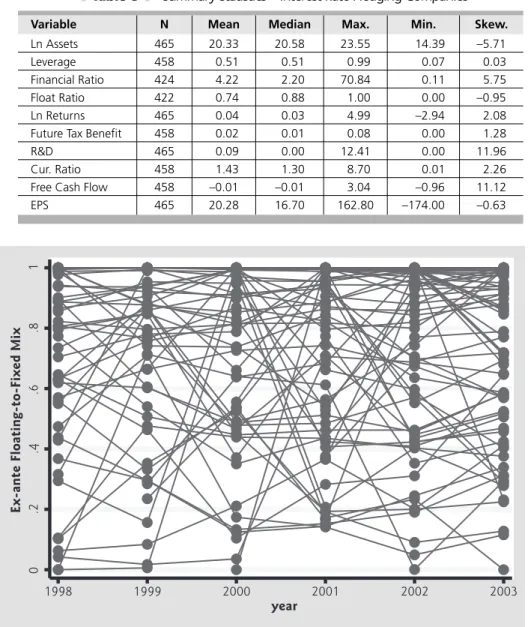
Table 8 shows summary statistics for explanatory variables in the data set of interest rate hedging compa-nies. This table contains two additional explanatory vari-ables: the financial ratio, and the float ratio. In fact,
Table 8 Summary Statistics – Interest Rate Hedging Companies
Variable N Mean Median Max. Min. Skew.
Ln Assets 465 20.33 20.58 23.55 14.39 –5.71
Leverage 458 0.51 0.51 0.99 0.07 0.03
Financial Ratio 424 4.22 2.20 70.84 0.11 5.75 Float Ratio 422 0.74 0.88 1.00 0.00 –0.95
Ln Returns 465 0.04 0.03 4.99 –2.94 2.08
Future Tax Benefi t 458 0.02 0.01 0.08 0.00 1.28
R&D 465 0.09 0.00 12.41 0.00 11.96
Cur. Ratio 458 1.43 1.30 8.70 0.01 2.26
Free Cash Flow 458 –0.01 –0.01 3.04 –0.96 11.12
EPS 465 20.28 16.70 162.80 –174.00 –0.63
information about these two variables was only available in annual reports of companies which report their interest rate risk hedging activities in detail. Australian companies have to report financial assets and liabilities in detail. In addition, companies have to report three types of debt: 1) floating-interest-rate debt; 2) fixed-interest-rate debt; and non-interest-rate-bearing debt. The financial ratio is the ratio of financial liabili ties to financial assets. The float ratio is the ratio of floating-interest-rate debt to total in-terest rate bearing liabilities. This variable measures the floating-to-fixed mix of interest bearing liabilities before any effects from interest rate derivatives. Therefore, this variable is a proxy for ex-ante interest-rate-risk exposure.
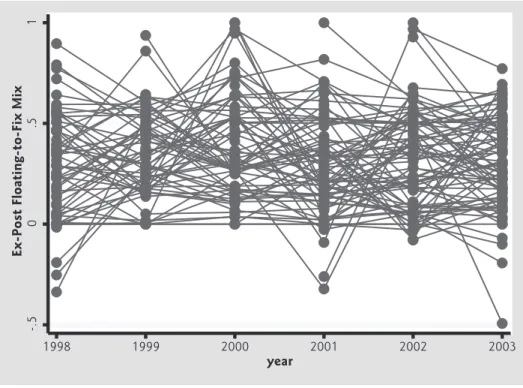
The available data set makes it possible to observe the floating-to-fixed mix of interest-rate-risk-bearing li-abilities both before and after hedging with interest rate derivatives. Figure 1 shows the float ratio before hedg-ing (ex-ante floathedg-ing-to-fix mix) from 1998 to 2003. It can
0
.2
.4
.6
.8
1
Ex-ante Floating-to-Fixed Mix
1998 1999 2000 2001 2002 2003
year
Figure 1 Floating-to-Fixed Mix Before Hedging
RCF-46-USP_A7-Corporate.indd 100
R. Cont. Fin. • USP • São Paulo • v. 19 • n. 46 • p. 86 - 107 • janeiro/abril 2008
-.5
0
.5
1
Ex-Post Floating-to-Fix Mix
1998 1999 2000 2001 2002 2003
year
Figure 2 Floating-to-Fixed Mix After Hedging
be noticed that in all years this ratio is spread between 0 and 1, despite some concentration between 0.4 and 1. How ever, Figure 2 shows an important effect of inter-est-rate-risk hedging on this floating-to-fixed mix. Figure 2 shows that after hedging the floating-to-fixed mix is very concentrated between 0 and 0.5. Moreover, it also shows that this mix does not vary much within companies from year to year. An important conclu sion is that companies use interest-rate derivatives to continuously adjust their target floating-to-fixed mixes. Empirical results in this pa-per show that the ex-ante floating-to-fixed mix is one of the very significant variables explaining the corporate de-mand for interest-rate-risk hedging.
Table 8 also shows that interest rate hedging companies have on average a float ratio of 0.74, which means that on av-erage 74% of their interest bearing liabilities are indexed to a floating interest rate. A median float ratio of 0.88 means that 50% of the companies have a float ratio of at least 88%.
The mean leverage and the median leverage are both approximately 0.51, so that companies’s total liabilities are on average 51% of their assets. The financial ratio (financial assets to financial liabilities) is on average 4.22, but the median much lower, 2.20. Additionally, the cur-rent ratio (curcur-rent assets to curcur-rent liabilities) is on average only111.40, and its median is 1.30. Free cash flow is on
average approximately zero.
Table 8 shows that future tax benefits are on average equivalent to 2% of the company’s asset value. This is the tax benefit from tax losses, which can be car ried forward indefinitely by Australian companies. However, companies need to have positive results to make use of tax benefits. Therefore, it is expected that firms with large amounts of future tax benefits would hedge more to insure they have better chances of obtaining positive results.
11 The current ratio is an indication of the company’s ability to meet short-term debt obligations. If the current ratio is more than 2, then the company is generally consid ered to have good short-term financial strength.
10 EMPIRICAL
RESULTS
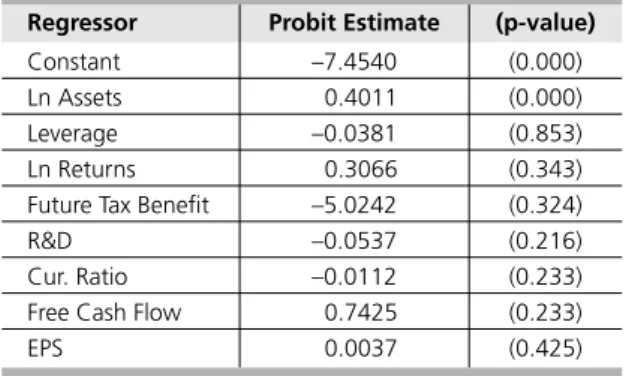
10.1 Probit Regression – The Decision to Use Interest Rate Derivatives
Table 9 shows the results for the probit regression mo-del used to analyse the cor porate decision to hedge inte-rest rate risk. In this regression analysis, however, a single year regression is used instead of a panel regression, using six-year data. The reason for this that a panel probit
re-gression assumes that the decision to hedge in each year is independent from the decision to hedge in previous year.
Since this assumption is not realistic in this case, a single year probit regression is more appropriate. Therefore, Table 9 shows the results obtained by using data from 1998 (regressions with data from other years also provide similar results).
RCF-46-USP_A7-Corporate.indd 101