Transcriptome Analysis of Maize Leaf
Systemic Symptom Infected by
Bipolaris
zeicola
Ming Liu1,2☯, Jian Gao1☯, Fuqiang Yin1,2☯, Guoshu Gong1
*, Cheng Qin3, Kunhao Ye1, Min Zhang1, Xiaofang Sun1, You Zhou1, Youju Zhang1
1College of Agricultural Science, Sichuan Agricultural University, Chengdu, China,2School of Agricultural Sciences, Xichang College, Xichang, China,3Key Laboratory of Biology and Genetic Improvement of Maize in the Southwest Region, Ministry of Agriculture; Maize Research Institute, Sichuan Agricultural University, Wenjiang, Sichuan, China
☯These authors contributed equally to this work. *[email protected]
Abstract
Bipolaris zeicolais a fungal pathogen that causes Northern corn leaf spot (NCLS), which is a serious foliar disease in maize and one of the most significant pathogens affecting global food security. Here, we report a genome-wide transcriptional profile analysis using next-generation sequencing (NGS) of maize leaf development after inoculation withB.zeicola. We performed High-Throughput Digital Gene Expression analysis to identify differentially expressed genes (DEGs) in resistant inbred Mo17 lines after infection withB.zeicolaat four successive disease development stages—CP (contact period), PP (penetration period), IP (incubation period), and DP (disease period); the expression of the genes was compared with those in a CK (mock-treatment) control. In addition, a sensitive maize line (Zheng58) was used for the comparisons with the Mo17. Among all tested genes, 466 differentially ex-pressed genes were identified in all libraries, and Kyoto Encyclopedia of Genes and Ge-nomes (KEGG) pathway analysis of these genes suggested that they are involved in many biological processes related to systemic symptom development, such as plant hormone sig-nal transduction, starch and sucrose metabolism, phenylpropanoid biosynthesis and photo-synthesis. Our systematic analysis provides comprehensive transcriptomic information regarding systemic symptom development in fungal-infected plants. This information will help in furthering our understanding of the detailed mechanisms of plant responses to fungal infection.
Introduction
Bipolaris zeicola(G. L. Stout) Shoemaker (an anamorph ofCochliobolus carbonumR. R. Nel-son) can cause Northern corn leaf spot (NCLS), a widespread foliar disease of corn (maize) and grasses in many regions of the world. NCLS favors regions that experience the appropriate
a11111
OPEN ACCESS
Citation:Liu M, Gao J, Yin F, Gong G, Qin C, Ye K, et al. (2015) Transcriptome Analysis of Maize Leaf Systemic Symptom Infected byBipolaris zeicola. PLoS ONE 10(3): e0119858. doi:10.1371/journal. pone.0119858
Academic Editor:Dawn Sywassink Luthe, Pennsylvania State University, UNITED STATES
Received:August 14, 2014
Accepted:January 16, 2015
Published:March 17, 2015
Copyright:© 2015 Liu et al. This is an open access article distributed under the terms of theCreative Commons Attribution License, which permits unrestricted use, distribution, and reproduction in any medium, provided the original author and source are credited.
Data Availability Statement:The DGE-Seq raw data files have been deposited in NCBI’s Sequence Read Archive (SRA) and are accessible through SRA Series accession number SRA197274.
Funding:Support was provided by the Sichuan Innovational Team of Industry Technology System of Modern Agriculture. The funders had no role in study design, data collection and analysis, decision to publish, or preparation of the manuscript.
amount of high rainfall, relative humidity, and temperature [1]; in particular, warm environ-ments (68 to 90 degrees Fahrenheit) with high humidity are particularly conducive to NCLS [2]. NCLS is an important factor limiting the production of corn; the harm caused is not less than that caused by Northern corn leaf blight or Southern corn leaf blight in some hilly and mountainous areas. This is true especially in Sichuan Province, China, due to the lack of resis-tant cultivars and the temperate mountain climate, which favors the disease; however, this dis-ease is not considered a serious problem for corn production in other countries.
Northern corn leaf spot (NCLS) can infect the leaf, ear, husk and sheath of corn, and major outbreaks can cause severe losses in yield and quality. NCLS begins as small, circular to oval, reddish brown to tan lesions. Over time, the lesions can become more tan to grayish tan in color and be surrounded by a lightly to darkly pigmented border. Five pathogenic races (races 0 through 4) of the fungus have been described [3]. Race 0 cannot infect maize but might cause leaf spot on grasses. Race 1, which produces a host-specific toxin (termed HC toxin), has be-come rare in the USA because modern maize hybrids are not sensitive to its toxin [3]. However, Race 1 is among the most destructive pathogens of maize and can kill susceptible maize plants at any stage of development [4], causing spotting of the leaf, sheath and the stalk and molding of the ear; this race has become more prevalent in China in recent years. Hm1, a widespread disease- resistance (DR) gene is lacking in the maize host [5]. Moreover, maize lines that are re-sistant to Race 1 are more tolerant of the HC toxin than susceptible lines [6]. In resistant host lines, Race 1 is contained at the infection site, in the same fashion that the HC-toxin-deficient Race 1 is contained in susceptible hosts. Race 2 is common in nearly all maize-growing areas but rarely causes significant damage [7]. Race 3 is considered a significant threat [8], particular-ly in Pennsylvania and North Carolina [9] and is more frequent in the Appalachian Mountains from Georgia to Pennsylvania in the United States; Race 3 has also been reported in China, Japan, Nigeria and Germany [10]. Race 4 can produce leaf spot on inbred lines with a B73 background.
Maize is a major international agricultural commodity and an important source of protein and energy for humans and livestock, as well as the many maize genome and transcriptome re-sources are available in recent years, such as the bioinformatics arm of the maize genome se-quencing project (http://www.maizesequence.org/)[11], qTeller (http://qteller.com/qteller3/ generate_figures.php) [12] and maize maize eFP Browser (http://bar.utoronto.ca/efp_maize/ cgi-bin/efpWeb.cgi) [13]. The elucidation of the genome sequences and structures of diverse organisms has led to the development of various high-throughput genome and transcriptome analytical tools. Many transcriptome profiles in plant cells have been characterized under vari-ous conditions. Transcriptome changes in virus-infected plants, includingArabidopsis[14,15], Nicotiana[16,17],Zea mays[18] andVitis vinifera[19], have been analyzed to identify the genes that constitute the expression networks underlying disease symptoms and viral propaga-tion. Although the number of analyzed gene-expression profiles in maize under various stresses continues to increase, limited information is available for profiles associated withB.
zeicolainfection.
metabolism were suppressed during pathogenesis and that metabolic pathways and plant hor-mone signal transduction were significantly enhanced during pathogen infection. Our study thus provides insights that might help to reveal the molecular mechanism of systemic symptom development in maize, which would further our understanding of plant-pathogen interactions.
Materials and Methods
Seed sterilization and experiment design
Seeds of the high-resistance maize inbred line“Mo17”and the highly sensitive maize inbred line“Zheng58”were treated with 7% hypochlorite solution for 30 min. The seeds were then washed three times with sterilized water and then sown in pots containing autoclaved soil. The resulting plants were grown in a growth chamber with a photoperiod of 14 h light/10 h dark at day/night temperatures of 25°C /23°C and a relative humidity of 75%. Control plants were maintained under the same conditions. The B12 strain ofBipolaris zeicolawas used as the inoc-ulum. First, the fungus was raised on potato dextrose agar (PDA) plates at 25°C under darkness for 5 d. Spores were washed with sterilized water, and the spore suspensions were then spread on PDA plates. The plates were incubated under the same conditions until they were covered with pathogen mycelia. Spores were collected by washing the cultures with distilled water con-taining one drop of Tween 80 per 100 mL, and the resulting suspensions were adjusted to a density of 1 × 10⁴spores per mL using a hemocytometer. All maize plants were inoculated at the six- to eight-leaf stage by spraying a suspension of conidia (approximately 3–5 mL per plant) around the leaf whorl of each plant using a pressurized sprayer. Sterilized water was used instead of the suspension as a control. The plants were covered with plastic bags to ensure high humidity, and samples were collected from each of three maize plants; these three leaves were combined to represent one replicate. Three independent replicates were collected for each sample. Infected leaves were collected at 6, 12, 24, 36, 48, 72, 96, and 120 h. Control samples were harvested from water-treated leaves incubated under the same conditions. For observa-tion of B. zeicola infecobserva-tion using scanning electron microscope, the inoculated samples were cut into 5-mm pieces and then glued onto a slide using a conductive adhesive and placed into an environmental scanning electron microscope (FEI Quanta450, Czech Republic). The sam-ples were observed under a low vacuum pressure working environment (70 Pa).
Enzyme activity assays and statistical analysis
To determination of CAT, SOD, PAL, POD, and PPO in leaves responding to Bipolaris zeicola infection, CAT activity was assayed by measuring the initial rate of H2O2disappearance using the method of Beers & Sizer (1952) [20]. The catalase assay reaction mixture contained 0.05 mM sodium phosphate buffer (pH 7.0), 20μl/mL enzyme extract and 1 mM H2O2. The
de-crease in H2O2was followed by measuring the decrease in A240, and activity [U (mg protein)
−1] was calculated using a molar absorption coefficient of 40 mM−1cm−1for H2O2. SOD
activi-ty was monitored according to a published method [21]. The reaction mixture contained 50 mM sodium phosphate buffer (pH 7.8), 100μM EDTA, 20μl/mL enzyme extract and 10 mM
pyrogallol. Enzyme activity [U (mg protein)−1] was determined by monitoring the reaction
mixture for 120 s (at 60-second intervals) at 420 nm in a spectrophotometer. PAL activity was assayed using the method of Sadisivam and Manickam (1992)[22]. Leaf material (200 mg) was homogenized in 2 ml of 25 mm borate buffer, pH 8.8, containing 2μlβ-mercaptoethanol and a
enzyme was expressed as units per mg of soluble protein. Peroxidase (POD) activity was deter-mined using the method of Upadhyaya et al. [23] in a 3.9 ml reaction mixture containing 50 mM phosphate buffer (pH 7.0), 28μl guaiacol, 100μl enzyme extract and 19μl H2O2. The
ab-sorbance was monitored at 420 nm for at least 2 min at 30-second intervals; an abab-sorbance change of 0.01 represented one unit of POD activity. Polyphenol oxidase activity (PPO) was as-sayed using 4-methylcatechol as substrate according to the method of Zauberman et al. [24]. One-half gram of fresh leaf was ground with 10 ml of 0.1 mol/l sodium phosphate buffer (pH 6.8) and 0.2 g of polyvinylpyrrolidone (PVP, insoluble). After centrifugation at 19,000 g for 20 min, the supernatant was collected and used as the crude enzyme extract. The assay reaction mixture included 1 ml of 0.1 mol/l sodium phosphate buffer (pH 6.8), 0.5 ml of 100 mmol/l 4-methylcatechol, and 0.5 ml enzyme solution. The increase in absorbance at 410 nm was re-corded for 5 min at 25°C. One unit of enzyme activity was defined as an increase of 0.01 in the absorbance at 410 nm per min per mg protein. The protein content in the enzyme extracts was determined according to Bradford [25] using bovine serum albumin (BSA) as the standard. Treatments were replicated three times, and each replicate contained 5 pots (i.e., 15 pots per treatment). Data for all enzyme arrays were statistically analyzed using excel.
Preparation of Digital Expression Libraries and Solexa sequencing
Based on the enzyme assay results and our microscope observations, we collected samples from infected leaves at selected time points from 0 h to 48 h as follows: CK (0 h) CP (12 h), PP (24 h), IP (36 h), and DP (48 h); the samples were pooled for RNA isolation and subsequent li-brary construction. Comparable control leaves were treated identically and in parallel. The Digital Gene Expression Tag Profiling Kit was used to prepare sequence tags according to the manufacturer’s protocol. We used biotin oligo(dT) magnetic beads to purify 20μg of total
RNA and obtained 6μg of mRNA. Then, double-stranded cDNA was introduced into a cDNA
fragment, which was digested using NlaIII endonuclease and these binging fragments with the sequences of CATG site and adjacent polyA tail in 3’end. After using magnetic bead precipita-tion to purify these 3’cDNA fragments, Illumina adapter 1 (GEX adapter 1) and Illumina adapter 2 (GEX adapter 2) were added to the new 5’end and the 3’end of the cDNA tag, re-spectively. The junction between Illumina adapter 1 and the CATG site was recognized by MmeI, produced fragment of 17 bp tags with adaptor 1 by cutting at downstream CATG site. These cDNA fragments represented the tag library. These single-chain molecules were bound to the Illumina sequencing chip (flow cell) and prepared for Solexa sequencing after denatur-ation. Sequencing was performed at Beijing Genomic Institution (BGI). We enriched the sam-ples for the desired fragments by PCR amplification using Phusion; the amplification
Analysis digital gene expression (DGE) tags and Identification of
differently expressed genes
Clean tags were obtained by filtering the adaptor sequences, low-quality sequences (containing ambiguous bases) were removed, and then the resulting sequences were mapped to the refer-ence genome and genes available atftp://ftp.maizesequence.org/pub/maize/release-5b[11]. Only tags with a perfect match or one mismatch were considered further, and these were anno-tated based on the reference genes. The expression level of each gene was estimated based on the frequency of clean tags and was then normalized to TPM (the number of transcripts per million clean tags)[26]; this is a standard method that is extensively used in DGE analysis. The expression level of each gene was measured using the normalized number of matched clean tags; KOG functional classification, Gene Ontology (GO) and pathway annotation and enrich-ment analyses were based on the NCBI COG (http://www.ncbi.nlm.nih.gov/COG)[27], Gene Ontology Database (http://www.geneontology.org/) [28] and the KEGG pathway (http://www. genome.jp/kegg/)[29], respectively.
Identification of genes that are differently expressed in each different
library compared with CK library
The probability that one gene G is equally expressed in two samples is calculated using the fol-lowing formula:
pðxjyÞ ¼ N2
N1
ð
xþyÞ!
x!y! 1þN2 N1 ðxþyþ1Þ
CðyyminjxÞ ¼
X
yymin
y¼0
pðyjxÞ
DðyyminjxÞ ¼
X
/yymin
pðyjxÞ
N1 and N2 denote the total number of clean tags in two compared libraries, x represented the clean tags that map to gene G in control [CK (0h)] library, y represented the clean tags that map to gene G in the differential treat libraries, including CP (12h), PP (24h), IP (36h), DP (48h) library respectively. The P value indicates the significance of prospect differences of tran-script accumulation. A combination of FDR<0.001 and the absolute value of log2-Ratio>= 1 were used as the threshold to determine the significance of differences in gene expression.
GO and pathway enrichment analysis of DEGs
We obtained the GO terms for each maize gene using Blast2GO (version 2.3.5) (http://www. blast2go.org/) based on the default parameters. Blast2GO was also used to implement a GO functional enrichment analysis of certain genes by performing Fisher's exact test with a robust FDR correction to obtain an adjusted p-value between certain test gene groups and the whole genome annotation.
Validation of DGEs using Real-time PCR
endogenous control, and cDNA was synthesized using 1μg of total RNA. The corresponding
primers were designed using Primer5 software and are listed in Table A inS1 File. The amplifi-cation programs were programmed according to the standard ABI7500 system protocol: 95°C for 30 s; 95°C for 5 s, 60°C for 30 s, 40 cycles, and followed by a thermal denaturing step to generate melt curves, which were used to verify amplification specificity. All reactions were run in triplicate, including the non-template controls. The threshold cycles (Ct) of each tested gene were averaged for triplicate reactions, and the values were normalized according to the Ct of the control products of the Actin1 gene. The statistical analysis was performed using the 2-ΔΔCTmethod.
Results
Calibration of maize leaf system development in response to
B
.
zeicola
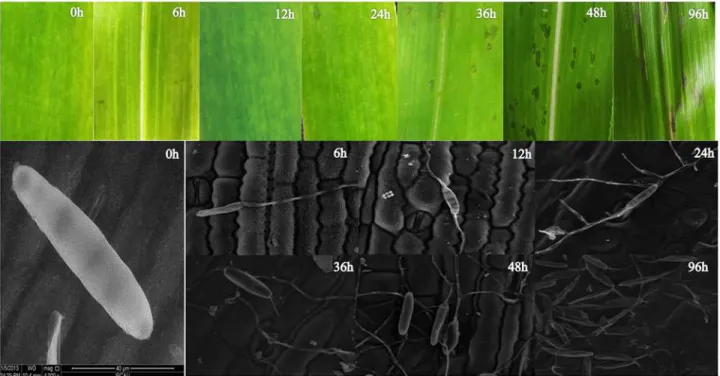
To create inventories of gene expression at successive stages in leaf development in response to B.zeicola, the physiological characteristics of maize leaves were analyzed at successive stages. The dynamic development ofB.zeicolaon maize leaves was analyzed using scanning electron microscopy (Fig. 1), and the activities of SOD, POD, PPO, CAT, and PAL were also assayed on
Fig 1. Defining the stages of maize leaf development in response toB.zeicolaand observation of the successive stages of infection byB.zeicola under a scanning electron microscope.After inoculation, conidia ofB.zeicolagerminated, and one or two germ tubes were extruded from the poles of the conidia within 2~6 h. Appressorium-like structures were observed in contact with the maize leaf periderm after 12 h, at which time most of the structures had not yet penetrated into leaf surface cells; thus, this time point represents the contact phase (CP) of the disease development. At 24 h, numerous hyphae had differentiated from the germ tubes and were highly branched, and appressoria had directly penetrated the epidermal cell walls, in most cases by developing a constricted penetration peg. However, the fungus also entered through stomata and the intercellular space. This process was considered the penetration period (PP). At 36 h after inoculation, as observed during penetration, the fungus procured host nutrients and grew numerous mycelia on or underneath infected tissues. At the same time, some peridermal cells were collapsed, and a few infected tissues exhibited water-soaked spots, indicating that the infection had developed to the incubation period (IP). After 48h, more water-soaked spots appeared and more obvious symptoms were observed, and this was identified as the end of incubation period—disease periods (DP). The process of disease period was as follows: extensive mycelia colonized on leaf
surface and the fungus appeared to have dissolved the cuticle as well as two suberized layers (arrowheads) that indicated mechanical pressure has occurred during host cell wall (HCW) penetration. At last, obvious necrosis appeared on the infected leaf at 96h after inoculation, Meanwhile, a great of new conidia reproduced on necrotic spots, it might be symptoms period (SP)
leaves infected with B. zeicola (Fig. 2). After inoculation, the conidia ofB.zeicolagerminated, and one or two germ tubes were extruded from the poles of the conidia within 2 to 6 h. Appres-sorium-like structures were observed in contact with the maize leaf periderm after 12 h, at which time most of the structures had not yet penetrated into leaf surface cells; thus, this time point represents the contact phase (CP) of the disease development. At 24 h, numerous hyphae had differentiated from the germ tubes and were highly branched, and appressoria had directly penetrated epidermal cell walls, in most cases by developing a constricted penetration peg. However, the fungus also entered through stomata and the intercellular space. This phase was considered the penetration period (PP). At 36 h after inoculation, as observed during penetra-tion, the fungus procured host nutrients and grew numerous mycelia on or underneath in-fected tissues. At the same time, some peridermal cells were collapsed, and a few inin-fected tissues exhibited water-soaked spots indicating that the infection had progressed to the
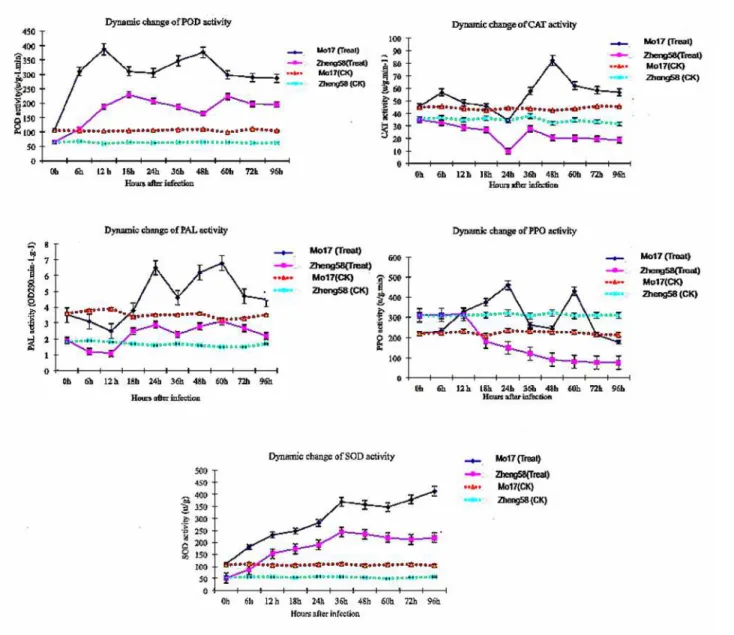
Fig 2. Determination of SOD, POD, PPO, CAT, and PAL enzyme activity in maize leaves responsive toB.zeicola.
incubation period (IP). After 48 h, more water-soaked spots appeared, and the symptoms be-came more obvious; this period was identified as the end of the incubation period (IP)-disease periods (DP). The process of disease period was as follows: extensive mycelia colonized on leaf surface and the fungus appeared to have dissolved the cuticle as well as two suberized layers (arrowheads) that indicated mechanical pressure has occurred during host cell wall (HCW) penetration. At last, obvious necrosis appeared on the infected leaf at 96h after inoculation, Meanwhile, a great of new conidia reproduced on necrotic spots, it might be symptoms period (SP) (Fig. 1).
In addition, we also measured the activity of isoenzymes of PPO, PLA, POD, SOD and CAT. The experimental results showed that the activity of these enzymes changed regularly, and the isozyme zymograms of the resistance-inbred line (Mo17) and the sensitive inbred line (Zheng 58) were different; Activities of all five enzymes in the un-inoculated Mo17 were higher than that in Zheng58. After fungal infection, the activation of SOD, PAL and POD increased remarkably, and the level of enzymes was greater in resistant Mo17 than in susceptible Zheng58. However, compared to control sample, the activities of CAT and PPO infected by fungi were much lower in infected zheng58.
Characterization of the maize leaf transcriptome response to
B
.
zeicola
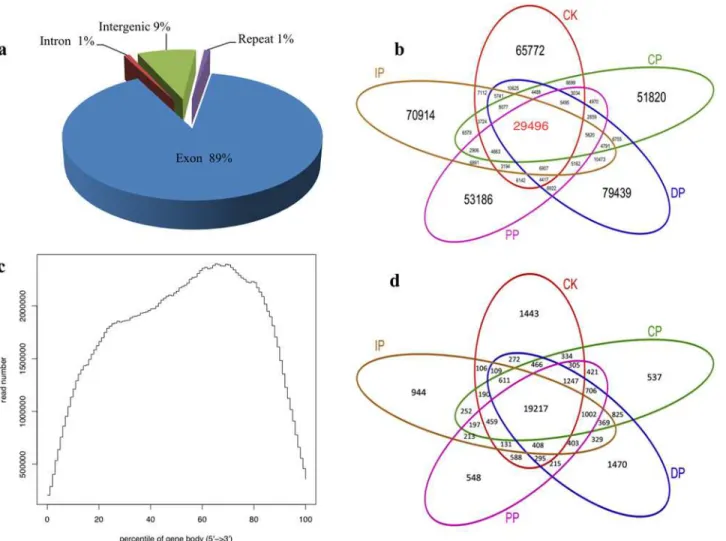
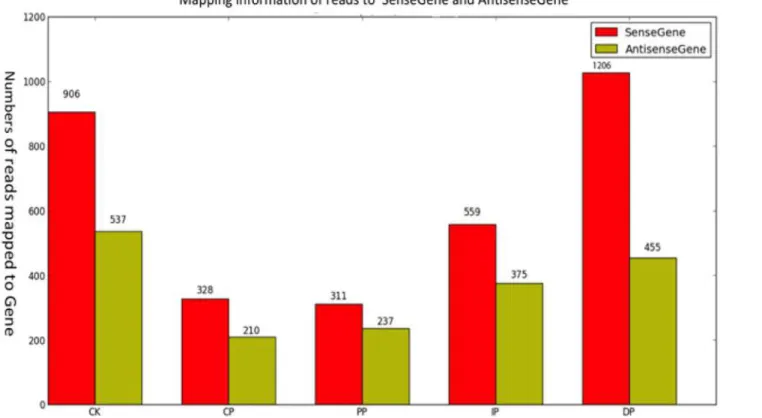
In these experiments, we studiedB.zeicola-inoculated leaves at 12 h (CP), 24 h (PP), 36 h (IP) and 48 h (DP), as well as mock-treated leaves (0 h) (CK). The development of leaves in re-sponse toB.zeicolawas investigated in the resistant inbred line Mo17 and in mock-treated (0 h) plants using Digital Gene Expression technology. To profile the leaf transcriptome, we isolated mRNA from each of the five developmental stages, sheared it, and used it to prime cDNA synthesis (mRNA-seq). We constructed libraries and analyzed sequences using the Illu-mina platform. We generated approximately 47 million high-quality reads from the five devel-opmental stages (Fig. 3b). The genic distribution of reads obtained using mRNA-seq showed that most (89%) of the reads mapped to protein-coding genes. The remaining reads were dis-tributed among introns (1%), intergenic regions (9%) and repeat sequences (1%)(Fig. 3a, Table B inS1 File). To determine the distribution of reads throughout the body of the tran-script, we visualized this trend by plotting the distribution of reads relative to cDNA ends (Fig. 3c). The mRNA-seq data reads were distributed uniformly, and a high percentage of reads mapped to genic regions. To estimate how many genes were expressed throughout leaf devel-opment in response toB.zeicola, we mapped the reads to sense genes and antisense genes and detected the following gene expression sequence from CP to DP: DP (20,687)>IP (20,161) >PP (19,765)>CP (19,754); mock-treatment (CK)(20,660). In total, 24,248 genes (74.2% of the annotated transcriptome for maize) are expressed during the development of maize leaf in-fection by B.zeicola; of these genes, 19,217 were expressed in all five sampled stages (Fig. 3d). Most reads mapped to sense genes rather than antisense genes (Fig. 4).
Dynamic reprogramming of the maize leaf transcriptome at successive
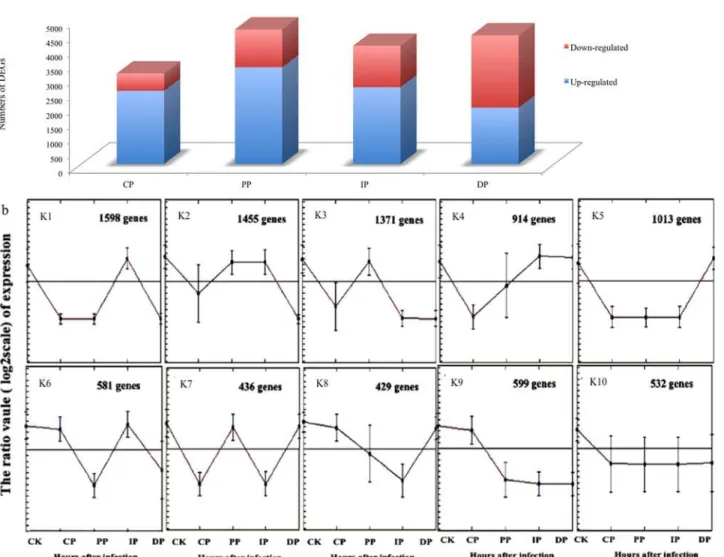
symptom stages
gene expression clusters. For example, genes that encode enzymes for oxidoreductase activity and phosphatase activity are greatly enriched in cluster K1, representing genes that are express-ed at the highest levels in the previous infection stage to combat the pathogen infection by re-ducing the toxic effect of oxides. Genes that show maximal expression during the transition infection time (clusters K2, K3 and K4) included those that are required for secondary cell wall biosynthesis and those that encode enzymes and transporters for starch metabolism, sucrose metabolism, and minor carbohydrates such as 5'-3' exonuclease activity, glucosyltransferase ac-tivity, ligase activity were also greatly enriched in this segment, suggesting that the leaf tran-scriptome undergoes substantial reprogramming as the leaf builds its cell wall to resist
pathogen attack. Finally, the leaf gene expression is nearly exclusively committed to chlorophyll synthesis and plastid-to-nucleus signal transduction; genes that are predominantly expressed at DP stages (Cluster K5) encode enzymes for tetrapyrrole biosynthesis, such as tetrapyrrole ac-tivity, suggesting that the leaf rebuilds its photosynthetic machinery to combat
pathogen infection.
Fig 3. Digital Gene Expression (DGE) analysis of the Mo17 leaf transcriptome responding toB.zeicolainfection.(a) Distribution of reads among the annotated genomic features of maize. (b) Shared and total reads among the phases of symptom development. (c) Distribution of reads among gene models and relative to transcript abundance. (d) Shared and unique reads among the phases of symptom development.
Changing inventories of transcription factors
The dynamics of transcription factor accumulation during leaf development in response to B.zeicolainfection were particularly well resolved in our DGE-seq data. We detected 1,048 transcription factors in leaf tissue; 526 were differentially expressed among the successive de-velopment stages and were categorized into 9 clusters based on hierarchical clustering and par-allel plotting (Fig. 6a, 6b, Table C inS1 File). Additionally, we clustered transcriptional regulators into three distinct developmental clusters (G1–G3), which correspond well to the clustering of three major developmental stages based on the self-organization tree algorithm (SOTA); these stages are mock-treatment (CK), transition (from CK to DP) and DP. Most of these genes (54%) were expressed at the highest levels in stages from CP to IP (G2); only 31% of these genes were expressed at the highest levels in DP (G1). An additional 15% of these genes exhibited maximal expression in mock-treatment (G3) (Fig. 7a). Members of the Activat-ing Protein (AP), CO-like and three amino acid loop extension (TALE) families of transcrip-tional regulators are highly expressed in the mock-treatment, where they most likely have a wide range of functions in leaf development, including regulating gene expression during early development and increasing the complexity of plant development and architecture. A number of transcription factors that regulate genes involved in sugar signaling and hormone signaling, including gibberellic acid (GA) and signaling factors (GATA family), were also highly express-ed in the mock-treatment, and these factors partly control overlapping processes during plant development, such as greening, flowering time, and senescence. Several NAM, ATAF, and CUC (NAC), myeloblastosi (MYB), teosinte branched 1, cycloidea and PCF (TCP), Homeodo-main leucine zipper (HD-ZIP) and Basic helix-loop-helix (bHLH) transcription factors
Fig 4. Mapping read information to sense and antisense genes at the five successive stages of symptom development.
accumulated to their highest levels during the transition from the CP to the DP infection stage, the stages during which secondary cell walls are being established and when light-mediated de-velopmental progression is perhaps strongest. Transcriptional regulators including Golden 2 (G2-like) and DNA-binding with one finger (DOF) transcription factors, which have been shown to regulate photosynthetic gene expression, were also preferentially expressed during the CP to DP transition. Interestingly, many transcription factors accumulated only during the transition stage from CK to DP, such as YABBY(YAB), M-type, Nuclear transcription factor Y (NF-YB), ETHYLENE INSENSITIVE like (EIL), E2F/DP, whirly, APR-B, BBR/BPC(BASIC PENTACYSTEINE) and HB-PHD (Homeobox-plant homeodomain). ARF (auxin response factor), B3, NF-CA, and Growth related factor (GRF) were enriched during the DP stage (Fig. 7b, 7c). These transcription factors are putatively involved in plant hormone signal trans-duction. Far-red-impaired response (FAR1), Signal Transducer and Activator of Transcription (STAT) and MCM1, AGAMOUS, DEFICIENS and SRF (MADS), intervening keratin-like and C-terminal (MIKC) are only enriched during the DP stage; these factors regulate many aspects
Fig 5. Numbers of differently expressed genes among the developmental stages of leaves infected withB.zeicolacompared with mock-treatment (Fig. 5a); functional categories and genes grouped according to developmental dynamics using the K-Means clustering algorithm (Fig. 5b).
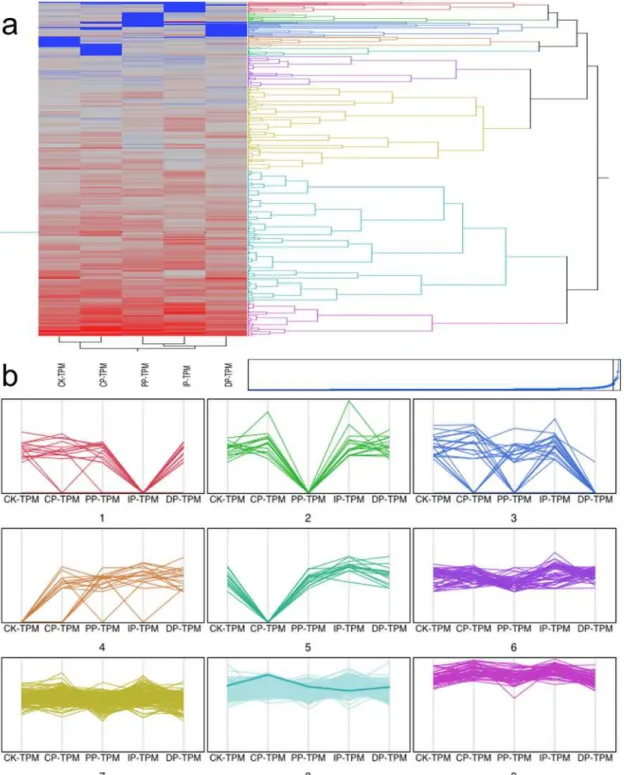
Fig 6. Cluster and parallel plot of transcription factors expressed at significantly different levels in the five successive stages of infection.(a) Clusters of transcription factors expressed at significantly different levels in the five successive stages of infection. (b) Parallel plot of transcription factors expressed at significantly different levels in the five successive stages of infection.
Fig 7. Dynamics of transcription factor accumulation profiles.(a) Dendrogram of transcription factors. Clustering of 527 transcription factors expressed at significantly different levels at the CK phase, during the transition from the CK to the DP phase, and the DP phase clustered into three lineages (G1, G2, and G3) using the self-organization tree algorithm (SOTA). (b) Distribution of transcription factor family proteins among G1, G2 and G3. (c) Distribution of transcription factor families that are expressed at different levels among the CK, CP, IP, PP and DP phases; of which, CP, IP, PP are the transition stage from CK to DP.
doi:10.1371/journal.pone.0119858.g007
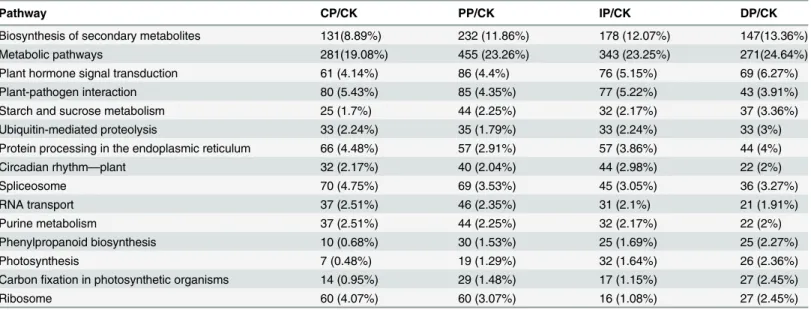
Table 1. The 15 most enriched KEGG pathways during successive symptom phases and important KEGG pathways that are influenced byB. zeicolainfection (there important KEGG pathways increased as the maize leaves developed in response toB.zeicolacompared with mock-treatment (CK).
Pathway CP/CK PP/CK IP/CK DP/CK
Biosynthesis of secondary metabolites 131(8.89%) 232 (11.86%) 178 (12.07%) 147(13.36%)
Metabolic pathways 281(19.08%) 455 (23.26%) 343 (23.25%) 271(24.64%)
Plant hormone signal transduction 61 (4.14%) 86 (4.4%) 76 (5.15%) 69 (6.27%)
Plant-pathogen interaction 80 (5.43%) 85 (4.35%) 77 (5.22%) 43 (3.91%)
Starch and sucrose metabolism 25 (1.7%) 44 (2.25%) 32 (2.17%) 37 (3.36%)
Ubiquitin-mediated proteolysis 33 (2.24%) 35 (1.79%) 33 (2.24%) 33 (3%)
Protein processing in the endoplasmic reticulum 66 (4.48%) 57 (2.91%) 57 (3.86%) 44 (4%)
Circadian rhythm—plant 32 (2.17%) 40 (2.04%) 44 (2.98%) 22 (2%)
Spliceosome 70 (4.75%) 69 (3.53%) 45 (3.05%) 36 (3.27%)
RNA transport 37 (2.51%) 46 (2.35%) 31 (2.1%) 21 (1.91%)
Purine metabolism 37 (2.51%) 44 (2.25%) 32 (2.17%) 22 (2%)
Phenylpropanoid biosynthesis 10 (0.68%) 30 (1.53%) 25 (1.69%) 25 (2.27%)
Photosynthesis 7 (0.48%) 19 (1.29%) 32 (1.64%) 26 (2.36%)
Carbonfixation in photosynthetic organisms 14 (0.95%) 29 (1.48%) 17 (1.15%) 27 (2.45%)
Ribosome 60 (4.07%) 60 (3.07%) 16 (1.08%) 27 (2.45%)
of growth, survival and differentiation in cells, including the signal transduction pathway used for light-regulated development.
Important KEGG pathways and GO annotation of genes that are
differentially expressed in response to
B
.
zeicola
Interestingly, the KEGG pathway analysis showed that seven common KEGG pathways were significantly enriched in all four of the infection stages compared with the mock-treatment. Five of these pathways were up-regulated in plants showing increasing symptoms ofB.Zeicola infection with time; these pathways were biosynthesis of secondary metabolites, plant hormone signal transduction, starch and sucrose metabolism, phenylpropanoid biosynthesis, and photo-synthesis. Most of the significantly enriched KEGG pathways were related to metabolism, and most of these metabolic pathways were enhanced byB.zeicolainfection; in contrast, pathways related to purine metabolism were inhibited at all four stages of symptom development. The important KEGG pathways influenced byB.zeicolainfection are summarized in the tables (Table 1, Table D inS1 File). GO annotation of the differentially expressed genes showed that most of the enriched genes were related to the immune system, signaling and metabolism and that they were involved in antioxidant activity and transporter activity. However, reproduction and transcriptional regulation were inhibited at all four symptom development stages (Fig. 8).
Fig 8. GO annotation of DGEs in leaf development in response toB.zeicolainfection.The Y-axis represents the percentage of targeted genes mapped by the GO term and represents the abundance of the GO term. The X-axis expresses the definition of GO terms.
Comparison of DGE Tag Data with qRT-PCR Expression Patterns
To validate our DGE data, 15 unigenes with annotations were selected for qRT-PCR analysis (Table 2). The resulting qRT-PCR data for these genes were consistent with the DGE results. For example, the qRT-PCR and DGE analyses both showed that genes encoding pathogenesis-related protein 10 (PR10), ARF (auxin response factor), chitinase chem5 (chn1) and Antifreeze protein were expressed at significantly higher levels inB.zeicola-infected maize leaves than in uninfected leaves. Similarly, four pathogen-association genes, which were enriched in four B.zeicolainfection stages, were found using DGE analysis and verified using qRT-PCR analy-sis; however, these genes (nudix hydrolase 13, nudix hydrolase 13, cytochrome b-c1 complex, and F-box protein) were expressed at lower levels compared with mock-treated samples. We further analyzed the expression of other seven pathogen-association genes that were increased at all four stages of infection byB.zeicolainfection using qRT-PCR. These seven genes were among those that were neither significantly up-regulated nor significantly down-regulated dur-ingB.zeicolainfection in the DGE dataset compared with mock-treatment, and these findings were consistent with the expression patterns obtained using qRT-PCR (Table 2).
Discussion
Northern corn leaf spot (NCLS), which is caused by the fungusB.zeicola(Nisikado) Shoemak-er (synonym =Bipolaris zeicolaNisikado and Miyake), is a serious foliar disease of maize that is distributed widely in maize-producing areas throughout the world. In China, the disease was first identified in 1972, and an outbreak in 1998 caused yield losses of between 42% and 53% of all corn products [31]. Currently, no known genes have been reported to confer complete im-munity to this disease; thus, maize breeders rely on polygenic, quantitative resistance to NCLS to create resistant strains [32]. Several genes underlying QTLs for plant disease resistance have been cloned, representing a wide range of gene functions [33]. Although substantial progress has been made in elucidating the genetic basis of plant disease immunity conditioned by 'R genes' [34–36], little is known about the genes underlying systemic symptom responses to NCLS.
Table 2. Verification of DGE-seq results by qRT-PCR.
Development Stages responsive toBipolaris zeicola
Gene ID Gene description Material CK CP PP IP DP
GRMZM2G324999 WRKY69 Zheng58(qRT-PCR) 0.858 0.467 3.324 4.716 5.224
Mo17(qRT-PCR) 0.745 0.522 4.847 4.992 6.954
Mo17(DGE) 1.3 0.01 1.46 4.72 5
GRMZM2G057116 WRKY DNA-binding protein Zheng58(qRT-PCR) 3.571 2.863 20.37 21.743 45.442
Mo17(qRT-PCR) 3.379 2.451 23.013 30.412 60.787
Mo17(DGE) 3.7 0.66 10.19 10.68 13.7
GRMZM2G060109 bZIP Zheng58(qRT-PCR) 7.239 1.681 2.202 7.632 8.171
Mo17(qRT-PCR) 7.323 1.858 4.251 8.717 30.09
Mo17(DGE) 6.31 1.98 3.54 5.55 15.87
GRMZM2G317584 EIN3 Zheng58(qRT-PCR) 11.139 10.749 12.872 20.932 25.124
Mo17(qRT-PCR) 12.856 10.894 13.031 23.124 30.911
Mo17(DGE) 15 10.98 15.81 21.31 28.31
GRMZM2G175480 bHLH Zheng58(qRT-PCR) 2.202 1.681 7.323 7.632 8.717
Mo17(qRT-PCR) 2.239 1.858 8.171 8.717 30.09
Mo17(DGE) 0.01 0.01 1.25 1.85 27.18
GRMZM2G020150 ERF Zheng58(qRT-PCR) 22.333 1.735 11.038 27.791 33.114
Mo17(qRT-PCR) 22.282 2.053 10.483 26.002 40.254
Mo17(DGE) 25.01 5.27 10.4 25.06 35.66
GRMZM2G042278 ARF Zheng58(qRT-PCR) 2.306 3.418 15.514 39.548 54.554
Mo17(qRT-PCR) 2.351 2.587 15.445 35.861 46.406
Mo17(DGE) 5.44 5.71 13.31 32.86 36.75
GRMZM2G035103 C2H2 Zheng58(qRT-PCR) 30.269 1.713 11.149 30.269 44.726
Mo17(qRT-PCR) 30.336 2.217 12.419 35.317 70.294
Mo17(DGE) 29.57 4.61 13.52 24.85 61.53
GRMZM2G043275 nudix hydrolase 13 Zheng58(qRT-PCR) 5.65 1.156 2.261 4.022 5.044
Mo17(qRT-PCR) 6.106 1.848 2.167 4.223 5.173
Mo17(DGE) 18.7 1.76 2.7 4.31 5.87
GRMZM2G112524 pathogenesis-related protein 10 Zheng58(qRT-PCR) 1.008 7.376 7.747 18.286 28.032
Mo17(qRT-PCR) 1.114 7.101 8.088 22.179 41.761
Mo17(DGE) 1.3 7.03 8.11 15.82 21.53
GRMZM2G453805 PRm 3 Zheng58(qRT-PCR) 1.196 4.027 8.478 14.483 24.197
Mo17(qRT-PCR) 1.622 4.172 9.481 16.183 32.488
Mo17(DGE) 2.475 5.021 9.043 12.585 19.856
GRMZM2G542272 Antifreeze protein Zheng58(qRT-PCR) 8.088 24.692 33.114 35.861 52.554
Mo17(qRT-PCR) 9.431 29.039 30.046 34.068 60.09
Mo17(DGE) 9.35 32.72 42.84 48.47 94.37
GRMZM2G479906 ABC transporter protein Zheng58(qRT-PCR) 28.032 1.114 1.376 8.747 18.286
Mo17(qRT-PCR) 31.761 1.008 3.481 7.747 18.088
Mo17(DGE) 25.23 1.32 3.95 4.72 10
GRMZM2G023194 Cytochrome b-c1 complex Zheng58 (qRT-PCR) 30.09 2.202 7.632 7.323 13.031
Mo17(qRT-PCR) 34.068 7.239 8.717 8.171 14.911
Mo17(DGE) 31.1 5.27 7.07 7.19 14.79
GRMZM2G154864 F-box protein Zheng58(qRT-PCR) 15.022 5.908 6.938 8.945 14.966
Mo17(qRT-PCR) 15.416 5.853 6.19 8.56 15.068
Mo17(DGE) 36.32 5.27 6.24 8.22 12.83
byB.zeicolainfection during the development of symptoms included photosynthesis, starch and sucrose metabolism and plant-pathogen interaction.
In previous studies, it was reported that genes related to photosynthesis were suppressed by pathogen infection [37]. In our study, we observed that many genes in pathways related to pho-tosynthesis, such as photosynthesis and carbon fixation in photosynthetic organisms, were up-regulated during the progression of pathogenesis (from CP to DP). Our results suggest that these pathways, especially those related to photosynthesis, might be directly responsible for maize leaf development during the response to pathogen attack. In addition, scanning electron microscopy analysis indicated thatB.zeicoladevelopment might also be correlated to the de-velopment of symptoms inB.zeicola-infected maize leaves, and enzyme assays showed that SOD, PAL and POD activities are related to varietal disease resistance.
Many genes encoding the‘plant-pathogen interaction’pathway were up-regulated during symptom development; the enzymes encoded by these genes are involved in defense-related gene induction and innate immunity, such as those that activate genes coding for the WRKY transcription factor, pathogenesis-related protein 10, and PRm 3(ChitinaseChem 5), as re-ported previously [17,38,39]. Our results showed that genes encoding WRKY69 and WRKY DNA-binding protein were up-regulated at the PP, IP, and DP stages but were down-regulated at the CP stage compared with mock-treatment; PR10 and PRm 3 were up-regulated at the CP, PP, IP, and DP stages compared with CK. These genes were increasingly up-regulated during symptom development from CP to DP. WRKY proteins belong to a transcription factor family that exhibits a special structure in plants: one or two domains containing the sequence
WRKYGQK [40], and these domains typically bind a cis-element termed a W box. A wide range of pathogens and defense hormones are activated by WRKY proteins [40]. In addition, several studies have described the role of transcription factors that contain a basic leucine zip-per domain (bZIP) [41]. The family of transcription factors containing a bZIP domain is among the largest families of transcription factors in plants; as regulated family genes, bZIP family members regulate most of the genes involved in various processes, such as abiotic stress response, seed maturation, flower development and pathogen defense [42].
Moreover, many genes in the‘plant hormone signal transduction’pathway were up-regulated during symptom development. A negative effect of auxin signaling on plant resistance to bio-trophic pathogens has recently been described [43]. Auxin regulates many processes during plant development through direct interaction with TIR1-like F-box receptor proteins [44], which, when bound to SCFTIR1, leads to the enhanced removal of members of the AUX/IAA family of transcriptional factor (TF) repressors through the SCF (Skp1–Cullin–F-box) E3-ubiquitin ligase proteasome pathway[45,46]. Thus, the degradation of AUX/IAA proteins allows the activation of Auxin Response Factors (ARFs) and the expression of auxin-responsive genes [47]. Moreover, an increasing body of evidence indicates that some plant pathogens either pro-duce auxin themselves or increase plant auxin biosynthesis upon infection to manipulate host developmental processes.
ripening, senescence, abscission, germination, cell elongation, sex determination, pathogen de-fense response, wounding, nodulation, and cell fate determination [48,49]. Control of these processes by ethylene involves the complex regulation of ethylene biosynthesis and the ability of cells to perceive and respond to the hormone in an appropriate manner. Understanding the molecular events that lead to this diversity of plant responses is essential to elucidate how this gas modulates such functions. C2H2-type zinc finger proteins play crucial roles in many meta-bolic pathways and in the stress response and defense activation in plants. Recent studies have demonstrated the importance of C2H2-type zinc finger proteins due to their putative role in re-pressing the expression of genes that encode proteins that are involved in the defense and stress response of plants. Most of these defense and stress response proteins are thought to acquire their repression activity via their ethylene-responsive element-binding factor (ERF)-associated amphiphilic repression (EAR) domain (described below). Recent studies of the C1 C2H2-type zinc finger family have suggested that these proteins play key roles in several developmental pathways and in the defense and stress response pathways of Arabidopsis. EIN3 proteins com-prise a family of novel sequence-specific DNA-binding proteins that regulate gene expression by binding directly to a primary ethylene response element (PERE); EIN3 is necessary and suf-ficient for ERF1 expression, and EIN3-overexpression can lead to the constitutive expression of ERF1 in transgenic plants, which in turn results in the activation of a variety of ethylene re-sponse genes and phenotypes. It has also been demonstrated that ERF1 can act downstream of EIN3 and all other components of the ethylene-signaling pathway. Surprisingly, we detected C2H2-type zinc finger, ERF and EIN3 in our DGE-seq data, and these data were validated using qRT-PCR; genes for these proteins increased during the infection stages and were en-riched at the DP stage.
ABC transporters constitute one of the largest protein families found in all living organisms; these transporters are driven by ATP hydrolysis and can act as exporters as well as importers. Originally identified as transporters that are involved in detoxification processes, these trans-porters might be required for organ growth, plant nutrition, plant development, plant response to abiotic stress, pathogen resistance and the interaction of plants with their environment. We detected and validated ABC transporter protein expression in our study. Characterization of TaAbc1 expression revealed that the expression of this gene was tissue-specific and could be up-regulated by biotic agents (e.g., stripe rust pathogen) and/or by abiotic stresses, such as wounding. High-fold induction was associated with the hypersensitive response (HR), which is triggered only by avirulent stripe rust pathotypes, suggesting that TaAbc1 is a rust-pathotype specific HR-mediator[50]. In our study, we found the Abc1-like family involved in the hyper-sensitive response againstB.zeicolain maize leaf.
the expression and accumulation of AFPs are controlled by developmental regulation and tran-scriptional factors that are enriched in successive pathogen infection stages.
In summary, using mRNA sequencing and analyzing the differential expression of genes during four disease induction stages, we obtained a genome-wide transcription profile for sys-temic symptom development in maize leaves infected withB.zeicola. In addition, the molecu-lar functions of some genes and their associated pathways provide insights into the molecumolecu-lar mechanisms of the maize leaf symptom development in response toB.zeicolainfection. More-over, the dynamics of transcription factor accumulation during leaf development in response toB.zeicolainfection showed that these transcription factors are likely involved in plant hor-mone signal transduction. The results obtained will facilitate further investigations of the de-tailed mechanisms of plant responses to pathogen infection.
Supporting Information
S1 File. The information of primers of differential expression genes (Table A), sequence tags (Table B), differentially expressed transcription factors (Table C) as well as summary of important KEGG pathways (Table D) along the successive development stages influ-enced byBipolaris zeicolainfection.
(XLSX)
Acknowledgments
We are grateful to all the members of our lab at Sichuan Agricultural University, thanks to Dr. Hai Lan and Moju Cao for providing the maize cultivars, from Maize Research Institute, Sich-uan Agricultural University.
Author Contributions
Conceived and designed the experiments: ML MZ GSG. Performed the experiments: ML FQY XFS YJZ YZ. Analyzed the data: JG ML GSG CQ. Contributed reagents/materials/analysis tools: KHY MZ XFS YJZ YZ. Wrote the paper: JG ML GSG.
References
1. Schenck N, Stelter T. Southern corn leaf blight development relative to temperature, moisture and fun-gicide application. Phytopathology. 1974; 64(5):619–624.
2. Sumner D, Littrell R. Influence of tillage, planting date, inoculum survival, and mixed populations on epi-demiology of southern corn leaf blight.Phytopathology. 1974; 64(2):168–173.
3. Welz H, Leonard K. Phenotypic variation and parasitic fitness of races ofCochliobolus carbonumon corn in North Carolina. Phytopathology. 1993; 83(6):593–601.
4. Jones MJ, Dunkle LD. Analysis ofCochliobolus carbonumraces by PCR amplification with arbitrary and gene-specific primers. Phytopathology.1993; 83:366–366.
5. Multani D, Meeley R, Paterson A, Gray J, Briggs S, Johal G. Plant–pathogen microevolution: molecular
basis for the origin of a fungal disease in maize. P Natl Acad Sci USA. 1998; 95(4):1686–1691. PMID:
9465077
6. Comstock J, Scheffer R. Role of host-selective toxin in colonization of corn leaves by Helminthospor-ium carbonum. Phytopathology. 1973; 63:24–29.
7. Leonard K, Leath S. Genetic diversity in field populations ofCochliobolus carbonumon corn in North Carolina. Phytopathology. 1990; 80(11):1154–1159.
8. Hamid A, Ayers J, Schein R, Hill R Jr. Components of Fitness Attributes inCochliobolus carbonum
Race 3. Phytopathology. 1982; 72(9):1166–1169.
10. Welz HG, Leonard KJ. Gametic phase disequilibria in populations of race 2 and race 3 ofCochliobolus carbonum. Eur J Plant Pathol. 1995; 101(3):301–310.
11. Schnable PS, Ware D, Fulton RS, Stein JC, Wei F, Pasternak S, et al. The B73 maize genome: com-plexity, diversity, and dynamics. Science. 2009; 326(5956):1112–1115. doi:10.1126/science.1178534
PMID:19965430
12. Davidson RM, Hansey CN, Gowda M, Childs KL, Lin H, Vaillancourt B, et al. Utility of RNA sequencing for analysis of maize reproductive transcriptomes. Plant Genome. 2011; 4(3):191–203.
13. Li P, Ponnala L, Gandotra N, Wang L, Si Y, Tausta SL, et al. The developmental dynamics of the maize leaf transcriptome. Nat Genet. 2010; 42(12):1060–1067. doi:10.1038/ng.703PMID:21037569
14. Yonekura-Sakakibara K, Tohge T, Matsuda F, Nakabayashi R, Takayama H, Niida R, et al. Compre-hensive flavonol profiling and transcriptome coexpression analysis leading to decoding gene–
metabolite correlations inArabidopsis. Plant Cell. 2008; 20(8):2160–2176. doi:10.1105/tpc.108.
058040PMID:18757557
15. Yang H, Lu P, Wang Y, Ma H. The transcriptome landscape ofArabidopsismale meiocytes from high-throughput sequencing: the complexity and evolution of the meiotic process. Plant J. 2011; 65(4): 503–516. doi:10.1111/j.1365-313X.2010.04439.xPMID:21208307
16. Dardick C. Comparative expression profiling ofNicotiana benthamianaleaves systemically infected with three fruit tree viruses. Mol Plant Microbe In. 2007; 20(8):1004–1017. PMID:17722703
17. Senthil G, Liu H, Puram V, Clark A, Stromberg A, Goodin M. Specific and common changes in Nicotia-na benthamiaNicotia-na gene expression in response to infection by enveloped viruses. J Gen Virol. 2005; 86 (9):2615–2625. PMID:16099921
18. Użarowska A, Dionisio G, Sarholz B, Piepho H-P, Xu M, Ingvardsen CR, et al. Validation of candidate genes putatively associated with resistance to SCMV and MDMV in maize(Zea maysL.) by expression profiling. BMC Plant Biol. 2009; 9(1):15.
19. Figueiredo A, Fortes AM, Ferreira S, Sebastiana M, Choi YH, Sousa L, et al. Transcriptional and meta-bolic profiling of grape (Vitis vinifera L.) leaves unravel possible innate resistance against pathogenic fungi. J Exp Bot. 2008; 59(12):3371–3381. doi:10.1093/jxb/ern187PMID:18648103
20. Beers RF, Sizer IW. A spectrophotometric method for measuring the breakdown of hydrogen peroxide by catalase. J Biol Chem. 1952; 195(1):133–140. PMID:14938361
21. Gilbert HS, Stump DD, Roth EF Jr. A method to correct for errors caused by generation of interfering compounds during erythrocyte lipid peroxidation. Anal Biochem. 1984; 137(2):282–286. PMID:
6731814
22. Sadasivam S. Manickam A.Biochemical Methods for Agricultural Sciences. New Age lnternational, 1992;256.
23. Upadhyaya A, Sankhla D, Davis TD, Sankhla N, Smith B. Effect of paclobutrazol on the activities of some enzymes of activated oxygen metabolism and lipid peroxidation in senescing soybean leaves. J Plant Physiol. 1985; 121(5):453–461.
24. Zauberman G, Ronen R, Akerman M, Weksler A, Rot I, Fuchs Y. Post-harvest retention of the red col-our of litchi fruit pericarp. Sci Hortic-amsterdam.1991; 47(1):89–97.
25. Bradford MM. A rapid and sensitive method for the quantitation of microgram quantities of protein utiliz-ing the principle of protein-dye bindutiliz-ing. Anal Biochem. 1976; 72(1):248–254.
26. AC't Hoen P, Ariyurek Y, Thygesen HH, Vreugdenhil E, Vossen RH, de Menezes RX, et al. Deep se-quencing-based expression analysis shows major advances in robustness, resolution and inter-lab por-tability over five microarray platforms. Nucleic Acids Res. 2008; 36(21):e141–e141. doi:10.1093/nar/
gkn705PMID:18927111
27. Tatusov RL, Fedorova ND, Jackson JD, Jacobs AR, Kiryutin B, Koonin EV, et al. The COG database: an updated version includes eukaryotes. BMC Bioinformatics. 2003; 4(1):41.
28. Blake JA, Harris MA.The Gene Ontology (GO) project: structured vocabularies for molecular biology and their application to genome and expression analysis. Current protocols in bioinformatics. 2008; 7.2. 1–7.2. 9.
29. Ogata H, Goto S, Sato K, Fujibuchi W, Bono H, Kanehisa M. KEGG: Kyoto encyclopedia of genes and genomes. Nucleic Acids Res. 1999; 27(1):29–34. PMID:9847135
30. Mwangi SF. Status of northern leaf blight, Phaeosphaeria maydis leaf spot, Southern leaf blight, rust, maize streak virus and physiologic specialization of exserohilum turcicum in Kenya. Virginia Polytech-nic Institute and State University; 1998.
31. Liu Y, Wang J. Southern corn rust occurred in Hebei Province in 1998. Plant Prot. 1999; 25(3):53. 32. Holley R, Goodman M. New sources of resistance to southern corn leaf blight from tropical hybrid
33. Broglie KE, Butler KH. In: Polynucleotides and methods for making plants resistant to fungal patho-gens. 2008 WO Patent 2,008,157,432.
34. Bent AF, Mackey D. Elicitors, effectors, and R genes: the new paradigm and a lifetime supply of ques-tions. Annu Rev Phytopathol. 2007; 45:399–436. PMID:17506648
35. Fukuoka S, Saka N, Koga H, Ono K, Shimizu T, Ebana K, et al. Loss of function of a proline-containing protein confers durable disease resistance in rice. Science. 2009; 325(5943):998–1001. doi:10.1126/
science.1175550PMID:19696351
36. Fu D, Uauy C, Distelfeld A, Blechl A, Epstein L, Chen X, et al. A kinase-START gene confers tempera-ture-dependent resistance to wheat stripe rust. Science. 2009; 323(5919):1357–1360. doi:10.1126/
science.1166289PMID:19228999
37. Hanssen IM, van Esse HP, Ballester A-R, Hogewoning SW, Parra NO, Paeleman A, et al. Differential tomato transcriptomic responses induced by pepino mosaic virus isolates with differential aggres-siveness. Plant Physiol. 2011; 156(1):301–318. doi:10.1104/pp.111.173906PMID:21427280
38. Marathe R, Guan Z, Anandalakshmi R, Zhao H, Dinesh-Kumar S. Study ofArabidopsis thaliana resis-tome in response to cucumber mosaic virus infection using whole genome microarray. Plant Mol Biol. 2004; 55(4):501–520. PMID:15604696
39. Babu M, Griffiths JS, Huang TS, Wang A. Altered gene expression changes inArabidopsisleaf tissues and protoplasts in response to Plum pox virus infection. BMC Genomics. 2008; 9(1):325.
40. Pandey SP, Somssich IE. The role of WRKY transcription factors in plant immunity. Plant Physiol. 2009; 150(4):1648–1655. doi:10.1104/pp.109.138990PMID:19420325
41. Singh KB, Foley RC, Oñate-Sánchez L. Transcription factors in plant defense and stress responses. Curr Opin Plant Biol. 2002; 5(5):430–436. PMID:12183182
42. Jakoby M, Weisshaar B, Dröge-Laser W, Vicente-Carbajosa J, Tiedemann J, Kroj T, et al. bZIP tran-scription factors inArabidopsis. Trends Plant Sci. 2002; 7(3):106–111. PMID:11906833
43. Navarro L, Dunoyer P, Jay F, Arnold B, Dharmasiri N, Estelle M, et al. A plant miRNA contributes to anti-bacterial resistance by repressing auxin signaling. Science. 2006; 312(5772):436–439. PMID:
16627744
44. Quint M, Gray WM. Auxin signaling. Curr Opin Plant Biol. 2006; 9(5):448–453. PMID:16877027
45. Dharmasiri N, Dharmasiri S, Weijers D, Lechner E, Yamada M, Hobbie L, et al. Plant development is regulated by a family of auxin receptor F box proteins. Dev Cell. 2005; 9(1):109–119. PMID:15992545
46. Kepinski S, Leyser O. TheArabidopsisF-box protein TIR1 is an auxin receptor. Nature. 2005; 435 (7041):446–451. PMID:15917798
47. Tiwari SB, Hagen G, Guilfoyle TJ. Aux/IAA proteins contain a potent transcriptional repression domain. Plant Cell. 2004; 16(2):533–543. PMID:14742873
48. Penninckx I, Eggermont K, Terras F, Thomma B, De Samblanx GW, Buchala A, et al. Pathogen-in-duced systemic activation of a plant defensin gene inArabidopsisfollows a salicylic acid-independent pathway. Plant Cell. 1996; 8(12):2309–2323. PMID:8989885
49. O'donnell P, Calvert C, Atzorn R, Wasternack C, Leyser H, Bowles D. Ethylene as a signal mediating the wound response of tomato plants. Science. 1996; 274(5294):1914–1917. PMID:8943205
50. Wang X, Wang X, Duan Y, Yin S, Zhang H, Huang L, et al. TaAbc1, a Member of Abc1-Like Family In-volved in Hypersensitive Response against the Stripe Rust Fungal Pathogen in Wheat. PloS One. 2013; 8(3):e58969. doi:10.1371/journal.pone.0058969PMID:23527058
51. Jambunathan N, Mahalingam R. Analysis ofArabidopsisgrowth factor gene 1 (GFG1) encoding a nudix hydrolase during oxidative signaling. Planta. 2006; 224(1):1–11. PMID:16328543