Concrete modulus of elasticity assessment using digital
image correlation
Determinação do módulo de elasticidade do concreto
utilizando a correlação de imagem digital
a Department of Structural Engineering, School of Engineering of the Federal University of Minas Gerais, Belo Horizonte, MG, Brazil.
A. H. A. SANTOS a
R. L. S. PITANGUEIRA a [email protected]
G. O. RIBEIRO a [email protected]
E. V. M. CARRASCO a [email protected]
Abstract
Resumo
This paper presents the use of the technique of digital image correlation for obtaining the elasticity modulus of concrete. The proposed system
uses a USB microscope that captures images at a rate of ive frames per second. The stored data are correlated with the applied loads, and a stress-strain curve is generated to determine the concrete compressive modulus of elasticity. Two diferent concretes were produced and tested using the proposed system. The results were compared with the results obtained using a traditional strain gauge. It was observed a diference in the range of 4% between the two methods, wherein this diference depends on some parameters in the case of the DIC results, as focal length and a video capture resolution, indicating that DIC technique can be used to obtain mechanical properties of concrete.
Keywords: experimental testing, concrete strain, concrete structures.
O presente artigo apresenta o uso da técnica de correlação de imagem digital para a obtenção do módulo de elasticidade do concreto. O sistema proposto utiliza um microscópio USB que capta as imagens a uma taxa de 5 quadros por segundo. Posteriormente, os dados armazenados são compatibilizados com as cargas aplicadas e a curva tensão-deformação é gerada para determinação do módulo de elasticidade longitudinal do
concreto à compressão. Dois concretos distintos foram produzidos e ensaiados utilizando o sistema proposto. Os resultados foram comparados
com os obtidos com a metodologia tradicional, que utiliza Clips Gauges. Foi observada uma diferença na faixa de 4% entre os dois métodos,
sendo que essa diferença depende de alguns parâmetros no caso dos resultados do DIC, a distância focal e a resolução do vídeo, indicando que
a técnica de correlação de imagem digital pode ser utilizada para a obtenção de propriedades mecânicas do concreto.
1. Introduction
An evaluation of the concrete compressive modulus of elasticity is obtained directly from the stress-strain curve experimentally. Nor-mal techniques, such as the Brazilian standard (NBR 8522 [1]) and the American standard (C469 [2]), suggest methods for concrete strain determination using an electrical resistance strain gauge, a demec mechanical strain gauge and a compressometer. An
electri-cal strain gauge is the most widely used method for concrete strain determination (HUANG[3]). However, the adhesion of the strain
gauge in a concrete sample requires time and attention from the
workers, and the adhesion is not reused and results in a technique
that is unsustainable. Additionally, the use of a strain gauge deter-mines the size of the concrete samples for this application. Con-sequently, a strain gauge cannot be attached to smaller or larger
parts unless the size is speciied by the strain gauge producers. In recent decades, new technologies, such as acoustic emission
(HUANG et al. [4] and KORENSKA et a.l.[5]), digital image cor-relation (CHU et al. [6],SUTTON et al.[7], BRUCK et al.[8], LUO et al. [9], HUANG et al. [10], SANTOS et al.[11]) and shearography (HUNG [12], HUANG et al.[13]), have been used for certain me-chanical parameters of concrete, including the elasticity modulus.
Among these techniques, digital image correlation (DIC) has gained rapid recognition. The DIC technique has several advan -tages, including accuracy, dynamics and the rapid analysis of data.
This technique uses speckle patterns (natural or artiicial) as infor
-mation carriers. By matching the surface speckles captured be
-fore and after a deformation or displacement using a correlation
function, adequate speckle displacement can be easily obtained
(SUTTON et al.[14]).
The use of the DIC technique has been widely accepted in struc -tures engineering because it is an important method for characteriz-ing the mechanical response of homogenous (LAGATTU et al. [15],
LOCKWOOD et al. [16], REYNOLDS and REYNOLDS[17], YAN and
SUTTON[18]) and heterogeneous materials (PETERS and RAN-SON[19], CHOI and SHAH [20], PAN et al. [21], MCCORMICK and
LORD [22], SUTTON et al.[23] undergoing nominally planar defor
-mation, especially when evaluating the fracture behavior (CORR et
al. [24], HELM [25], SUBRAMANIAN et al.[26], WU et al. [27]. When
using the DIC technique for an evaluation of the elasticity modulus of concrete, the work of ROBERT et al. [28] was the irst to demon
-strate excellent correlation between the results obtained for the DIC technique with the results obtained by the traditional method. Other work which also made this comparison was to HUANG et al.[3]. In this study, HUANG et al.[3] used two high-resolution CCD cameras equipped with long working distance lens. The proposed system that
is presented in this paper uses a single USB microscope.
Using the principle of DIC, the motion estimated for each point is
obtained from the expansion of the imaging system (correlation in mm/pixel). According to PAN et al.[21] and SUTTON et al. [29], this
estimate only depicts the real point of movement if two require -ments are met: (a) the sample surface must be at an angle of 90
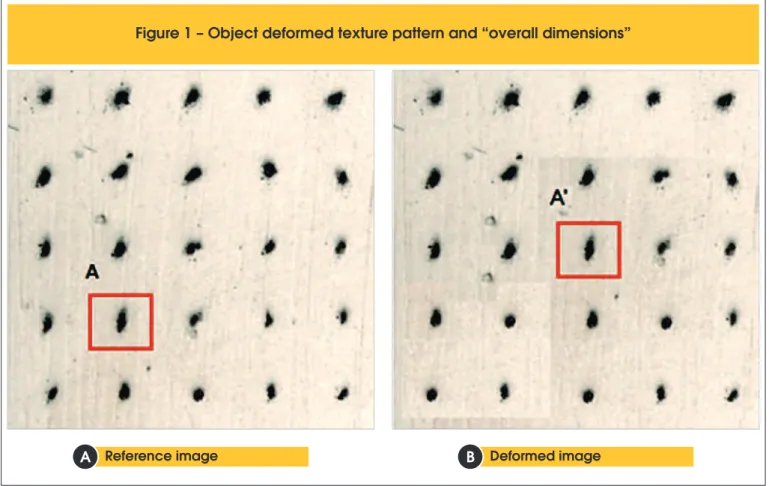
degrees to the sensor pickup and remain in this position during loading; (b) the image should not sufer from geometric distortion. Figure 1 shows images of a random pattern of a surface captured
Figure 1 – Object deformed texture pattern and “overall dimensions”
Reference image
B
before and after deformation. To determine the displacement of point A, a region near this point is chosen in the reference image (Figure 1a) and in the combined deformed image (Figure 1b). The centroid of the selected rectangular area is used as a reference point for measuring the relative displacements. Additionally, the vertices of the rectangle are used by the image processing
soft-ware to check the rotation and/or translation of the point.
After capturing the images and the deinition of the reference points, subroutines are processed using speciic software to store
the displacements as rotations (image by image) or as generating
coordinates (x, y) (point by point), which are converted using the
ratio of pixels per unit length and are adopted as “overall
dimen-sions” as shown in Figure. 1.
This article aims to evaluate the DIC technique for obtaining the
elasticity modulus of concrete. Next, specimens of concrete,
which were prepared for two diferent compositions, were used for the test of uniform axial compression. The DIC technique re
-sults were compared with the re-sults obtained using the strain
gauge methods.
The DIC technique was applied using the USB microscope (800x) and speciic software. The elasticity modulus of the concrete was
determined using the stress-strain diagram.
2. Material and methods
According to Pan et al.[21], the DIC technique consists of three
consecutive steps: (a) The preparation of the sample surface and
of the sample before and after the application of the load, (c) The processing of images acquired using appropriate algorithms to ob-tain the desired displacements and deformations.
Figure 2 shows the schematic setup of the proposed system for
monitoring the deformation of the concrete. A single
high-resolu-tion USB microscope was used to capture images in a region (2.0
cm x 1.5 cm). The USB digital microscope (800x) has an image sensor of 1.2 megapixels and a video capture resolution of 1280
x 960 pixels. The rate of capture of the images is ive frames per
second and is recorded in an AVI video format no compression.
The lighting is generated by an LED lamps’ microscope.
For the image processing was developed an software using the LabVIEW platform. This software was divided into four parts: 1) Digital Image Acquisition; 2) Data Input; 3) the image process
-ing and 4) Results presentation. In the irst stage, images of the specimen, which is already subjected to axial loading, are captured
using the USB Microscope 800x. These images are stored in the
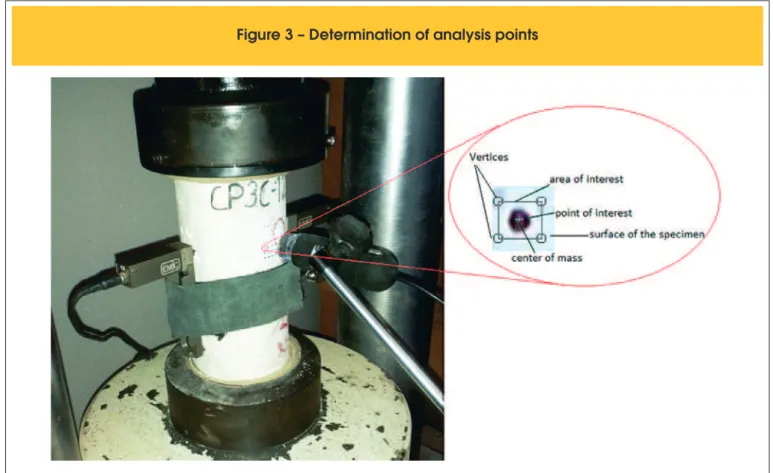
software memory. In the second step, on irst captured image is performed the marking of the area of interest to be studied, from
points of interest (Figure 3). These points have a ratio pixel / mm
that is transferred to the software memory. The area of interest’s
center of mass is the reference for the displacement
measure-ments, while the vertices of the area of interest’s rectangle are the references used by the processing routines to indicate whether there was rotation or not at the selected point on the surface of the specimen during the test. The point of interest’s shape is stored in the software memory by contrast variation of pixels and its distance from the area of interest’s center of mass.
In the third step, the software calculates, frame to frame, the move -ments of translation and rotation of the points of interest. The
de-termination of these points coordinates is performed using two speciic routines implemented in the software for processing im
-ages, which are: shift invariant and rotation invariant. The irst rou -tine considers that occurs only small rotations of the area of
inter-est during image processing and that these rotations are up to by
four degrees. The second routine considers that will have rotations
above four degrees of the area of interest. After the image
process-ing matrices are generated with the coordinates (x, y) to the area of interest’s center of mass displacement in each processed image.
These displacements are measured in pixels. The last part of the
Figure 3 – Determination of analysis points
Figure 4 – Grading curve for (a) fine aggregate, (b) coarse aggregate limestone
B
software searches for these matrices and converts the distance
from pixels to millimeters. Stress - strain curve are generated from these matrices and load cell data.
Ten standard cylindrical concrete samples that have a 100-mm
di-ameter and a 200-mm length were produced.
The specimen is under uniform axial compression, which is calcu
-lated using the ratio between the load and the initial cross-section -al area of the specimen (Figure 2). The longitudin-al strain of the concrete cylinder is obtained from the relative displacement (d) in
the axial direction of two points, is used as the basis of measure -ment DL) and is located on the surface on the specimen surface in the cylinder generatrix. Using the stress-strain diagram, the elastic-ity modulus of the concrete is determined.
In this paper the surface of the specimen cylindrical is not at angle of 90 degree to the sensor as indicated by PAN et al. [21] and
SUTTON et al.[29]. However, for calculation of the deformation us
-ing the DIC was used the average value between pairs of points within the monitored area, so that the distortion occurred can
be disregarded.
The studied region was prepared prior to testing by sanding the surface and was sprayed with black and white speckles to pro
-vide a good contrast image. A template with points spaced at 0.5 mm is generated. The test can be performed without any surface preparation, but the assurance of the monitoring points will be de -pendent on the randomness of the medium. The focal length of the
microscope was 5 cm with an optical zoom of 200 times (200x). Next, the obtained digital scale was approximately 2 mm/pixel in both image directions. This ratio is suitable for determining
defor-mations that are uniform and constant, when the precision of the
deformation attainable is from 153 me.
The proposed method uses samples that were created with a con
-crete mixture. Both were produced by coarse aggregate limestone, river sand and cement (CP II - E32). No additives were included in the mixture. Figure 4 shows the grading curves of the coarse and ine aggregates, which have a maximum diameter (fmax) of 2.4 mm
and 12.5 mm, respectively.
The two types of concrete are denoted by L1 and L2. The mix
pro-portions are listed in Table 1. The compressive strength test was performed, and the samples were healed outdoors for 28 days and were protected from direct sunlight.
The average compressive strength that was determined at 28 days
(fc 28) was 40 MPa (for L1 concrete) to 33 MPa (for L2 concrete).
Following a standard concrete testing method indicated by techni
-cal standards [1,2], specimens were prepared with a surface lat -ness of contact using sulfur-based capping. The axial
compres-sion tests were performed using a servo-hydraulic machine EMIC, Model PC 200. When the cylinder sample was compressed, a se
-ries of images was captured and analyzed. To determine the elas
-tic modulus, the elas-tic section of the stress-strain curve was con
-sidered in the narrow range between 0.5 MPa and was 30% of the
ultimate concrete strength. The data of the compressive strength
were previously estimated using the uniaxial compression test, and the strength data were used to determine the ultimate loading
for the cylinder specimens and to determine the static modulus of elasticity in compression. The value of 0.5 MPa is used to ensure
a uniform contact between the specimen and the machine, which
leads to an approximate initial deformation of 0.0001 mm / mm
Table 1 – Cement characteristics – CP V ARI RS
Concrete Cement (kg/m³)
Coarse aggregate
(kg/m³)
Fine aggregate (kg/m³)
Water (kg/m³)
Water/cement ratio A/C
Fc 28 (MPa)
L1 400 1200 600 220 0,50 40
L2 400 1200 600 220 0,55 33
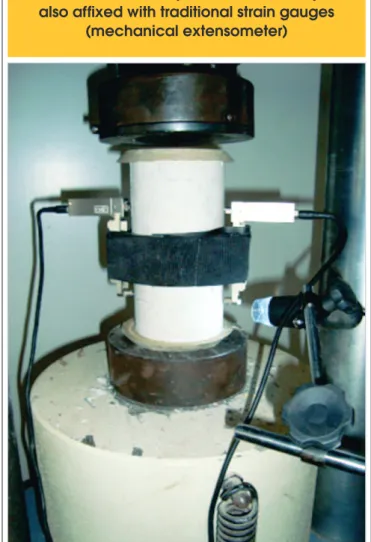
Figure 5 – Real setup of the experiment using a
servo-hydraulic machine EMIC, Model PC 200
and an USB microscope (800x). The sample is
Loading and unloading cycles were performed to stabilize the test at a rate of 0.45 MPa/s for intervals of 30 seconds between loading
and unloading.
Using the system of data capture called SPIDER 8, the displace
-ments’ information and the applied loads were stored in time. The images captured by the microscope were simultaneously stored on a hard disk in parallel. Once, the data capture system and the microscope are decoupled the variable “time” was adopted as the
parameter compatibility information.
The compatibility was performed using an electronic spreadsheet, where, before performing the assay, the simultaneity of the system clocks data capture and the USB microscope was done. Addition
-ally, an equivalent deinition for the sampling frequency of the nu
-merical data (5 Hz) and for the rate of image capture (5 fps) was performed before the test. Figure 5 shows a photograph of the
experiment assembly.
In addition to the USB microscope (800x), traditional strain gauges
(Clip Gauges) were installed diametrically (i.e., opposite the sur -face of the specimen) to obtain the deformation, and the results
were used for comparison with the proposed method.
3. Results and discussion
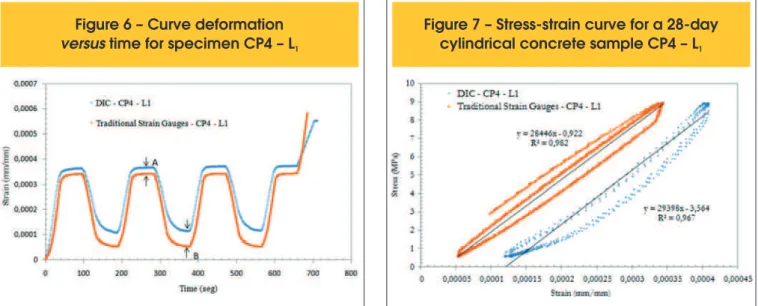
Figure 6 shows the deformation versus the time curves for the
fourth specimen of concrete L1 obtained from the USB microscope and the traditional strain gauges. The loading and unloading
cy-cles are very evident in the curves (Figure 6). This variation was captured by the DIC technique even though the reference length
(DL = 13 mm) of the image was diferent from the reference length of the traditional strain gauges (DL = 100 mm). The diference be
-tween the two curves can be attributed to the non-homogeneity of the composite material as well the diference between the refer -ence length adopted for each of the methods for calculating the deformation.
The DIC technique has always presented a greater deformation
than the traditional strain gauges (Figure 6). For the highest stress
levels, this diference is reduced. The diference percentage be
-tween the curves at point A is 6,5% and at point B is 47.8%.
An improved itting in the curves for the highest stress may dem
-onstrate that the DIC technique enhances their sensitivity as the
deformation increases.
Figure 7 shows typical stress-strain curves for the cylindrical con -crete sample CP4 - L1 that is obtained from the USB microscope and the traditional strain gauges. The resulting curves are very similar to each other. The horizontal shift in the axis of the
de-formation is a direct consequence of the diference observed and
discussed in Figure. 5.
The dispersion of the data (Figure 7) that occurred in the load-ing and unloadload-ing cycles could be related to the fact that the test is held at the same stress level for 30 seconds to stabilize. The cycles may vary because of the apparatus oscillation in the load,
which occurs to maintain the stress. For this sample, the diference between the values of the elasticity modulus for the DIC technique and the traditional strain gauges was approximately 3%.
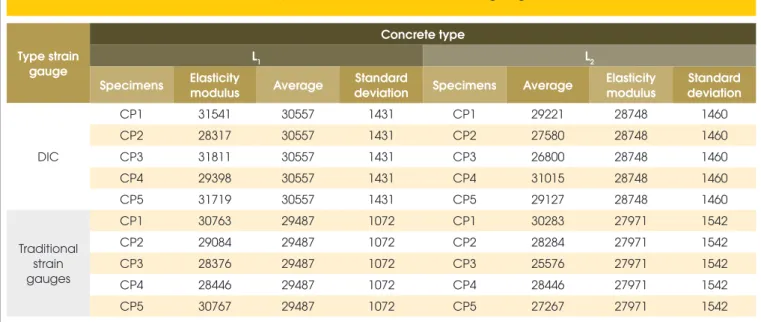
For the other samples, similar curves were obtained, and the aver
-age of the elasticity modulus and the standard deviation was cal -culated (Table 2).
For concrete L1, the average elasticity modulus that was obtained
using the DIC technique was 30.56 GPa, and the average elastic
-ity modulus that was obtained using the traditional strain gauges was 29.49 GPa. For concrete L2, the average elasticity modulus
obtained using the DIC technique was 28.75 GPa, and the aver
-age elasticity modulus that was obtained using the traditional strain gauges was 27.97 GPa. The values obtained for the two types of gauges are similar. The diference between these values for the L1
concrete was 3.63%, and the diference between these values for
the L2 concrete was 2.8%. This divergence can be attributed to the
diferences of the analysis points, the diference between the refer -ence lengths (DL) used to compute the strain for each method and the very characteristic of the inhomogeneous concrete.
For table 2, it is noticed that to DIC strain values using a microscope, thus with a small “optical” strain gauge size (13 mm, of same order
of the mean size of the coarse aggregates), has very similar results
with a large strain gauge size (100 mm). Analyzing the traditional strain gauge it is observed that it utilizes two diametrically opposed measures, so that the result is an average between these two val
-Figure 6 – Curve deformation
versus
time for specimen CP4 – L
1Figure 7 – Stress-strain curve for a 28-day
ues, which minimizes the possible efect of bending that can occur in the test. In the case of DIC as the monitored area (the reference
length DL = 13 mm) is small, the efect of bending is practically non
-existent. In order to validate this hypothesis the test was performed using DIC repeatedly changing the position of the microscope. The values found for the same specimen were diferent, but within the range of the standard deviation shown in Table 2. This result shows that the response DIC, even though localized, representing the mac -roscopic behavior of the axial compression test.
The results showed that the DIC technique provides values equiv -alent to the values obtained using traditional strain gauges as
well as signiicant advantages. The irst major advantage is that the DIC technique can be used without surface preparation or for
the preparation of only a small region. Currently, no dependence exists for the randomness of the medium for this technique. The
second major advantage is that the dynamics and lexibility of the DIC technique can be applied for studies in which the electrical
strain gauge or mechanical strain gauge are not possible, includ-ing samples of various sizes. The third advantage includes the
ac-curacy of the system, which can be improved in accordance with
the situation by changing both the focal length and the focus area
to achieve greater precision. Finally, the proposed system ofers low-cost, easy use and sustainability because the hardware can be reused indeinitely.
4. Conclusions
A method for obtaining the concrete strain and displacements us-ing a USB microscope (800x) and for determinus-ing the concrete elasticity modulus of compression has been proposed and vali-dated in this paper. The values obtained by the proposed system
were of the same order of magnitude of the values generated using the traditional strain gauge. A diference of up to 4% was found for
the values of the modulus of elasticity.
New tests will be performed to improve this analysis. For example,
a system will be developed for coupling the load to the images without the need for human intervention. In addition, the installa
-tion of other microscopes simultaneously will enable the identiica
-tion of strains in the longitudinal and transverse plane as well as
the outside shooting plane.
Generally, the digital image correlation technique is a technology
with a wide range of applications in structures engineering and can be used with any type of material, such as wood and steel.
5. Acknowledgments
The authors gratefully acknowledge the important support received
from FAPEMIG (Fundação de Amparo à Pesquisa do Estado de Minas Gerais) and Pró-Reitoria de Pesquisa da Universidade Fed-eral de Minas Gerais - UFMG.
6. Bibliographical references
[1] ASSOCIAÇÃO BRASILEIRA DE NORMAS TÉCNICAS – ABNT. NBR 8522. Concreto - Determinação do Módulo Es
-tático de Elasticidade à Compressão e Diagrama Tensão-Deformação. ABNT, p. 1-9, 2008.
[2] C469–02, Standard Test Method for Static Modulus of Elas
-ticity and Poisson’s Ratio of Concrete in Compression.
ASTM, p. 1-5, 2002.
[3] HUANG, H.; LIU, L.; SHAM, F. C.; CHAN, Y. S.; NG, S. P.
Optical Strain Gauge vs. Traditional Strain Gauges for
Con-crete Elasticity Modulus Determination. Optik - International
Journal for Light and Electron Optics, v. 121, p. 1635-1641, 2010.
[4] HUANG, M.; JIANG, L.; LIAW, P. K.; BROOKS, C. R.;
SEE-LEY, R.; KLARSTROM, D. L. Using Acoustic Emission in Fa
-tigue and Fracture Materials Research. JOM – The Minerals,
Metals & Materials Society, v. 50, n.11, p.1-12, 1998.
Table 2 – Comparative data between the results obtained using
the DIC technique and the traditional strain gauges (MPa)
Type strain gauge
Concrete type
L1 L2
Specimens Elasticity
modulus Average
Standard
deviation Specimens Average
Elasticity modulus
Standard deviation
DIC
CP1 31541 30557 1431 CP1 29221 28748 1460
CP2 28317 30557 1431 CP2 27580 28748 1460
CP3 31811 30557 1431 CP3 26800 28748 1460
CP4 29398 30557 1431 CP4 31015 28748 1460
CP5 31719 30557 1431 CP5 29127 28748 1460
Traditional strain gauges
CP1 30763 29487 1072 CP1 30283 27971 1542
CP2 29084 29487 1072 CP2 28284 27971 1542
CP3 28376 29487 1072 CP3 25576 27971 1542
CP4 28446 29487 1072 CP4 28446 27971 1542
[5] KORENSKA, M.; PADZERA ,L.; MANYCHOVA, M. Efects of
Material Structure of Concrete on Acoustic Emission Signal
Parameters. European Working Group on Acoustic Emission
(EWGAE), 2010.
[6] CHU, T. C.; RANSON, W. F.; SUTTON, M. A. Applications of digital-image-correlation techniques to experimental me-chanics. Experimental Mechanics, v. 25, p. 232-244, 1985.
[7] SUTTON, M.A.; CHENG, M.; PETERS, W. H.; CHAO, Y. J.; MCNEILL, S. R. Application of an Optimized Digital Correla
-tion Method to Planar Deforma-tion Analysis. Image Vision
Computer, v. 4, p. 143-150, 1986.
[8] BRUCK, H.; McNEILL, S.; SUTTON, M. A.; PETERS, W.
Digital Image Correlation Using Newton-Raphson Method of Partial Diferential Correction. Experimental Mechanics, v.
29, p. 261-267, 1989.
[9] LUO, P. F.; CHAO, Y. J.; SUTTON, M. A.; PETERS, W. H. Accurate Measurement of Three Dimensional Deformations in Deformable and Rigid Bodies Using Computer Vision. Ex -perimental Mechanics, v. 33, p. 123-132, 1993.
[10] HUANG, Y.H.; QUAN, C.; TAY, C.J.; CHEN, L. J. Shape Measurement by The Use of Digital Image Correlation. Opti -cal Engineering, v. 40 n.8, p. 1-7, 2005.
[11] SANTOS, A. H. A.; PITANGUEIRA, R. L. S.; RIBEIRO, G. O;
CALDAS, R. B. Study of size efect using Digital Image Cor -relation. Revista Ibracon, v.8 n.3, p.323-340, 2015
[12] HUNG, Y. Y.; SHEAROGRAPHY: A New Optical Method for
Strain Measurement and Nondestructive Testing. Optical En-geeniring, v. 21, n.3, p.391-395, 1982.
[13] HUANG, Y. H.; NG, S.P.; LIU, L.; CHEN, Y. S.; HUNG, M.Y. Y. Shearographicphase Retrieval Using One Single Speck -legram: A Clustering Approach. Optical Engeenring, v. 47, n. 5, 2008.
[14] SUTTON, M. A.; McNEILL, S. R.; HELM, J. D.; CHAO, Y. J. Advances in Two-Dimensional and Three-Dimensional Com -puter Vision. Topics in Applied Physics, v. 77, p. 323-372, 2000.
[15] LAGATTU F, BRILLAUD J, LAFARIE-FRENOT MC. High
strain gradient measurements by using digital image
correla-tion technique. Mater Charact 2004;53:17–28.
[16] LOCKWOOD WD, TOMAZ B, REYNOLDS AP. Mechanical response of friction stir welded AA2024: experiment and modeling. Mater Sci Eng 2002;A323: 348–53.
[17] Reynolds AP, Duvall F. Digital image correlation for determi
-nation of weld and base metal constitutive behavior. Welding J 1999;78(10):355s–60s.
[18] YAN J, SUTTON MA, REYNOLDS AP, SAMER A, HORSLEY D. Characterization of heterogeneous response of pipeline steel weld using digital image correlation. In: Proceedings
of the 2006 SEM annual conference and exposition on
ex-perimental and applied mechanics, June 4–7 2006, St Louis, Missouri, USA, 2006, vol. 1. p. 90–6.
[19] PETERS, W. H.; RANSON, W. F.; Digital Imaging Tech -niques in Experimental Stress Analysis. Optical Engineering, v. 21, p. 427-431, 1981.
[20] CHOI, S.; SHAH, S. P. Measurement of Deformations on Concrete Subjected to Compression Using Image Correla -tion. Experimental Mechanics, v. 37, p. 307-313, 1997.
[21] PAN, B.; QUIAN, K.; XIE, H.; ASUNDI, A. Two-dimension
-al Digit-al Image Correlation for in-plane Displacement and
Strain Measurement: A Review. Measurement Science and
Technology, v. 20, p. 1-17, 2009.
[22] McCORMICK, N.; LORD, J. Digital Image Correlation for
Structural Measurements. Civil Engineering, v. 165, p. 185-190, 2012.
[23] SUTTON, M.A.; ORTEU, J.-J.; SCHREIER, H.W.. Image
Correlation for Shape, Motion and Deformation Measure -ments - Basic Concepts, Theory and Applications, Springer, 2009. ISBN 978-0-387-78746-6.
[24] CORR, D.; ACCARDI, M.; GRAHAN-BRADY,L.; SHAH, S. P.; Digital Imaging Correlation Analysis of Interfacial Debonding
Properties and Fracture Behavior in Concrete. Engineering Fracture Mechanics. v. 74, n.1-2, p. 109-121, 2007.
[25] HELM, J. D.; Digital Image Correlation for Specimens with Multiple Growing Cracks. Experimental Mechanics, v. 48, p.
753-762, 2008.
[26] SUBRAMANIAN, K.V.; ALI-AHMAD, M.; GHOSN, M. Freeze- Thaw Degradation of FRP-Concrete Interface: Im -pact on Cohesive Fracture Response. Engineering Fracture
Mechanics, v. 75, n. 13, p. 3924–3940, 2008.
[27] WU, Z.; RONG, H.; ZHENG, J.; XU, F.; DONG, W. An Experi -mental Investigation on the fpz Properties in Concrete Using
Digital Image Correlation Technique. Engineering Fracture
Mechanics, v. 78, p. 2978-2990, 2011.
[28]L. ROBERT, F. NAZARET, J.-J. ORTEU, T. CUTARD. Use of 3-D Digital Image Correlation to characterize the mechanical
behavior of a Fiber Reinforced Refractory Castable, Experi-mental Mechanical. v. 47(6), p.761-773, 2007.
[29] M.A. SUTTON, J.H. YAN, V. TIWARI, H.W. SCHREIER, J.J. ORTEU; “The efect of out of plane motion on 2D and 3D
digital image correlation measurements” Optics and Lasers in Engineering, V.46(11), p.746-757, 2008
[30] GUETTI, P. C., Contribuição ao Estudo das Propriedades Mecânicas do Concreto Autoadensável e do Concreto
Au-toadensável Reforçado com Fibras de Aço, Phd Disserta -tion, University Federal of Minas Gerais - UFMG, 2012