*e-mail: [email protected]
Hydrogen Absorption/Desorption Properties in the TiCrV Based Alloys
A. Martínez*, D. S. dos Santos
Department of Metallurgical and Materials Engineering,
Alberto Luiz Coimbra Institute for Graduate Studies and Research in Engineering – COPPE, Universidade Federal do Rio de Janeiro – UFRJ, CP 68505, CEP 21941-972, Rio de Janeiro, RJ, Brazil
Received: November 24, 2011; Revised: April 16, 2012
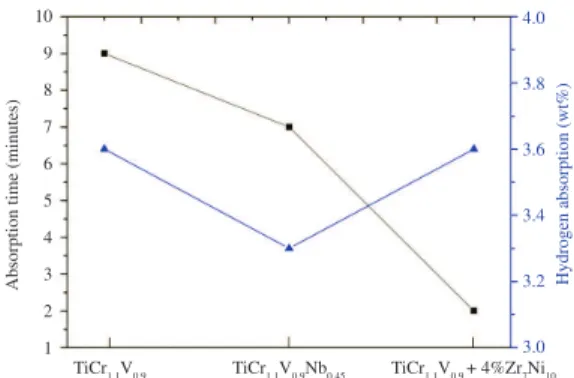
Three different Ti-based alloys with bcc structure and Laves phase were studied. The TiCr1.1V0.9, TiCr1.1V0.45Nb0.45 and TiCr1.1V0.9 + 4%Zr7Ni10 alloys were melted in arc furnace under argon atmosphere. The hydrogen absorption capacity was measured by using aparatus type Sievert’s. Crystal structures, and the lattice parameters were determined by using X-ray diffraction, XRD. Microestructural analysis was performed by scanning electron microscope, SEM and electron dispersive X-ray, EDS. The hydrogen storage capacity attained a value of 3.6 wt. (%) for TiCr1.1V0.9 alloy in a time of 9 minutes, 3.3 wt. (%) for TiCr1.1V0.45Nb0.45 alloy in a time of 7 minutes and 3.6 wt. (%) TiCr1.1V0.9 + 4%Zr7Ni10 with an increase of the hydrogen absorption kinetics attained in 2 minutes. This indicates that the addition of Nb and 4%Zr7Ni10 to the TiCrV alloy acts as catalysts to accelerate the hydrogen absorption kinetics.
Keywords: transition metal compound, hydrogen absorbing materials, crystal structure
1. Introduction
The hydrogen economy has three important aspects to their success: production, transport and storage. Metal hydrides are a safe and economical way to store hydrogen compared to pressurized tanks and cryogenic1 storages.
Cho et al.2, showed that alloys with bcc structure, particularly
TiVCr system have the advantage of absorbing large amounts of hydrogen at room temperature. Dos Santos et al.3,
studying the TiCrV system, observed that TiCr1.1V0.9 alloy reaches a weight percentage of 3.55 wt. (%) at 298 K being considered a possible candidate for using in a practical way. However, there are several problems to be solved in order to make these alloys useable for hydrogen storage such as the slow kinetics of absorption/desorption and the high temperature of desorption. Ball milling techniques and different catalysts have been used to improve the hydrogen absorption/desorption, such as LaNi5 and FeV, but the capacity decreases by contamination and diminution of lattice parameter4,5. Chen et al.6 demostrated that the
Laves phase acted as a catalyst to accelerate the kinetics of hydrogen absorption/desorption of the bcc solid solution phase.
In the present work the effects of the addition of Zr7Ni10 and Nb into the TiCr1.1V0.9 alloy were analyzed by their hydrogen absorption/desorption properties.
2. Experimental Procedure
The alloys with the following compositions TiCr1.1V0.9, TiCr1.1V0.45Nb0.45, Zr7Ni10 were melted separately. The TiCr1.1V0.9 alloy was co-melted with 4% of Zr7Ni10. All samples were synthesized by arc melting under argon
atmosphere using high purity elements (>99.95%). The samples were remelted at least three times to ensure a good homogeneity. The alloys ingot were mechanically pulverized in air to a diameter size that was less than 30 µm. Crystal structure and lattice parameters were analized by XRD using a Shimadzu 5000 with Cu-Kα radiation. The microstructure was estudied by SEM, coupled to a electron dispersive X-ray, EDS, JEOL JSM 6460 LV. The hydrogen absorption/ desorption properties of the as-cast sample were measured in a Sievert’s type apparatus (PCT pro 2000). The activation of the samples was carried out an autoclave where vacuum was maintained for 2 hours at 573 K, the main objective is to remove any oxide layer and surface water ensuring the initial activation of the sample.
3. Analysis and Results
X-ray patterns indicates that TiCr1.1V0.9 alloy presents a single phase bcc structure with lattice parameters of 3.060 Å (Figure 1a). When Nb is added to the TiCr1.1V0.45 alloy higher intensity peaks characteristics of the bcc structure and a minor peak corresponding to a second phase identified as Laves phase C14 (Figure 1b). The lattice parameter for the bcc phase is 3.099 Å. This increase, compared with TiCr1.1V0.9 alloy, is due to the fact that both the atomic radius Ti (132 pm) as the Nb (134.2 pm) are greater than the atomic radius of Cr (117.2 pm) and V (122.4 pm). This leads to increase lattice parameter of the TiCr1.1V0.45Nb0.45 alloy. Moreover when 4% of the intermetallic Zr7Ni10 is added as co-melt to the TiCr1.1V0.9 alloy two coexisting phase are observed (Figure 1c). A greater intensity corresponding to the bcc structure and the second phase with Laves phase OI:
D 10.1590/S1516-14392012005000093
Martínez & Santos
C14 structure as the same is observed. The lattice parameter for the bcc structure is 3.041 Å. This decrease of the lattice parameter compared with the lattice parameter of the TiCr1.1V0.9 alloy is mainly due to the diffusion of Ti atoms of the main bcc phase for the secondary phase. This is verified by EDS semiquantitative analysis whose values are shown in Table 1. Therefore less Ti atoms are in bcc phase, this is in accordance with Vegard law which describes the increase or decrease of the crystal lattice parameter as a function of the concentrations of the constituent elements7.
The samples as melted were analysed by SEM and analisys semiquantitative EDS. Figure 2 shows the microstructure of the TiCr1.1V0.9, TiCr1.1V0.45Nb0.45 and TiCr1.1V0.9 + 4%Zr7Ni10 alloys. The corresponding micrograph of the TiCr1.1V0.9 alloy (Figure 2a) shows an homogeneously distributed phase. This phase is rich in Ti and Cr according to analysis performed by EDS. The micrograph shown in Figure 2b, corresponds to TiCr1.1V0.45Nb0.45 alloy which presents a dendritic microstructure that consists of the two phases a light gray and the other a medium gray at the grain boundary. Analysis done by EDS shows a Ti-Cr rich-phase and the other Nb-V rich-phase.
Figure 2c show the microstructure for corresponding TiCr1.1V0.9 + 4%Zr7Ni10 alloy where it can be seen the presence of two phases being one Ti-rich phase and the second rich in Zirconium and Nickel as analyzed by EDS. The analysis performed by SEM show consistency with the analisys done by XRD which manily shows the presence of bcc phase and other presented two structures coexisting bcc phase and the Laves phase C14.
Figure 3 shows the hydrogen absorption capacity and the time to reach the maximum hydrogen for different samples. An important parameter in this type of alloy is the incubation time which is the time needed so that the hydrogen breaks the oxide layer and therefore the permeate
Figure 2. SEM image of the a)TiCr1.1V0.9, b) TiCr1.1V0.45Nb0.45, c)TiCr1.1V0.9+4%Zr7Ni10. Figure 1. X-ray of the alloys: a) TiCr1.1V0.9, b) TiCr1.1V0.9+4%Zr7Ni10,
c) TiCr1.1V0.45Nb0.45.
Hydrogen Absorption/Desorption Properties in the TiCrV Based Alloys
through the bulk. It is important to note that all samples were previously subjected to the activation process to remove and oxide layer. For the TiCr1.1V0.9 incubation time is 32 minutes and the time needed to reach the maximum capacity is 9 minutes, this is because a layer of oxide on the surface still remains. When Nb is added to the TiCr1.1V0.45 alloy, the incuabation time decreases to 10 minutes reaching a maximum hydrogen capacity absorption in 7 minutes. This suggests that the dendritic intergranular phase precipitated acts as preferred site for the diffusion of hydrogen caused either by short-circuit of diffusion which benefits the rapid formation of hydrogen. This short-circuit mechanism were described by J. Philibert8. For the TiCr
1.1V0.9 + 4%Zr7Ni10 the
incubation time decrease to 30 seconds reaching a maximum hydrogen capacity absorption in a time of 2 minutes. This phenomenon is due to the hydrogen permeates through the first oxide layer of the Laves phase C14 having a thickness less than the bcc phase, this behavior was also described by Zhouminget al.9. This leads cracking along the grain
boundaries resulting in exposure of new surfaces; therefore, more hydrogen can penetrate into the alloy bulk, as was observed by Pei et al.10. So this indicates that the additives
Nb an 4%Zr7Ni10 act as catalysts mainly due to the formation of Laves phase that induces a rapid reaction with hydrogen, allowing easy pulverization compared with alloys of bcc structure which exhibit high hardness.
The hydrogen absorption capacity for the TiCr1.1V0.9 alloy reach a maximum of 3.6 wt. (%). For the TiCr1.1V0.45Nb0.45 alloy the hydrogen absorption capacity was 3.3%, although the lattice parameter of 3.09 Å is a larger than the TiCr1.1V0.9, 3.06 Å. Therefore, the decrease of the capacity is due to the formation of the Laves phase C14 that competes with the bcc structure phase. When adding 4% Zr7Ni10 the hydrogen capacity absorption remains constant with a value of 3.6 wt. (%). In this case, the small amount of the intermetallic does not affect the total capacity, also that the addition of Zr has a high affinity with hydrogen.
Figure 4 shows hydrogen desorption capacity at 298 K which for the three alloys is low, approximately 0.3 wt. (%). This is typical of TiCrV alloy at room temperature due to the formation of two hydrides, TiH2 and TiCr1.8H5.3 with bcc and fcc structure respectively11. These hydrides, TiH
2
and TiCr1.8H5.3, are very stable since the desorption occurs
Table 1. Composition of bcc solid solution of the different alloy.
Sample Composition (at%)
Ti Cr V Zr Ni Nb
TiCr1.1V0.9 36.38 35.04 28.74 TiCr1.1V0.9 +
4%Zr7Ni10 Bcc Matrix Intergranular
phase
33.88 46.20
36.00 18.38
30.12
10.47 12.45 12.49
TiCr1.1V0.45Nb0.45 Bcc Matrix Intergranular
phase
34.72 38.41
34.80 36.71
34.80 12.77
14.82 12.11
Figure 3. Hydrogen absorption time as function of hydrogen absorption capacity at 298 K and 2.0 MPa for different TiCrV based alloys. : Hydrogen absorption (min), ■: Time of absorption.
Figure 4. Desorption capacity at 298 K and 375 K, P = 0.01 MPa.
at temperatures higher than 670 K and 360 K, respectively, due to the stronger bond Ti-H that has a bond dissociation entalphy of 782 kJ.mol–1[12] compared to Cr-H value that is
of 752 kJ.mol–1[12]. However, in Figure 4, the performance
increases at 375 K where better results were obtained for TiCr1.1V0.9 and TiCr1.1V0.45Nb0.45 whose value is 1.5 and 1.4wt. (%) respectively.
4. Conclusions
The addition of Nb and Zr7Ni10 acts as a good catalyst and improves significantly the hydrogen absorption kinetics due to the formation of Laves phase. From the practical point of view these catalysts decrease the incubation time allowing that the diferent alloys do not have to use several hydrogenation processes at high temperatures and this is reflected in an energy saving. The capacity of absorption is approximately 3.6 wt. (%) at room temperature and the performance of desorption of hydrogen increases with temperatures above 375 K.
Acknowledgements
The authors acknowledge CNPq, CAPES and FINEP for the financial support for this research.
Martínez & Santos
7. Jeong-Hyun Y, Gunchoo S, Sung-Wook C and Choong-Nyeon P. Effects of desorption temperature and substitution of Fe for Cr on the hydrogen storage properties of Ti0.32Cr0.43V0.25. International Journal of Hydrogen Energy. 2007; 32:2977-2981. http:// dx.doi.org/10.1016/j.ijhydene.2007.01.012
8. Philibert J. Atom movements diffusion and mass transport in solids. In: Monographies de Physique. Les editions de physique; 1991.
9. Zhouming H, Xuezhang X, Dezhi T, Zhenghao H, Weipeng Li, Shouquan Li et al. Microstructure and hydrogen storage properties of Ti10V84-xFe6Zrx(x = 1 – 8) alloys. International Journal of Hydrogen Energy. 2010; 35:30-80.
10. Pei P, Song XP, Liu J, Zhao M and Chen GL. Improved hydrogen storage properties of Laves phase related BCC solid solution alloy by SPS preparation method. International Journal of Hydrogen Energy. 2009; 34:8597-8602. http:// dx.doi.org/10.1016/j.ijhydene.2009.08.038
11. Lin HC, Lin KM, Wu KC, Hsiung HH and Tsai HK. Cyclic hydrogen absorption-desorption characteristics of TiCrV and Ti0.8Cr1.2V alloys. International Journal of Hydrogen Energy. 2007; 32:4966-4972. http://dx.doi.org/10.1016/j. ijhydene.2007.07.057
12. Simões JAM and Beauchamp JL. Transition-Metal hydrogen and metal-carbon bond strengths-the keys to catalysis.Reviews Chemical. 1990; 90:629-688. http://dx.doi.org/10.1021/ cr00102a004
References
1. Sakintuna B, Lamari-Darkrim F and Hirscher M. Metal hydride materials for solid hydrogen storage: A review. International Journal of Hydrogen Energy. 2007; 32:1121-1140. http:// dx.doi.org/10.1016/j.ijhydene.2006.11.022
2. Cho S-W, Han C-S, Park C-N and Akiba E. The hydrogen storage characteristics of Ti-Cr-V alloys. Journal of Alloys and Compounds. 1999; 288:294-298. http://dx.doi.org/10.1016/ S0925-8388(99)00096-1
3. Santos DS, Bououdina M and Fruchart D. Structural and thermodynamic properties of the pseudo-binary TiCr2-xVx compounds with 0.0 ≤ x ≤ 1.2. Journal of Alloys and Compounds. 2002; 340:101-107.
4. Santos DS, Bououdina M and Fruchart D. Structural and hydrogenation properties of an 80 wt. (%) TiCr1.1V0.9-20%LaNi5 composite material. International Journal of Hydrogen Energy. 2003; 28:1237-1241. http://dx.doi.org/10.1016/ S0360-3199(03)00006-5
5. S a n t o s S F a n d H u o t J . H y d r o g e n s t o r a g e i n TiCr1.2(FeV)x BCC solid solutions. Journal of Alloys and Compounds. 2009; 472:247-251. http://dx.doi.org/10.1016/j. jallcom.2008.04.062
6. Chen L, Li L, Wang X, Dai F, Zheng F and Lei Y. Phase structures and electrochemical properties of V2.1TiNi0.4Zrx(x = 0 – 0.06) hydrogen storage electrode alloys. Acta Physico-Chmica Sinica. 2006; 22:523-527. http://dx.doi.org/10.1016/ S1872-1508(06)60018-1