Dissertação de candidatura ao grau de mestre em Medicina, submetida ao Instituto de Ciências Biomédicas Abel Salazar, da Universidade do Porto
- Projeto de Investigação
Título: Depressive symptoms and Quality of Life in Higher Education Students
Autor: João Gonçalo Gomes de Oliveira Ribeiro Eiras1
Orientadora: Profª Doutora Paula Maria Figueiredo Pinto de Freitas2
Afiliação: Instituto de Ciências Biomédicas Abel Salazar, Universidade do Porto Centro Hospitalar do Porto
Porto, 1 de Junho 2018
1 Aluno do 6º ano profissionalizante do Mestrado Integrado em Medicina, Instituto de Ciências Biomédicas Abel Salazar, Universidade do Porto; número de aluno: 201200002.
Endereço eletrónico: [email protected]
2 Professora Auxiliar no Instituto de Ciências Biomédicas de Abel Salazar, Universidade do Porto Endereço eletrónico: [email protected]
Acknowledgments
À Dra. Paula Freitas, que acreditou no projeto, pelo empenho, profissionalismo, pela cordialidade e amizade com que sempre me recebeu e me auxiliou nas dúvidas que foram surgindo aquando da redação da dissertação.
À Dra. Maria Cristina Canavarro, Dra. Cláudia Melo e ao Grupo Português de Avaliação da Qualidade de Vida, pela amabilidade e disponibilidade em fornecer a versão para português de Portugal do instrumento WHOQOL-Bref, o seu manual de aplicação e cotação e a sintaxe para utilização no pacote estatístico SPSS®, ferramentas essenciais para a realização deste projeto.
À Dra. Sara Margarida que ao longo do meu percurso académico, consciente ou subconscientemente, criou esta ideia de estudar e posteriormente proteger a saúde mental nos estudantes icbasianos, e que levou à criação da ideia inicial deste projeto.
À Dra. Joana Moura que me ensinou que “a vida está, como deve estar”.
ii
Dedication
À minha família, por estar sempre lá, apesar de eu não estar sempre presente. Obrigado pela paciência quando ouviam os desabafos, pelas palavras de conforto, pela educação, e por todo o amor e carinho. Foram vocês quem me dotou com as bases para atingir os meus objetivos, que me tornaram na pessoa que sou hoje e me trouxe até esta etapa.
Aos meus amigos, que ouviram as histórias, as piadas e as descompensações próprias de quem está neste percurso, que é o certo, mas em que o futuro é uma incerteza. São irmãos/fratellis, uma lufada de ar fresco e uma chamada de atenção, e o sopapo que às vezes precisava de receber para que nos desvios, voltasse ao caminho certo.
Resumo
IntroduçãoA Organização Mundial de Saúde (OMS) reconheceu os transtornos mentais comuns como duas categorias diagnósticas diferentes: transtornos depressivos e transtornos de ansiedade. De acordo com estudos recentes, além dos médicos, os estudantes de Medicina têm taxas mais elevadas de depressão em comparação com a população geral em idade correspondente.
Resumindo, apesar de ser uma condição de saúde tão importante, não existem muitos estudos sobre este assunto em Portugal.
Objetivos
Confirmar o maior risco de depressão entre os estudantes de Medicina. Avaliar as variações dos sintomas depressivos ao longo do 1º, 3º e 6º anos do Mestrado Integrado em Medicina (MIM) e do 1º, 3º e 5º anos do Mestrado Integrado em Medicina Veterinária (MIMV). Averiguar se existe uma relação entre Qualidade de Vida e Sintomatologia Depressiva.
Materiais e Métodos
Uma amostra de 219 estudantes do ICBAS, 158 do MIM e 61 do MIMV, responderam a um inquérito online anónimo que incluiu perguntas sobre variáveis demográficas e duas escalas para avaliação da depressão e da qualidade de vida: o Índice de Depressão de Beck (BDI) e o WHOQOL-Bref, ambos validados em português, de Portugal. As análises estatísticas foram realizadas recorrendo ao SPSS®. Os resultados foram considerados significativos com p<0,05.
Resultados
Na nossa amostra, cerca de 40% de todos os estudantes apresentam sintomatologia depressiva, sendo que 22% era moderada a grave. Não observamos diferenças estatisticamente significativas entre géneros nos índices de depressão, mas constatou-se que nos estudantes de Medicina Veterinária havia um aumento gradual dos valores de IDB ao longo do curso, assim como índices mais baixos de QOL, ambos associados a baixas expetativas de acesso ao mercado de trabalho. Para além disso, os estudantes com mais de 23, independentemente do curso, possuíam índices de depressão mais elevados.
Na verdade, o score total da sintomatologia depressiva correlaciona-se de forma negativa e significativa com todos os domínios da qualidade de vida, e quanto maior a qualidade de vida, menor o Índice de Depressão de Beck.
Conclusões
iv
com vista à sua deteção e intervenção precoces, evitando possíveis consequências graves.
Keywords: Estudantes de Medicina, Medicina Veterinária, Transtornos Depressivos, Sintomas Depressivos, Qualidade de Vida.
Abstract
IntroductionThe World Health Organization (WHO) has recognized Common mental disorders as two different diagnostic categories: depressive disorders and anxiety disorders. According to recent studies, in addition to medical doctors, medical students have higher rates of depression compared to age-matched general population.
To sum up, despite being such an important health condition there aren’t many studies regarding this subject in Portugal.
Aims
Confirm the increased risk of depression among Medical students. Evaluate the variations of depression symptoms among the students from the 1st, 3rd and 6th years of the Integrated Master Degree in Medicine and from the 1st, 3rd and 5th years of the Integrated Master Degree in Veterinary Medicine. Analyze if there is a relation between QOL and Depressive Symptomatology.
Material and Methods
A total sample of 219 students from ICBAS, 158 studying Medicine and 61 studying Veterinary Medicine, answered to an anonymous online survey that included questions on demographic variables and two scales for assessing depression and quality of life: respectively Beck Depression Index (BDI) and the WHOQOL- Bref, both validated in Portuguese, from Portugal. Statistical analyzes were performed using SPSS®. The results were considered significant with p <0.05..
Results
About 40% of all students in this sample had depressive symptomatology, with 22% being moderate to severe. We did not observe statistically significant differences among the genders in the indices of depression, but it was found that there was a gradual increase in BDI values throughout the course of Veterinary Medicine, as well as lower QOL indices associated with low expectations of access the labor market. In addition, students over 23, regardless of course, had higher rates of depression.
In fact, the overall score of depressive symptomatology correlates negatively and significantly with all domains of quality of life, and the higher the quality of life, the lower the Beck Depression Index.
Conclusions
vi
detection and intervention, avoiding possible serious consequences.
Keywords: Medical Students, Veterinary Medicine, Depressive Disorders, Depressive Symptoms, Quality of Life.
Abbreviations and Acronyms
BDI, Beck Depression IndexICBAS, Instituto de Ciências Biomédicas Abel Salazar MIM, Mestrado Integrado em Medicina
MIMV, Mestrado Integrado em Medicina Veterinária QOL, Quality of Life
SPSS, Statistical Package for Social Sciences software WHO, World Health Organization
viii
Index
Acknowledgments ... i List of Tables ... ix List of Graphs ... x Introdution ... 1 Methodology ... 2Characteristics of the Study ... 2
Sample Size and Characteristics ... 2
Instruments ... 2 Gathering of Data ... 3 Study Variables ... 3 Literature research. ... 3 Statistical Analysis ... 3 Results ... 5
The depressive symptomatology in students ... 9
The Quality of Life in students ... 13
Discussion ... 15
Conclusions/Suggestions ... 18
References ... 19
Appendix ... 21
Appendix 1 – Online questionnaire ... 21
Appendix II – Approval of the ICBAS ethics committee for the implementation of the survey ... 33
List of Tables
Table 1 - Sample social characterization ... 7
Table 2 - BDI according to the sample characteristics ... 12
Table 3 - Quality of life according to gender, age and course ... 13
Table 4 - Quality of Life according to the Course and year of attendance. ... 13
Table 5 - Correlations between BDI Score, Degree of difficulty of the current degree and Expectations of access to the labor market and the Quality of Life obtained by WHOQOL – BREF. ... 14
x
List of Graphs
Graph 1 - Total number of students per course and number of participants in the survey. ... 5
Graph 2 - Distribution of participants per year and per course ... 6
Graph 3 - Distribution of participants by sex. ... 6
Graph 5 - Distribution of participants by age ... 7
Graph 5 - Distribution of participants by Marital state ... 7
Graph 6 - Perceptions Regarding the current Course and the Future ... 8
Graph 7 - Feeling of certainty about being on the right course ... 9
Graph 8 - Histogram for BDI Score ... 9
Graph 9 - General distribution of the sample according to the intensity of the depressive symptomatology ... 10
Graph 10 - Histograms for the BDI Score per course ... 10
Graph 11 - Depressive symptomatology according to sex ... 11
Introdution
Mental health is on the public health agenda all over the world. It is now known that mental disorders affect all age groups and are responsible for sizeable social and economic costs 1.
Common mental disorders refer to two main diagnostic categories: depressive disorders and anxiety disorders. In fact, Mental Health is more than the absence of mental illness. There are many aspects that contribute to that, and an important one is the idea of Quality of Life (QOL), which is described as an individuals’ perceptions of their position in life in the context of the culture and value systems in which they live, and in relation to their goals, expectations, standards and concerns 2.
A Higher education student finds himself in a critical development period of transition between adolescence and adulthood 3. Besides, medical studies are recognized as one of the most difficult
studies around the world 4,5 so it’s normal to assume that medical students have higher levels of
depressive symptoms than the general population 6,7. The rate of depression or anxiety in medical
students ranged from 9.2% to 38.2%. 6,8,9,10 and studies suggest that depression is higher in female
medical students 11,12.
In this respect, there appears to be a relationship between the course year and severity of mental disorders.13 Many factors, including academic stress and workload 14,15 both playing a major
role in this interrelationship, most likely stemming from the frequent exposure to pain, suffering and death 16.
So, nowadays there’s a need to assess this risk among other university degrees such as the ones related to Medical Sciences. With that in mind, the objectives of this study are confirming the increased risk of depression among Medical students, evaluate the variations of depression symptoms among the students from the 1st, 3rd and 6th years of the Integrated Master’s in Medicine and from the 1st, 3rd and 5th years of the Integrated Master’s in Veterinary Medicine and to analyze the relation between QOL and Depressive Symptomatology.
Regarding the previous objectives, I formulate the following Hypothesis: 1ª There are different values of Depression prevalence in both courses.
2ª There are evidences of a relation between the curricular year and the risk for depression 3ª There are demographic factors, as gender, satisfaction with the course and others, that contribute to Depression.
2
Methodology
Characteristics of the Study
It’s a transversal study which combined observacional-quantitive data with qualitative information regarding demographic aspects of the participants.
Sample Size and Characteristics
The minimal sample size for each year of each course was calculated using StatCalc from EpiInfo® - Version 6 software, with an expected pathology frequency of 23.7% (the mean of the depression or anxiety rates referred previously: 9.2% and 38.2%), a maximum incidence rate of 38.2% and a Confidence level of 95%. The results were:
• 18 students from Medicine;
• 16 students from Veterinary Medicine.
The total number of students attending Medicine is 546 (1st year – 137, 3rd year – 206, 6th year – 203), while those attending Veterinary Medicine are 175 (1st year – 63, 3rd year – 58, 5th year – 54).
Inclusion Criteria: being a Portuguese student enrolled in ICBAS, being a student from the 1st, 3rd and 6th year of Medicine or 1st, 3rd and 5th year of Veterinary Medicine
and accepting participation in the online inquiry.
Exclusion Criteria: incomplete filling of the online Inquiry
Instruments
For this study, a questionnaire was used as research instrument consisting of a first part related to the socio-demographic data of the individual, a second part referring to the Beck Depression Inventory – IDB and a third part consisting on WHOQOL-Bref.
The socio-demographic data include information on: age, gender, course attended, curricular year, satisfaction with the course, among others.
Beck Depression Inventory - IDB: created originally in 1961 by Aaron T. Beck but since then there have been some changes to the original scale, and was originally validated to Portuguese of Portugal by Vaz Serra and then by Coelho et al. in 2002 17.
With its 21 Likert type questions referring to symptoms and cognitive attitudes, BDI is still one of the most useful self-report rating inventory that measures characteristic attitudes and symptoms of depression 18 . Each item is organized on a 4-point scale (0 -
of the IDB, corresponding to the degree of severity of the depressive symptomatology of 63 points. Its main objective is to measure the presence of depressive symptomatology, but when applied alone, it has no capacity to perform a clinical diagnosis of Depression
19. In the present study, the following cutoff points were established: absence of
symptoms: 0 to 9; mild symptomatology: 10 to 15; moderate symptomatology: 16 to 19; moderate to severe symptomatology: 20 to 29; severe symptomatology: 30 to 63, similar to the cutoff points used in the study by Figueiredo et al. 20.
WHOQOL – Bref: it’s composed of 26 Likert type questions, organized on a 5-point scale; 2 questions related to the self perception of quality of life and health and the other 24 questions are specific to the 4 domains of the original instrument: Physical health, Psychological well-being, Social connections and Environment 21 .
Gathering of Data
The questionnaire was constructed using the informative software "Google Docs – Formulários®" with the possibility of meeting the criteria of anonymity, that is, inability to relate the answers obtained with the respective e-mail address or other personal information of the student.
The link referent to the questionnaire, later, sent to the students via Year Commissions representatives and Social Networks such as each year and course specific Facebook group, and remained active between the 11th of March until the12th of
April 2018.
Study Variables
Independent variables: Socio-demographic: course attended, sex; Year of course. Personal: satisfaction with the course; change normal residence to attend the current University course, contact with family, difficulty of the current course, expectations of access to the job market, feelings regarding being in the right course.
Dependent variables: Depressive symptomatology measured by BDI and QOL measured by WHOQOL-Bref.
Literature research.
It was carried out from several databases, among them: PubMED, Scielo, directories of several national Medical and Psychology faculties of the country, among others.
Statistical Analysis
4
Sciences® (SPSS - version 24.0 for Windows). Initially, descriptive statistical techniques (frequencies, percentages, medians, means and standard deviations) and statistical inference analyzes of the hypotheses were used, using the Chi-square independence test (X2), for a probability of type error I (α) of 0.05.
Results
Socio-demographic data Description
The students enrolled in Medicine account for more than half of the sample (72.1%) whereas the Veterinary Medicine students represent only 27.9% of the sample.
In the universe of students (N = 721), only 30.4% (n = 219) answered to the survey. Regarding the percentages within each course: out of the total of Medicine students (n=546), the percentage of medical students who answered the survey was 28.9%, and in Veterinary Medicine (n=175), 34.8% answered.
Medicine Veterinary Medicine
Total 546 175 Sample 158 61 0 100 200 300 400 500 600 N u m b er o f I n d iv id u als Total Sample
6 Graph 2 - Distribution of participants per year and per course
The number of participants in each year of each course is heterogeneous, with great discrepancies especially in the medical students who were more participative, especially those from the sixth year. For the remaining years, the differences are not so marked.
Graph 3 - Distribution of participants by sex.
There is a clear predominance of females globally.
1st Year 3rd Year 5th Year Veterinary Medicine / 6th Year Medicine Medicine 32 46 80 Veterinary Medicine 16 25 20 0 10 20 30 40 50 60 70 80 90 Num ber o f In di vidu al s Male 18% Female 82%
Sex
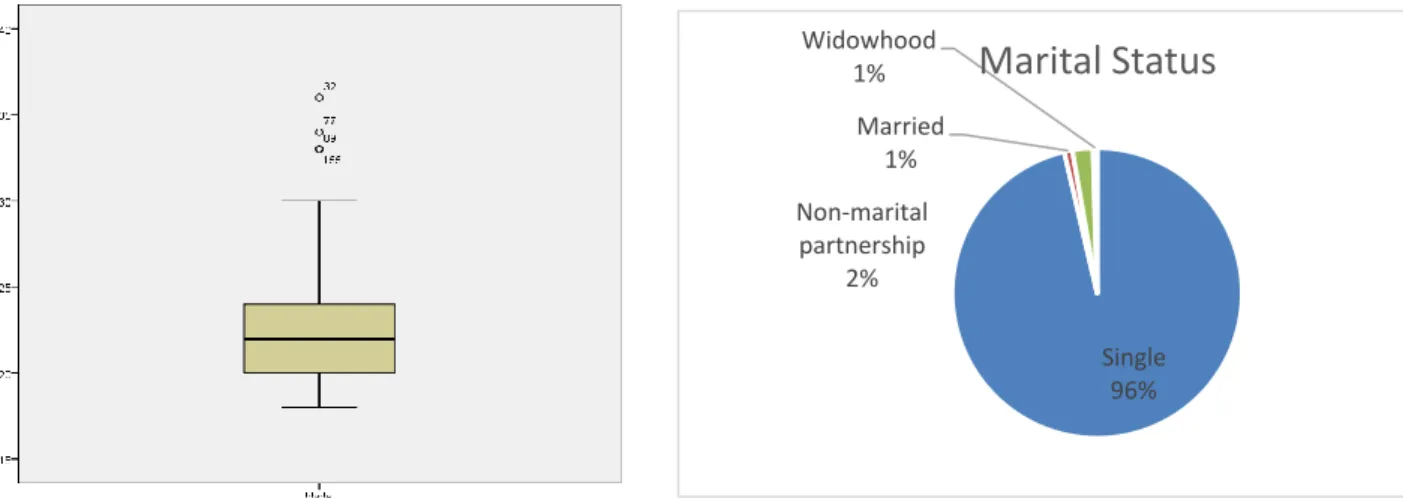
Most of our participants are women (82%), single (96%), with a mean age of 22.30 years (standard deviation 3.05 years). There are 4 outliers with disproportionately higher ages, not accounted to calculate the mean age. There were no significant differences between Medicine and Veterinary Medicine, regarding the variable “age” neither “marital status”.
Table 1 - Sample social characterization
Yes
No
Do you keep in touch with your family?
217
(99.1%)
2
(0.9%)
Did you change your residence to attend the current
University course?
91
(41.6%)
128
(58.4%)
Have you ever completed another undergraduate
degree(s)?
26
(11.9%)
193
(88.1%)
According to the results, 91 (42%) students changed their residence to attend University.even if more than 99% of the students maintain regular contact with their family. Twenty-Six students (11.9%) had already completed another degree without significant statistical differences between Medicine and Veterinary Medicine.
Single 96% Married 1% Non-marital partnership 2% Widowhood 1%
Marital Status
Graph 5 - Distribution of participants by Marital state Graph 5 - Distribution of participants by age
8
Regarding the degree of satisfaction with the current course, only 22 (10%) students reported that it was Low or Very low and more than half (67.6%) were satisfied or very satisfied. Most students 84% (n=184) considered their current course as having a High or Very high degree of difficulty. Expectations of access to the labor market are Low or Very low in 13.7% (n=30), in contrast to the 41.5% who are more confident and meet high or very high expectations regarding the future. Students enrolled in Veterinary Medicine were more pessimistic about the future, with lower expectation to access the labor market compared to medical students (p <0.05).There were no significant statistical differences between Medicine and Veterinary Medicine regarding Satisfaction with the current course neither regarding its degree of difficulty.
11 1 8 11 1 22 49 33 98 104 133 71 44 51 20 0 20 40 60 80 100 120 140
Degree of satisfaction with the course
Degree of difficulty of the current course
Expectations of access to the labor market To ta l Re sp o n se s
Very Low Low Medium High Very High
Most students (71%) felt that they were on the right Course. There were no significant statistical differences between Medicine and Veterinary Medicine.
The depressive symptomatology in students
Never 2% Almost never 3% Sometimes 24% A lot of times 42% Always 29%
"I'm on the right Professional Course?"
Graph 7 - Feeling of certainty about being on the right course
10
test of adherence to normality, Kolmogorov-Smirnov is less than 0.001, therefore rejecting the hypothesis of population normality.
Graph 9 - General distribution of the sample according to the intensity of the depressive symptomatology
When analyzing the intensity of depressive symptoms in a global perspective, we can observe that 40% of the students have some degree of depressive symptomatology, where 18% have Minimal intensity. However, it should be noted that 22% of students have an intensity ranging from moderate to high.
The histograms by course also show that the distribution is not normal. Although the frequency distribution seems similar for both courses, the average of depressive symptomatology (BDI score) is higher for the students who study in the Integrated Master's Degree in Veterinary Medicine. This information is also confirmed when we correlate the BDI score with the current course (p < 0.01). 60% 18% 9% 9% 4%
Beck Depression Index results
Absence of depression Minimal Depression Moderate depression
Moderate to severe depression Severe depression
Medicine Veterinary
Medicine
The percentages of depressive symptomatology are not homogeneous, with a female predisposition for absence of symptomatology or for reduced intensities. On the other hand, males have higher values of moderate to severe symptoms, however the differences are not statistically significant, with p value > 0.05.
58 15 28 61 19 20 0 10 20 30 40 50 60 70
Absense of Depression Minimal Depression Moderate to Severe Depression Perc en t BDI Male Female 6,8 8,7 9,9 12,3 9,4 15,8 0 2 4 6 8 10 12 14 16 18
Medicine Veterinary Medicine
Me
an
o
f BDI
Score
1st Year 2nd Year 3rd Year
Graph 11 - Depressive symptomatology according to sex
12
courses, in which, Veterinary Medicine has higher values per each year. Actually, there is a gradual increase of the BDI values as the years go by in the course of Veterinary Medicine; on the other hand, in Medicine there is an increase after the first year, with third year presenting higher values than the 6th.
The differences comparing BDI and courses are statistically significant, with p-value <0.01.
Table 2 - BDI according to the sample characteristics
Absence of Depression Minimal Depression Moderate to severe Depression Age <23 years (n=158) 64,6% 17,7% 17,7% >/=23 years (n=60) 50,0% 18,3% 31,7% Studying Course Medicine (n=158) 64,6% 17,1% 18,3% Veterinary Medicine (n=60) 50,0% 20,0% 30,0%
Degree of satisfaction with the current course
Very Low (n=11) 72,7% 9,1% 18,2%
Low (n=11) 27,3% 27,3% 45,5%
Medium (n=49) 49,0% 16,3% 34,7%
High (n=103) 56,3% 22,3% 21,4%
Very High (n=44) 88,6% 9,1% 2,3%
Expectations of access to the labor market
Very Low (n=8) 0,0% 25,0% 75,0%
Low (n=22) 22,7% 36,4% 40,9%
Medium (n=98) 69,4% 14,3% 16,3%
High (n=70) 65,7% 18,6% 15,6%
Very High (n=20) 65,0% 10,0% 25,0%
The percentage of depressive symptomatology in patients younger than 23 years is 35.4%; on the other hand, at higher ages, the relative frequency increases to 50% (confirmed by a p-value<0.05). After statistical analysis, it was obtained that 50% of the students of Veterinary Medicine presented with Depressive symptomatology, of which of these 30% was Moderate to Severe. On the other hand, 35.4% of medical students also present some depressive symptomatology, 18.3% of which was moderate to severe.
Concerning the degree of satisfaction with the current course, students who had a Very High degree of satisfaction had a Depression rate of 11.4%, while those with a Very low degree had a relative rate of 27.3% (with p-value<0.01). Regarding expectations of acess to labor market, students with “Very High” expectations had relative frequencies of depressive symptomatology equal to 35% and those who pronounce more pessimistic about the future, with “Very Low” expectations, have a depressive rate of 100% (with p<0.01).
The Quality of Life in students
Table 3 - Quality of life according to gender, age and courseThose who are over 23 years of age and those who attend the Integrated Master’s Degree in Medicine have higher average quality of life in all domains. In fact, being female apparently represents a higher quality of life in all domains except the psychological one. However, there are only statistical significant differences when we correlate the QOL with de course, showing lower levels of QOL in students enrolled in Veterinary Medicine.
Table 4 - Quality of Life according to the Course and year of attendance.
Medicine Veterinary Medicine Mean Standard Deviation Mean
Standard Deviation 1 st Ye a r BDI Score 6,8 6,4 8,7 7,5 General 16,5 2,4 16,6 2,6 Physical health 16,3 2,1 15,3 2,5 Psychological 15,7 2,3 14,5 2,8 Social relationships 16,0 3,1 13,7 3,5 Environment 16,4 2,4 15,7 2,6 3 rd Ye a r BDI Score 9,9 8,9 12,3 9,4 General 15,9 3,8 14,9 3,3 Physical health 15,3 3,0 14,5 2,5 Psychological 14,0 3,2 13,4 3,0 Social relationships 13,9 3,8 13,2 3,6 Environment 15,5 2,8 14,8 2,8 th Ye a r Ve t. e d ic in e / 6 th a r M e d ic in e BDI Score 9,4 6,9 15,8 11,2 General Geral 15,4 2,9 13,9 3,8 Physical health 15,5 2,2 14,7 2,1 Psychological Domínio psicológico 14,1 2,6 11,9 3,0
General Physical health Psychological Social relationships Environment Mean Standard deviation Mean Standard deviation Mean Standard deviation Mean Standard deviation Mean Standard deviation TOTAL 15,55 3,21 15,39 2,46 14,04 2,92 14,22 3,57 15,59 2,52 Sex Male 14,90 3,36 15,23 2,60 14,63 3,06 13,90 3,79 15,51 2,42 Female 15,70 3,17 15,43 2,43 13,91 2,89 14,29 3,53 15,61 2,55 Age </= 23 years 16,03 2,96 15,54 2,42 14,32 2,94 14,35 3,68 15,78 2,38 >23 years 14,33 3,52 15,00 2,52 13,31 2,78 13,86 3,29 15,11 2,83 Course Medicine 15,76 3,11 15,63 2,46 14,38 2,80 14,56 3,44 15,89 2,38 Veterinary Medicine 15,02 3,44 14,77 2,35 13,17 3,09 13,33 3,79 14,84 2,74
14
Also here, those who attend the Integrated Master Degree in Medicine have higher average quality of life in all domains, despite the year. In fact, in Veterinary Medicine, there is a gradual decrease in quality of life indices as the years go by, something that does not happen in Medicine.
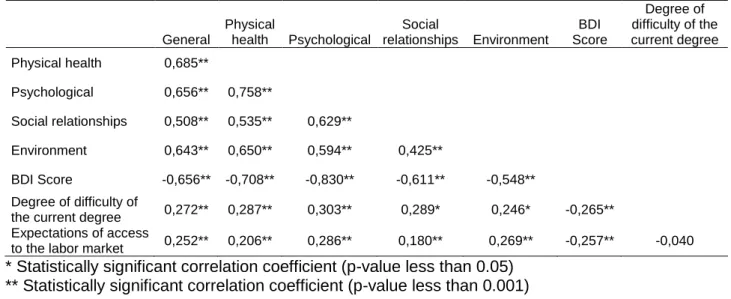
Table 5 - Correlations between BDI Score, Degree of difficulty of the current degree and Expectations of access to the labor market and the Quality of Life obtained by WHOQOL – BREF.
General Physical health Psychological Social relationships Environment BDI Score Degree of difficulty of the current degree Physical health 0,685** Psychological 0,656** 0,758** Social relationships 0,508** 0,535** 0,629** Environment 0,643** 0,650** 0,594** 0,425** BDI Score -0,656** -0,708** -0,830** -0,611** -0,548** Degree of difficulty of
the current degree 0,272** 0,287** 0,303** 0,289* 0,246* -0,265** Expectations of access
to the labor market 0,252** 0,206** 0,286** 0,180** 0,269** -0,257** -0,040 * Statistically significant correlation coefficient (p-value less than 0.05)
** Statistically significant correlation coefficient (p-value less than 0.001)
There is a positive linear correlation between expectations of access to the labor market and quality of life (in all domains), with reciprocal increases from one part to another. The same situation happens between the degree of satisfaction with the current degree and the domains of Quality of Life. On the other hand, there are negative correlations when the crossing of satisfaction with the actual degree and the future expectations is done with Beck's depressive index.
*Statistically significant correlation coefficient (p-value less than 0.05); **Statistically significant correlation coefficient (p-value less than 0.001).
Discussion
Mental health is as important as physical health to the overall well-being of individuals, societies and countries. Advances in neuroscience and behavioural medicine have shown that, like many physical illnesses, mental and behavioural disorders are the result of a complex interaction between biological, psychological and social factors.22 Though there are effective treatments
available, these disorders are infrequently recognized and managed, in fact, according to recent data, at least one in five people will suffer from depression at some point in their lives. However, there are no population-based data available to allow reliable establishment of the prevalence of various types of depressive disorder in Portugal. 23
In the present study there was a lower student adherence in Medicine despite reaching the minimum predefined sample sizes in both courses. The majority of participants were women (82%), and single. It is a population in which approximately 60% of the respondents needed to change residence in order to study in the university.
The present study shows a high prevalence of depressive symptoms in the students (40%), and 22% with moderate to severe symptomatology.
Several studies have used the BDI in university students, patenting heterogeneous prevalence rates, ranging from 9.2% to 38.2%. 6,8–10. Such contrasts are mainly due to different cut-off points used to consider the presence of symptoms 20 .
According to a study conducted at the Universidade da Beira Interior, the prevalence of Depressive Symptomatology was also high and very similar to that obtained in this study, around 42%. 24
A very important fact is the percentage of moderate to high depressive symptomatology, which corresponds to approximately a quarter of the sample (22%) but in this study we didn’t find statistical differences between sexes. The average of depressive symptomatology (BDI score) is higher for the students who study in the Integrated Master's Degree in Veterinary Medicine and increases as the years go by in this course, and the differences are statistical significant.
Regarding the results obtained in the QOL, medical students have a better quality of life, compared to those studying veterinary medicine. In these, the quality of life worsens throughout the course. But, it is important to highlight that, once again there weren’t statistical differences between sexes regarding levels of QOL.
To conclude, the overall score of depressive symptomatology correlates negatively and significantly with all domains of quality of life.
Concerning our first Hypothesis, it was found that Veterinary Medicine students have the highest proportion of individuals with depressive symptoms. These results contradict many of the latest literature data that show that Medicine students are more likely to acquire depressive disorders
16
Veterinary Medicine students or having lower expectations regarding the future on accessing the labor market, as we saw. The results obtained show that the existence of depressive symptomatology it is not exclusive to medical students, and the fact that the students of Veterinary Medicine had higher prevalence values, stresses the importance of promoting the performance of similar work with a view to the current clarification of the affective disturbances in the students of other courses. 24
As to the second hypothesis, the literature states that there is an increase in the prevalence of symptoms from the basic years to the clinical years. 25,26. These results were also verified here,
with an increase in the prevalence from the 1st to the 3rd and 6th years, with a higher prevalence in the 3rd year in Medicine, compatible with the results obtained by Roberto A. R. (2009). 27 One way
to improve these results is to modify the curricular curriculum of the 3rd year. In Veterinary Medicine it was observed, what it seems to be an increasing trend in the manifestation of symptoms throughout the curricular years. Some questions may arise here as dissatisfaction with the course, weak expectations regarding the future, excessive academic pressure, among other possible causes. It will be important to continue to review this evolution in future work.
Concerning the third hypothesis, males presented a higher proportion of students with moderate to severe symptoms. However there are no statistical differences between sexes which is not consistent with the information obtained in the literature, where it was found a significant association between the female sex and a higher prevalence of symptoms. 11,12 With regard to
investigating whether there are differences in the presentation of symptoms according to the age group, there was an increase in the proportion of individuals with symptoms from the age of 23 years. The manifestation of symptoms is also a reflection of the satisfaction of the course attended and the expectations of access to the Labor Market. Thus, it will be logical to think that there will be a greater manifestation of depressive symptoms in individuals with less expectations of access to the labor market. 28 In the present study, in relation to the expectations of access to the labor market, also
comes to the literature, with statistical significant differences, regarding the presence of symptoms among those who rate as "very high" and those who perceive as "very low" (35% vs. 100 %, respectively);
Finally, referring to the 4th hypothesis, as was previously mentioned the total score of depressive symptomatology correlates negatively and significantly with all domains of quality of life, and the higher the quality of life the lower the Beck Depressive Index. In fact, it was expected to be an inverse relationship between QOL and BDI. However, it is impossible to know the cause-effect relationship between these variables, that is, if a high BDI value causes a lower QOL result, or vice versa.
Limitations of the study
Cross-sectional study: only evaluates the presence of depressive symptomatology at a given time and not in a continuous way. Incidentally, the opening of the surveys coincided with the exams season and as such the results obtained may have been influenced by this reason.
Extension of the survey: consisting of 62 questions in all, may have limited the people willing to answer.
Cut-off point: the IDB score ≥ 10 points may have somehow overestimated the prevalence rates found.
Mode of application of the survey via online may have selected the participants at the outset. Interpretation of results: the values obtained provide only indirect information on the presence of depressive symptoms, since they are based on a measure of self-report made by the student. Moreover, given that it is an anonymous inquiry, there is no way to gauge the veracity of the answers. Impossibility of generalization: the results correspond only to ICBAS students, with a very specific type of pedagogical model, which may limit their generalization to students from other areas of health at national level, as well as from other scientific areas.
18
Conclusions/Suggestions
To sum up, this study confirmed that depression affects a significant proportion of Higher Education students, regardless the gender but mainly those older than 23 years or with low expectations to access the labor market. In fact, Veterinary medicine students have higher levels of depression and there is a trend in the manifestation of symptoms throughout the curricular years, associated with lower Quality of Life.
This paper works as a wakeup call and reinforces the idea that the existence of depressive symptoms in university students is a reality that should not go unnoticed and stresses the importance of carrying out similar studies with a view to their early detection and intervention, thus preventing possible negative consequences, especially suicide. The current Higher Education students will be future workers, and in particular, medical students will be future doctors and need to be protected from preventable causes of morbidity and mortality.
An interesting aspect to study in the future will be the relationship between the presence of depressive symptoms and certain behaviors: sleep pattern, eating disorders, suicidal ideation, self-medication, among others, with the objective of evaluating the evolution of depressive symptomatology over all years of the course and not just not at a specific moment. In addition, it is recommended that medical schools implement programs (such as stress management, psychoeducation, coping strategies, mindfulness programs, individual counselling and managing financial stressors and alcohol use) and curriculum modifications to contribute to lowering mental health problems. However, it is unrealistic to completely eliminate factors (e.g., stress) associated with mental health problems.
References
1. Campos A. C. Relatório da proposta do plano de acção para a reestruturação e desenvolvimento dos serviços de saúde mental em Portugal 2007/2016. Comissão Nacional para a Reestruturação dos Serviços de Saúde Mental. Ministério da Saúde. (2007).
2. WHOQOL Group. WHOQOL - Measuring Quality of Life. (1995).
3. Arnett, J. J. Emerging adulthood. A theory of development from the late teens through the twenties. Am. Psychol. 55, 469–480 (2000).
4. Jadoon, N. A., Yaqoob, R., Raza, A., Shehzad, M. A. & Zeshan, S. C. Anxiety and depression among medical students: a cross-sectional study. JPMA J. Pak. Med. Assoc. 60, 699–702 (2010).
5. Vaz, R. F., Mbajiorgu, E. F. & Acuda, S. W. A preliminary study of stress levels among first year medical students at the University of Zimbabwe. Cent. Afr. J. Med. 44, 214–219 (1998).
6. Dyrbye, L. N., Thomas, M. R. & Shanafelt, T. D. Systematic review of depression, anxiety, and other indicators of psychological distress among U.S. and Canadian medical students. Acad.
Med. J. Assoc. Am. Med. Coll. 81, 354–373 (2006).
7. Dyrbye, L. N., Thomas, M. R. & Shanafelt, T. D. Medical student distress: causes, consequences, and proposed solutions. Mayo Clin. Proc. 80, 1613–1622 (2005).
8. Moutinho Coentre, R. & Luisa Figueira, M. Depression and Suicidal Behavior in Medical Students: A Systematic Review. Curr. Psychiatry Rev. 11, 86–101 (2015).
9. Puthran, R., Zhang, M. W. B., Tam, W. W. & Ho, R. C. Prevalence of depression amongst medical students: a meta-analysis. Med. Educ. 50, 456–468 (2016).
10. Haldorsen, H., Bak, N. H., Dissing, A. & Petersson, B. Stress and symptoms of depression among medical students at the University of Copenhagen. Scand. J. Public Health 42, 89–95 (2014).
11. Schwenk, T. L., Davis, L. & Wimsatt, L. A. Depression, stigma, and suicidal ideation in medical students. JAMA 304, 1181–1190 (2010).
12. Thompson, D., Goebert, D. & Takeshita, J. A program for reducing depressive symptoms and suicidal ideation in medical students. Acad. Med. J. Assoc. Am. Med. Coll. 85, 1635–1639 (2010).
13. Clark, D. C. & Zeldow, P. B. Vicissitudes of depressed mood during four years of medical school.
JAMA 260, 2521–2528 (1988).
14. Smith, C. K., Peterson, D. F., Degenhardt, B. F. & Johnson, J. C. Depression, anxiety, and perceived hassles among entering medical students. Psychol. Health Med. 12, 31–39 (2007). 15. Ahmed, I., Banu, H., Al-Fageer, R. & Al-Suwaidi, R. Cognitive emotions: depression and anxiety
in medical students and staff. J. Crit. Care 24, e1-7 (2009).
16. Lee, J. & Graham, A. V. Students’ perception of medical school stress and their evaluation of a wellness elective. Med. Educ. 35, 652–659 (2001).
17. Coelho, R., Martins, A. & Barros, H. Clinical profiles relating gender and depressive symptoms among adolescents ascertained by the Beck Depression Inventory II. Eur. Psychiatry J. Assoc.
Eur. Psychiatr. 17, 222–226 (2002).
18. Beck, A. T., Ward, C. H., Mendelson, M., Mock, J. & Erbaugh, J. An inventory for measuring depression. Arch. Gen. Psychiatry 4, 561–571 (1961).
19. Kendall, P. C., Hollon, S. D., Beck, A. T., Hammen, C. L. & Ingram, R. E. Issues and recommendations regarding use of the Beck Depression Inventory. Cogn. Ther. Res. 11, 289– 299 (1987).
20. Figueiredo, A. C. M. R. de, Fernandes, S. M. G. C., Martins, C. C. E. & Ramalho, V. L. M. Supervisão: estilos, satisfação e sintomas depressivos em estagiários de psicologia. Psico-USF 12, 239–248 (2007).
21. Fleck, M. P. et al. Aplicação da versão em português do instrumento abreviado de avaliação da qualidade de vida ‘WHOQOL-bref’. Rev. Saúde Pública 34, 178–183 (2000).
22. World Health Organization (WHO). The World Health Report 2001: Mental Health: New
Understanding, New Hope. (2001).
20
24. Coutinho, F. A. F. Prevalência da sintomatologia depressiva nos estudantes da Faculdade de Ciências da Saúde da Universidade da Beira Interior. (Universidade da Beira Interior, 2010). 25. Baldassin, S., Alves, T. C. T. F., Andrade, A. G. & Martins, L. A. N. The characteristics of
depressive symptoms in medical education and training: cross-sectional study. BMC Med. Educ. 8:60, (2008).
26. Rosenthal, J. M. & Okie, S. White Coat, Mood Indigo — Depression in Medical School. N. Engl.
J. Med. 353, 1085–1088 (2005).
27. Roberto, A. R. A Saúde Mental dos Estudantes de Medicina da Universidade da Beira Interior. (Universidade da Beira Interior, 2009).
28. Abrão, C. B., Coelho, E. P. & Passos, L. B. da S. Prevalência de sintomas depressivos entre estudantes de medicina da Universidade Federal de Uberlândia. Rev. Bras. Educ. Médica 32, 315–323 (2008).
Appendix
Appendix II – Approval of the ICBAS ethics committee for the
implementation of the survey
34
Appendix III - Approval of the WHOQOL-Bref instrument version
for use
“Caro Dr. João Eiras,
Na sequência do seu pedido, envio, em anexo, o material relativo ao WHOQOL-Bref, nomeadamente:
-a versão para português de Portugal do instrumento WHOQOL-Bref; -manual de aplicação e cotação;
-sintaxe para utilização no pacote estatístico SPSS®.
Informação adicional poderá ser encontrada em http://www.fpce.uc.pt/saude/qv.htm .
P´lo Grupo Português de Avaliação da Qualidade de Vida Atenciosamente,