Regional Growth in Europe:
The Role of European and National Policies *
Fernanda Llussá
Universidade Nova de LisboaJosé Mário Lopes
Cornell University
November 2010
Abstract
We conduct a systematic study of the impact of European Union (EU) regional policies on regional economic growth that controls for national policies and geographic characteristics. Special care is taken in distinguishing between the impact of EU policies and of national policies on economic growth. Our empirical study tries to answer two different questions. First, is there convergence across EU regions, and if so, do regions converge to a common European steady-state or to a national one? Second, how do European and national policies affect regional growth? We find evidence of regional convergence at the national level but not at the European level. In addition we find that trade openness at the national level is associated with regional convergence while European regional policies contribute, though weakly, to regional convergence. Our results suggest that policies that foster market integration – and convergence to a common steady-state - such as the promotion of labour and capital movements across countries and common regulatory policies are as important for European-wide regional convergence as regional structural funds.
Keyword: National Policies, European Union Policies and regional growth JEL classification: D30, R11.
__________________________
(*) We would like to thank Carlos Végh, Luisa Lambertini and José Tavares for their comments, and all participants at the ASSET conference for their many suggestions. We would also like to thank the Fundação para a Ciência e Tecnologia for financial support. All remaining errors are the authors responsibility. Corresponding author. E-mail address:
1. Introduction
The European Union is a major experience in the coordination of economic policies. As European economic integration progressed through the implementation of a single market for goods, services and capital and the centralization of monetary policy in a European Central Bank, it becomes evident the experience of the European Union will be closely watched by other potential projects of real and monetary integration. Structural policies, and in particular policies aimed at mitigating regional economic disparities, are a key element of European policy and will be determinant, in the long-run, to an evaluation of the EU´s role. Over the course of the 1990´s, spending on structural funds sums up to 6.5 percent of annual Community GDP. As way of comparison, the Marshall aid program to post-war Europe was equivalent to 1 percent of US GDP per year and amounted cumulatively, over the years between 1948 to 1951 to 4 percent of US GDP.1
A key issue is whether increased integration will augment or mitigate income differences between European regions. Clemente et al. (2009) highlight that integration in the EU, especially for new members, explain a substantial fraction of subsequent country growth but this effect diminishes over time. Andrés et al. (2004) argue that for the case of OECD, convergence may be a fixture of the fact that the long-run features of countries are becoming more similar, a possible effect of integration. In the case of the EU, there remain marked differences among regions. On the one hand, income per capita is twice as variable between EU regions as between US states, measured either in terms of standard deviation or the ratio of the top to bottom decile.2 Regional unemployment rates across EU regions vary by a factor of ten and more importantly, these differences are extremely persistent in time, unlike what occurs for the US. Easterly,
1 European Commission (2004). 2 See Martin (2001).
Ritzen and Woolcock (2006) show that building social cohesion such as income inequality is crucial for having high quality institutions and vital for economic growth. The requirements for an optimal currency area, as proposed in Mundell (1961), include the transiency of regional shocks: in contrast, many EU regions have experienced a fall in demand which they failed to recover from, entering what some termed as ''structural depression''. The low levels and low responsiveness of inter-regional migration is certainly part of the problem. EU regional policy has responded to and tried to address some of these regional imbalances. The crucial issue is whether EU regional policies have contributed to inter-regional convergence or not.3
The study of economic geography highlights the importance of increasing returns and trade costs as explanations for the location of economic activity, as in Krugman (1991). European integration can be characterized by a decrease in transaction costs resulting in an increase in the effective size of the market that may further unbalance the distribution of economic activity across Europe. If agglomeration forces dominate, industrial and high human capital tertiary activities will tend to concentrate in a few locations. This uneven distribution of geographical activities - even if it were efficient - raises serious concerns so that Europe has devised regional policies to combat the economic backwardness of some regions and the decline of others. There are at least three important objectives as far as regional policies in the EU are concerned: support for regions that are well below average income per capita4, support for industrial regions that experience high
unemployment and low employment growth and the incentive for agricultural regions to diversify.
3 National policies are naturally endogenous and depend on questions of social cohesion and income inequality, as ably pointed by Easterly et al. (2006), but here we will concentrate on the different roles of national and European polices, the novel issue at hand.
This paper conducts the first systematic study of the impact of different objectives of EU regional policy that controls for both economic policies at the national level and the geographic characteristics of the regions themselves. We answer two different questions. First, does EU regional policy further regional convergence across European regions? Second, what is the role of national policies and how important are these relative to EU policy? The literature has attempted to answer the first and second questions, though the answers are far from conclusive. To our knowledge there is no explicit study of the second question, namely as it potentially clarifies the relative importance of national and European policies. The literature so far is characterized by the use of very few control variables at the regional level and almost none at the national level. The time frame and the set of countries/regions studied have been limited. Since it is the countries that acceded the EU last - Greece, Portugal and Spain - that have the poorest regions, their exclusion is highly problematic and has been shown to influence results on convergence. Lastly, previous papers have not addressed the relative merits of the different EU regional objectives, nor their impact on regional growth when compared to national policies. The paper is divided into a literature review and motivation in section 2, the presentation and discussion of the empirical results in section 3 and the conclusion.
2. Regional Growth in the European Union 2.1. Are EU Regions Converging?
There is an extensive literature on regional convergence in Europe. The conclusions are, at best, mixed. The seminal study by Barro and Sala-i-Martin (1991) introduced ''Barro-type'' regressions to the analysis of regional convergence, with growth of income per capita explained by a set of control variables and the initial level of GDP. These authors examine regional growth in the 1950-1985 period, uncovering a convergence rate around 2% per year.
This is in line with previous results for country convergence, as in Barro (1991). Their sample, however, excluded Greek, Portuguese and Spanish regions, leading to sample selection bias as those regions are precisely the least prosperous in the EU.5 Later studies have extended the Barro and Sala-i-Martin (1991) sample to include Spanish regions - as in Sala-i-Sala-i-Martin (1996) - and Greece, Ireland, Luxembourg and Portugal - as in Armstrong (1995). These wider studies find a decrease in the convergence rate to 1.5 percent in the period 1950-1985 and 1 percent in 1970-1990, respectively. Carrington (2008) finds that while within neighborhoods of regions there was convergence at a rate close to the 2 percent mark in the cross-country literature, at the same time there was divergence between neighborhoods of regions, so the net convergence effect is close to nil. Other studies, such as Canova and Marcet (1995), which use fixed-effects estimators, find strong evidence of converging regional income levels. De la Fuente (2002) uses the same type of fixed-effects estimator and also finds high rates of regional convergence in the Spanish Regions.6 In sum, regional convergence among
European regions seems weaker than country convergence and seems to have decreased over time.
Another possible shortcoming of the papers above is their strong restrictions on the structure of the parameters, the ``Barro-type'' approach by assuming identical parameters in all regions and the fixed-effects estimator by allowing for differences in the intercept but nowhere else. Meliciani and Peracchi (2006) use median unbiased estimators of the regional convergence rate, estimating separate processes for each region, thus allowing for the model parameters to differ across regions. Compared to previous studies, they find a lower rate of convergence, zero for most regions. Twenty five out of ninety nine regions display positive convergence and these regions tend to be
5 And convergence may be stronger among already relatively prosperous regions, as suggested by the study of country convergence, where OECD countries experience stronger convergence than a more heterogeneous sample of countries.
located in the poor periphery: they are the Portuguese regions with the exception of the Algarve, Extremadura and Castilla-y-Léon in Spain, the Scottish regions and Northern Ireland in the United Kingdom, and a few regions in the south of Italy and the Center and West of France.
2.2. The Role of Country Policies
A second important issue is to assess the role of national policies for convergence across European regions. If the poorer countries in the EU pursue policies known to foster country growth, it is likely this will decrease divergence in income per capita among European regions. The potential importance of national policies for regional growth is suggested by the fact that regions in the same country tend to display similar growth rates, unlike what occurs between neighboring regions across national borders, as shown in Meliciani and Peracchi (2006).7 Ertur et al. (2006) analyze 138 European
regions in the 1980 - 1995 time span.8 They consider spatial correlation in the growth process of European regions and find that the average growth of a region is positively influenced by those of neighboring regions.
A strong intra-country correlation in regional growth rates may indicate that the diffusion of technology is mostly undertaken at the national level. But it also suggests there are common policies, at the national level, that strongly influence regional growth. Investment is one such policy. De la Fuente (2002a) suggests that public investment and education policies can advance regional convergence among Spanish regions. This author highlights the importance of employment performance to absorb the surplus of agricultural workers freed in poor regions as structural transformation proceeds.9
7 Meliciani and Peracchi (2006) find strong evidence in favor of homogeneity in growth rates within the same country. Most French differ in trend growth rates from Italian, Spanish, Portuguese, Irish and Luxembourg regions.
8 The countries considered are Portugal, Spain, France, Italy, Germany, the United Kingdom, Greece, Holland, Belgium, Luxembourg and Denmark.
In this study we consider different indicators of public and private expenditures that may have an impact on GDP growth. We consider government expenditure (including government subsidies and government consumption) as a share of GDP as a control variable. Countries with strong regional governments are likely to have a fair amount of subsidies granted by the central to the local governments and these may affect growth performance at the regional level. Subsidies granted to firms and individuals (for instance, the unemployed) may also have an important regional component. The same is true for government consumption, made up in the most part by public wage disbursements: in poorer regions of Italy, Spain and Portugal, for instance, public employment is a form of subsidizing the local economy. This may be positive or negative as far as growth is concerned. Adding the share of investment in GDP to our specification - including both private and public investment - controls for the role of capital formation in regional growth. Private investment may be encouraged (or substituted) by the disbursement of EU funds. On the other hand, public investment can also be affected in either direction. We also consider trade openness10 and school enrollment at the
primary level, an indicator of a country's commitment to education.11
2.3. Is There a Role for European Regional Policy?
Regional support is a key area in EU economic policy. The European Union has six major financial instruments to implement structural policies: the Regional Development Fund, the Social Fund, the EAGGF-Guidance fund, the Fisheries financial instrument, the Cohesion Fund and loans from the European Investment Bank (EIB). The structural funds operate within a common framework and, while initially allocated according to quotas, after 1989 a new system was put in place and clearer objectives were formulated.
10 An important recent paper which models endogenous growth to examine how fiscal policy relates to economic growth is Dhont and Heylen (2008).
11 A relevant issue is the degree of disaggregation. Boldrin and Canova (2000) discuss the use of NUTS1 to NUTS3 and consider none fully satisfactory as an aggregation level
The disbursement of funds around three specific objectives that are defined at the regional level use up to 85 percent of the global funding available. Objective 1 intends to promote an increase in income per capita in regions with less than 75 percent of European Union income and uses up to 70 percent of total funds available. Objective 2 is directed at propping up regions in severe industrial decline - with high unemployment levels and low employment growth – and uses about 11% percent of funds. Finally, Objective 5b is directed at rural regions with sparse population, using 4 percent of total funds.12
The resources available for these policies have increased dramatically, from 3.7 billion ECU in 1985 to 18.3 billion ECU in 1992 and then to 33 billion ECU in 1999, a dramatic almost ten-fold increase in just 15 years. This funding now represents about a third of total European Union expenditures and 0.45 percent of the EU´s gross domestic product.13 Objective 1 funding is
by far the most important regional disbursement and Portugal and Greece its main beneficiaries, followed by Spain and Italy. National matching funds constitute about half of total funds directed at the regions, and about two thirds of that are public matching funds. In addition to determining a large share of the EU budget, funds to European regions are also a very visible EU policy in all the beneficiary countries. Given its clear and stated objectives of promoting the development of the poorest European regions, it is important to evaluate and quantify, if possible, the impact these funds on regional growth and convergence across European regions.
Most of the studies on the growth of European regions have so far been conducted at the national level, and explicitly neglected the study of policies at both the regional and national levels. Others seem to have lumped
12 Together they attribute 15 percent of the funding. Objective 3 focuses on long-term and youth unemployment, Objective 4 assists in the adaptation of workers to industrial change, and Objective 5a promotes adjustment in the agricultural and fisheries sectors.
13 Cappelen et al. (2003) report that the average region in the EU received regional support of around 0.23 percent of income between 1980 and 1984, and 0.53 percent between 1989 and 1993.
together structural funds and physical capital, failing to distinguish between the two.14 De La Fuente (2002b) produced a first evaluation of the impact of EU's regional funds by examining the 1994 - 1999 Objective 1 Community Support Framework. This author makes strong assumptions concerning the relation between EU funds and the levels of public and private regional investment, namely that EU structural funds have the same impact as national investment of a similar nature.15 He then uses an aggregate production
function that depends on regional employment and the regional stocks of infrastructure, as well as physical capital and education, and shows that structural funds have a positive net contribution to convergence among Spanish regions.
Our study brings forth several distinct contributions. First, unlike previous studies, we examine convergence among European regions by highlighting the implications of considering a common steady-state level of per capita income, as opposed to a country-specific steady-state. As will become clear, this is a key assumption as far as empirical results go. Second, we consider different EU regional policy objectives to assess the relative merit of different policies. Thirdly, we explicitly estimate the regional impact of European and national policies.
3. Empirics
3.1. Data and Descriptive analysis
We have assembled a dataset combining information on economic and geographic indicators at the regional level – such as income per capita, income per capita growth, and indicators for border and non-border regions, for instance -, economic indicators at the national level – such as the degree of openness and primary school enrollment -, and, finally, indicator variables on
14 Such is the case in Roeger (1996).
15 The author suggests this may not be true as the lower cost of funds in European projects may encourage investments that do not yield positive net marginal value.
regional eligibility to different European Union regional policy initiatives. The basic data comes from the REGIO dataset at EUROSTAT, the most comprehensive source of regional data on economic and geographical indicators. The data covers a total of 194 NUTS 2 level European regions,16 in the period from 1989 to 1999. The choice of time period is key. As mentioned above, in 1989 a completely new system came into place, when clearer objectives were formulated for the use of regional funds. We focus on the three policy objectives with clear regional content. Objective 1 is aimed at regions lagging behind in terms of GDP per capita, defined as regions where GDP per capita is lower than 75 percent of the Community average. Objective 2 supports regions in industrial decline, as indicated by high unemployment and low employment growth. Objective 5b aims at rural regions, identified by a high share of employment in agriculture and GDP per capita.17 Regions eligible for Objective 1 comprise 24 percent of all regions, as
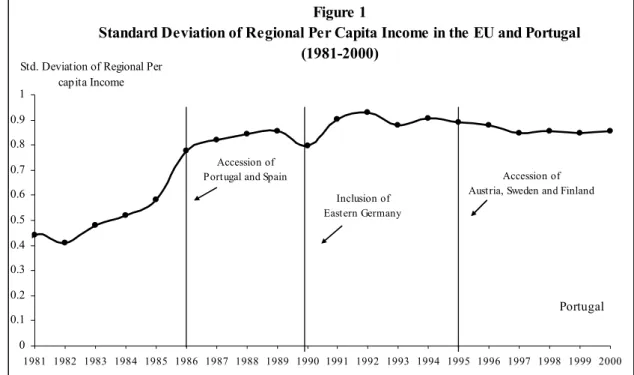
compared with 35 percent for Objective 2 and 44 percent for Objective 5. Figure 1 plots the standard deviation of regional per capita income in the European Union against the dates of its successive enlargement. In general enlargement has increased regional diversity through the accommodation of less developed peripheral regions in Southern Europe – Greece, Portugal, and Spain - and later, highly developed but also in a way peripheral regions in Sweden and Finland. As documented, income disparity at the regional increased substantial in the mid-1980´s and has then remained at the higher levels throughout.
16 That is: 11 for Belgium, 1 for Denmark, 37 for Germany, 13 for Greece, 18 for Spain, 22 for France, 20 for Italy, 1 for Luxembourg, 12 for Netherlands, 9 for Austria, 7 for Portugal, 6 for Finland, 6 for Sweden and 31 for the UK.
17 Analyzing regional eligibility for each objective rather than the amount of funds disbursed allows us to circumvent the issue of the interaction of EU and national investment. Extreme assumptions such as the perfect substitutability between EU and national funds as far as their effects on growth are not made. Rather we analyze the impact of eligibility on regional performance, as opposed to the amount and quality of funds disbursed. In this manner we attempt to evaluate the role of the EU policy itself, rather than the specific nature of the flow of funds to the regions..
0 0.1 0.2 0.3 0.4 0.5 0.6 0.7 0.8 0.9 1 1981 1982 1983 1984 1985 1986 1987 1988 1989 1990 1991 1992 1993 1994 1995 1996 1997 1998 1999 2000 Portugal Figure 1
Standard Deviation of Regional Per Capita Income in the EU and Portugal (1981-2000)
Std. Deviation of Regional Per capita Income
Accession of Portugal and Spain
Note: T he Appendix describes all data and their sources.
Inclusion of Eastern Germany
Accession of Austria, Sweden and Finland
Table 1 below presents data on the growth rate of real GDP in our sample between the years 1989 and 1999. As can be verified, the economies of the poorer regions – Eligible for Objective 1 - have grown at lower average rates, and subject to higher standard deviation than other regions. Regions in industrial decline and eligible for rural diversification programmes grow at higher than average rates. These basic statistics are suggestive of regional income divergence as the poorest regions grow at slower rates. True to data in Boldrin and Canova (2000), regions not covered by any goal at all have performed relatively well. In general, there seems to be a higher degree of within-group dispersion for groups that performed poorly, suggesting that higher performance regions also tend to become less heterogeneous.
Table 2 below presents data for different EU regions, classified according to their geographical characteristics.18 We find that regions located
18 Around 53 percent of the European regions are on the coast, and 7 percent include the country's capital city. While 46 percent are considered geographically at the core, 30 percent are in the periphery.
in “core areas”19 display higher growth rates, especially if on the coast, while
peripheral regions present poorer performance levels, especially when in the case where they share a border with a non-EU member. This also points to a lack of unconditional convergence across geographical lines.
Table 1
Income per capita Growth Across European Regions By Policy Eligibility
1989- 1999
Note: The Appendix describes data and sources. For the period 1989 to 1994 we have 155 NUTS 2 level European regions: 11 NUTS for Belgium, 1 for Denmark, 31 for Germany, 13 for Greece, 18 for Spain, 22 for France, 20 for Italy, 1 for Luxembourg, 12 for Netherlands , 9 for Austria, 7 for Portugal, 4 for Finland and 6 for Sweden. For the period 1995 to 1999 we have 194 NUTS 2 level European regions: 11 NUTS for Belgium, 1 for Denmark, 37 for Germany, 13 for Greece, 18 for Spain, 22 for France, 20 for Italy, 1 for Luxembourg, 12 for Netherlands, 9 for Austria, 7 for Portugal, 6 for Finland, 6 for Sweden and 31 for the UK.
19
The concept of "core" regions is not exempt of discussion. Though history matters for concentration of economic activity, there is evidence that industry mobility can overcome history, as in Barrios and Strobl (2004). About a third of the regions border regions from other European Union country and only 16 percent border regions from a non-European Union country.
5-year Annualized Real GDP Growth Rates 1989 – 1999
N Mean Std Dev Min Max
All European Regions
NUTS II Definition 328 1.24% 4.07% -19.39% 7.79% Less Developed
Eligible for Goal 1 89 -0.61% 5.70% -19.39% 7.80% Industrial Decline
Eligible for Goal 2 113 1.96% 1.79% -3.66% 5.88% Rural Diversification
Eligible for Goal 5 142 1.93% 1.68% -3.66% 6.80% Both Goal 2 and Goal 5 81 1.86% 1.78% -3.66% 5.78%
Any Goal 258 1.09% 3.81% -19.39% 7.80%
Table 2
Income per capita Growth Across European Regions By Geographical Characteristics
1989- 1999
Note: The Table shows estimates for the Core and Periphery regions only. The Appendix describes data and sources. For the period 1989 to 1994 we have 155 NUTS 2 level European regions: 11 NUTS for Belgium, 1 for Denmark, 31 for Germany, 13 for Greece, 18 for Spain, 22 for France, 20 for Italy, 1 for Luxembourg, 12 for Netherlands , 9 for Austria, 7 for Portugal, 4 for Finland and 6 for Sweden. For the period 1995 to 1999 we have 194 NUTS 2 level European regions: 11 NUTS for Belgium, 1 for Denmark, 37 for Germany, 13 for Greece, 18 for Spain, 22 for France, 20 for Italy, 1 for Luxembourg, 12 for Netherlands, 9 for Austria, 7 for Portugal, 6 for Finland, 6 for Sweden and 31 for the UK.
3.2 Econometric analysis
We analyze the determinants of regional income growth by estimating a Ordinary Least Squares specification where regional income is determined by initial income per capita, national policies, and eligibility to European regional policies under Objectives 1, 2, and 5b, as explained above. The general specification can be summarized as:
t i i t i t i t i t i t i t i t i dummies Country b Objective Objective Objective Trade Schooling Inv Gov GDPpc growth , 3 2 , 1 , 5 , . 4 , 3 , 2 , 1 , 5 . 2 . 1 . . . exp . ) log( . ε γ γ γ β β β β β α + + + + + + + + + + + = Core Periphery All 2.57% -1.32%
Number of NUTS 2 Regions 149 111
Regions that Border other EU
Region 1.68% 0.22%
Number of NUTS 2 Regions 64 26
Regions that Border Non EU
Region 2.46% -2.57%
Number of NUTS 2 Regions 14 16
Regions with Coast 3.24% -1.37%
where yearly data is averaged for each 5-year period between 1989 and 1999.20
The index i denotes the region and t the observation year. Income per capita, GDPpci,t is the logarithm of regional real income per capita at time t. The independent variables in the equation include indicators of national policies related to economic growth, such as the share of government expenditure – Govexp – , share of investment (private plus public) – Inv – , the rate of primary school enrolment as a share of the eligible cohort – , Schooling – , and trade openness measured as the share of exports plus imports in GDP – Trade. National policies vary with time and across countries, but not across regions of the same country. Objective1, Objective2, and Objective5b are dummy variables signalling regional eligibility for each of the three regional components of structural funding. We also introduce country dummies, when noted. One can understand national policies and eligibility to EU regional policies as fundamentally exogenous to the region.
We first estimated a specification for the whole sample of European regions and then estimated the same specification for subsamples of these regions, defined either by geography or by eligibility for EU regional policy initiatives. Table 3 presents the basic specification without country dummies. As can be verified, the positive and significant coefficient on initial income suggests that there is regional income divergence at the EU level. The positive coefficient on initial income is also present - and quantitatively more significant – for the Objective 1 subsample suggests that it is the poorer regions in the European Union that drive the non-convergence result. The even higher positive coefficient for the Any Objective subsample reinforces this result. The negative and significant coefficient estimates for the Objective 2, Objective 5b subsamples suggest convergence for subgroups of regions. The very significant and negative coefficient estimate of -3.53 for regions which are not eligible for any regional support policy strongly points towards
convergence for this subgroup of relatively richer regions, which is consistent with a view of regional income growth in the EU as being driven by convergence clubs.21 Of the national policies considered, only trade openness
seems to have a positive and significant effect on regional growth. Table 3
Determinants of Regional Income in the European Union No Country Dummies
1989- 1999 Dependent variable:
Real GDP 5 yr. avg growth rate
All Regions Objective 1 Eligibility Objective 2 Eligibility Objective 5b Eligibility Any Eligibility No Eligibility Log (GDPt-1) 1.35 *** 1.64 *** -1.14 ** -1.74 *** 1.98 *** -3.53 *** 0.49 0.53 0.57 0.47 0.46 1.20 Gov. Expenditures -0.23 *** -0.59 *** -0.06 ** -0.07 ** -0.30 *** 0.15 0.05 0.12 0.03 0.03 0.06 0.14 Investment -0.63 *** -1.12 *** -0.65 *** -0.65 *** -0.70 *** -1.83 *** 0.07 0.21 0.07 0.07 0.10 0.18 Prim. School 0.14 ** 0.49 *** -0.06 -0.11 *** 0.26 *** -0.97 *** 0.06 0.10 0.04 0.03 0.06 0.10 Trade 0.04 *** 0.13 *** 0.02 *** 0.02 *** 0.03 *** 0.09 *** 0.01 0.04 0.01 0.01 0.01 0.03 Constant -3.92 -21.10 *** 33.16 *** 43.39 *** -15.94 ** 152.00 *** 8.06 7.38 7.64 6.55 7.31 21.22 Country dummies No No No No No No N 328 89 113 142 258 70 F 17.65 8.53 25.50 22.52 14.44 32.72 pvalue F test 0.00 0.00 0.00 0.00 0.00 0.00 R-squared 0.24 0.43 0.55 0.48 0.35 0.66
Note: *** denotes significance at 1%, ** at 5%, * at 10%. The Appendix describes data and sources. For the period 1989 to 1994 we have 155 NUTS 2 level European regions: 11 NUTS for Belgium, 1 for Denmark, 31 for Germany, 13 for Greece, 18 for Spain, 22 for France, 20 for Italy, 1 for Luxembourg, 12 for Netherlands , 9 for Austria, 7 for Portugal, 4 for Finland and 6 for Sweden. For the period 1995 to 1999 we have 194 NUTS 2 level European regions: 11 NUTS for Belgium, 1 for Denmark, 37 for Germany, 13 for Greece, 18 for Spain, 22 for France, 20 for Italy, 1 for Luxembourg, 12 for Netherlands, 9 for Austria, 7 for Portugal, 6 for Finland, 6 for Sweden and 31 for the UK.
Table 4 presents results for the same exact specification as Table 3, but adding country dummies. Ezcurra et al.(2005) present empirical evidence strongly suggesting that regional disparity in productivity in the European Union are due to differences across regions and the fundamental role of the country differences in income per worker. The difference with Table 3 is stark: where we found evidence of regional income divergence, we now find strong evidence of income convergence. For the complete sample and for all the subsamples we now obtain negative estimates of the coefficient on initial income. Only in the case of Objective 2 eligibility the estimate is not statistically significant at conventional levels. For the sample of all regions, for regions eligible for Objective 1, and for regions eligible for any EU regional policy, the coefficient on initial income is strongly negative, more so than for equivalent country studies.22 This suggests that, after controlling for country characteristics – including the long run steady-state level of income per capita –, there is indeed strong regional income convergence to the country average income. This is especially true for regions that are eligible for Objective 1 policies.
22 As well as previous studies of regional convergence among states in the United States of America and regions in Japan. See Barro and Sala-i-Martin (1991 and 1995).
Table 4
Determinants of Regional Income in the European Union With Country Dummies
1989- 1999
Dependent variable: Real GDP 5-year average growth rate
All Regions Objective 1 Eligibility Objective 2 Eligibility Objective 5b Eligibility Any Eligibility No Eligibility Log (GDPt-1) -3.07 *** -5.43 *** -1.18 -1.97 *** -3.93 *** -1.36 0.55 1.39 0.83 0.63 0.60 0.86 Gov. Expenditures -0.84 *** -0.97 *** 0.00 -0.11 -0.86 *** -0.85 *** 0.08 0.18 0.09 0.07 0.08 0.17 Investment -1.71 *** -1.93 *** 0.21 * 0.03 -1.62 *** -1.50 *** 0.18 0.41 0.12 0.12 0.16 0.41 Prim. School -0.25 ** 0.11 -0.21 ** -0.31 *** -0.10 -0.14 *** 0.12 0.25 0.10 0.08 0.13 0.11 Trade 0.20 *** -0.08 0.47 *** 0.43 *** -0.03 0.48 *** 0.05 0.10 0.05 0.05 0.05 0.11 Constant 107.43 *** 136.21 *** 6.85 -27.68 124.87 *** 35.97 15.19 34.60 12.99 17.08 21.48 35.80
Country dummies Yes Yes Yes Yes Yes Yes
N 328 89 113 142 258 70
F . 54.11 . . . .
pvalue F test . 0.00 . . . .
R-squared 0.83 0.92 0.81 0.75 0.84 0.96
Note: *** denotes significance at 1%, ** at 5%, * at 10%. The Appendix describes data and sources. For the period 1989 to 1994 we have 155 NUTS 2 level European regions: 11 NUTS for Belgium, 1 for Denmark, 31 for Germany, 13 for Greece, 18 for Spain, 22 for France, 20 for Italy, 1 for Luxembourg, 12 for Netherlands , 9 for Austria, 7 for Portugal, 4 for Finland and 6 for Sweden. For the period 1995 to 1999 we have 194 NUTS 2 level European regions: 11 NUTS for Belgium, 1 for Denmark, 37 for Germany, 13 for Greece, 18 for Spain, 22 for France, 20 for Italy, 1 for Luxembourg, 12 for Netherlands, 9 for Austria, 7 for Portugal, 6 for Finland, 6 for Sweden and 31 for the UK.
Figure 2 displays the correlation between the log of initial GDP and the GDP growth rate inside each country. First notice that the unconditional correlation coefficient for all European regions is positive and significant and it is above 0.2, suggesting divergence across European regions. However, the picture totally changes once we look at the same correlation coefficient for
regions within each European country. Now we find that most countries display negative and quantitatively significant correlations between initial income and income growth at the regional level, most below -0.2. The exceptions are the Netherlands, the United Kingdom, and Belgium with weakly positive correlation coefficients, below 0.2, and France, with a weakly negative coefficient. This confirms a key result in our analysis, namely that there is evidence of regional income convergence within countries, while at the European level there is evidence of the opposite. This suggests that policies directed at raising the national steady-state levels of national income can do a lot for regional income convergence.
Ezcurra and Pascual (2005) show that, in spite of some convergence in income distribution across European regions, the European regions maintained their relative positions in terms of inequality over time, suggesting the importance of the national component in explaining regional distribution of inequality.23 The introduction of country dummies, as in our case, corrects for these stable national differences in income distribution. Ezcurra (2009) shows that income polarization is negatively related to economic growth across Europe´s regions. This suggests that the introduction of country dummies will correct for different average growth rates, insofar as countries differ in income distribution, and might reveal regional income dynamics that are disguised national dynamics.
Also, Giannetti (2001) provides an explanation for the coexistence of convergence across countries and the lack thereof at the regional level in the European Union. Her model and empirical evidence support the view that regions specialized in advanced sectors at the beginning of the sample period became more similar in terms of per capita income, i.e. converge, while regions specialized in traditional sectors lag behind, growing at lower rates.
23 Giannetti (2001) suggests that the intensification of international knowledge spillovers due to more cross-country interaction may exacerbate within-country regional disparities, if regions with different specialization do not benefit evenly from the exchange of knowledge.
Figure 2
Correlation Between Initial Income and Income Growth at the Regional Level
1989 - 1999
Our first important result is thus the evidence in favor of regional income convergence to average country income levels, not to European Union average income levels.
We now consider different geographical characteristics and study regional income convergence across different regional groupings. The geographical characteristics considered are whether the region is on the coast – Coast -, whether it shares a land border with regions from other countries, EU or non-EU - noted respectively as BorderEU and BorderNonEU – as well as whether the region is considered in the European core or the periphery – respectively Core and Periphery.24 Again we find strong evidence of regional
income convergence in the benchmark specification with country dummies.
24 The European Union itself provides the classification of regions into Core – which it names Center -, Periphery and Neither Core nor Periphery, and is based on geographical location alone and not derived from the eligibility to funding criteria. The Core roughly includes Belgium, Holland, Luxembourg, Northeastern France, Southeastern United Kingdom and Northwestern Germany. See European Commission (2001).
Correlation coefficient between initial GDP level and growth rate over a 5-year period
-1 -0.8 -0.6 -0.4 -0.2 0 0.2 0.4
EU AUT BEL FIN DEU GRE FRA ITA NLD POR SPA SWE UK
It is important to interpret our results in light of Ezcurra et al. (2006), who examined regional specialization in the European Union. These authors find that specialization levels, though relatively persistent, decreased between 1977 and 1999. Moreover, there is evidence of convergence in regional specialization, mostly due to small regions in southern Europe with a high level of specialization at the beginning of the period that tend towards the European average. Our results are consistent with Ezcurra et al. (2006) once we consider that regional specialization levels are highly correlated with a country´s level of development. In that case, once country dummies are introduced, as we do, evidence of regional income convergence might result. Ezcurra et al. (2006) show that the size of the region, the ease of market access, and its geographical location are key to explaining the degree of regional specialization. Results in Table 5, which consider different regional groupings related to geographic characteristics and market access, confirm the existence of regional income convergence for those groupings. The lack of overall income convergence in the case where no country fixed effects are taken into account, as in our Table 2, is consistent with Ezcurra et al. (2006) contention that the trend toward convergence in productive specialization changed during the 1900s, with evidence of increasing differences in regional productive structures.
Table 5
Determinants of Regional Income in the European Union Across Geographical Characteristics
With Country Dummies 1989- 1999
Dependent variable: Real GDP growth rate
(5-year average) All Regions Coast Border EU Border
Non-EU Core Periphery Log (GDPt-1) -3.07 *** -3.36 *** -2.51 *** -3.40 *** -1.65 ** -2.12 ** 0.55 0.94 0.84 0.94 0.77 1.02 Gov. Expenditures -0.84 *** -1.11 *** -0.15 * -0.97 *** -0.22 *** -0.82 *** 0.08 0.11 0.08 0.13 0.07 0.21 Investment -1.71 *** -1.50 *** -0.50 ** -1.37 *** -0.52 -3.17 *** 0.18 0.18 0.22 0.28 0.35 0.52 Prim. School -0.25 ** -0.36 * -0.15 0.58 *** -0.30 ** -0.34 0.12 0.19 0.14 0.20 0.14 0.21 Trade 0.20 *** 0.36 *** 0.29 *** 0.47 *** -0.08 -0.10 0.05 0.07 0.05 0.08 0.30 0.14 Constant 107.43 *** 114.69 *** 39.41 ** 22.98 70.75 ** 172.64 *** 15.19 18.89 17.37 24.65 35.45 29.72
Country dummies Yes Yes Yes Yes Yes Yes
N 328 163 119 53 148 106
F . 61.11 . . . 92.77
pvalue F test . 0.00000 . . . 0.00000
R-squared 0.83 0.89 0.63 0.97 0.58 0.92
Note: *** denotes significance at 1%, ** at 5%, * at 10%. The Appendix describes data and sources. For the period 1989 to 1994 we have 155 NUTS 2 level European regions: 11 NUTS for Belgium, 1 for Denmark, 31 for Germany, 13 for Greece, 18 for Spain, 22 for France, 20 for Italy, 1 for Luxembourg, 12 for Netherlands , 9 for Austria, 7 for Portugal, 4 for Finland and 6 for Sweden. For the period 1995 to 1999 we have 194 NUTS 2 level European regions: 11 NUTS for Belgium, 1 for Denmark, 37 for Germany, 13 for Greece, 18 for Spain, 22 for France, 20 for Italy, 1 for Luxembourg, 12 for Netherlands, 9 for Austria, 7 for Portugal, 6 for Finland, 6 for Sweden and 31 for the UK.
Table 6 reruns the benchmark specification for different eligibility groups - respectively by Objective 1, Objective 2 and Objective 5b, and the subsample of regions that are eligible for at least one of the three regional policies. We now add interaction terms between GDP and each of the Objective dummies. In this way we assess whether eligibility adds to or detracts from the regional income convergence. The coefficient on initial income for a specific region must now be read as the simple sum of the coefficient on initial income and the coefficient on the applicable interaction term coefficient. As can be verified, the fact that a region is covered by one of the EU policies
always contributes to convergence, though the effect is relatively weak. This is the case in the specification in column 4, where all the interactions are considered and all come out with a negative and significant coefficient.25
Table 6
Determinants of Regional Income in the European Union With Country Dummies
Initial GDP and EU Regional Policy Eligibility Interacted 1989- 1999
Dependent variable: Real GDP growth rate (5-year average)
Objective 1 Eligibility
Objective 2 Eligibility
Objective 5b
Eligibility Any Eligibility Log (GDPt-1) -3.64 *** -2.99 *** -2.98 *** -3.82 *** 0.65 0.56 0.55 0.65 Gov. Expenditures -0.81 *** -0.84 *** -0.84 *** -0.80 *** 0.08 0.08 0.08 0.08 Investment -1.69 *** -1.72 *** -1.72 *** -1.68 *** 0.18 0.18 0.18 0.18 Prim. School -0.23 * -0.26 ** -0.26 ** -0.22 * 0.12 0.12 0.12 0.11 Trade 0.19 *** 0.20 *** 0.20 *** 0.19 *** 0.05 0.05 0.05 0.05 Goal1_GDP -0.09 ** -0.20 *** 0.04 0.05 Goal2_GDP -0.02 -0.06 ** 0.03 0.03 Goal5_GDP -0.03 -0.09 *** 0.03 0.03 Constant 109.50 *** 107.11 *** 107.34 *** 110.87 *** 15.30 15.25 15.17 15.00
Country dummies Yes Yes Yes Yes
N 328 328 328 328
F . . . .
pvalue F test . . . .
R-squared 0.83 0.83 0.83 0.84
Note: *** denotes significance at 1%, ** at 5%, * at 10%. The Appendix describes data and sources. For the period 1989 to 1994 we have 155 NUTS 2 level European regions: 11 NUTS for Belgium, 1 for Denmark, 31 for Germany, 13 for Greece, 18 for Spain, 22 for France, 20 for Italy, 1 for Luxembourg, 12 for Netherlands , 9 for Austria, 7 for Portugal, 4 for Finland and 6 for Sweden. For the period 1995 to 1999 we have 194 NUTS 2 level European regions: 11 NUTS for Belgium, 1 for Denmark, 37 for Germany, 13 for Greece, 18 for Spain, 22 for France, 20 for Italy, 1 for Luxembourg, 12 for Netherlands, 9 for Austria, 7 for Portugal, 6 for Finland, 6 for Sweden and 31 for the UK.
25
Running the specifications in Table 6 without country dummies delivers non-significant coefficients on the interacted terms, suggesting that EU regional policy indeed has little effect as regards income convergence to a common EU level. See Table 6a in the Appendix.
In conclusion, we can say that regional convergence is happening within countries, but not across different EU countries and we can say that national policies that lead to greater expenditure fail to foster growth. Trade openness, however, emerges as having a robust positive effect on regional growth. As for EU policies, they appear to foster convergence within countries, but not across all EU regions. In general, the evidence is consistent with the idea of regional income convergence clubs, defined either by geographical characteristics, eligibility and, most importantly, nationality.
These results are in line with De La Fuente (2002b) who shows that structural funds have contributed to convergence among Spanish regions. Thus, we argue against Cappelen et al. (2003), who display evidence of catch-up between countries but not within countries. Martin (2001) has documented relatively low levels of beta-convergence across EU regions, though no explicit consideration of the role of regional policy is present.26 His survey of the evidence suggests that, while there was regional convergence in the EU between the 1950's and the 1970's, after 1980 convergence came to a halt.27 Our results are also in line with Boldrin and Canova (2000), who argue that trade integration has a positive effect o regional growth.
3. Conclusion
In this paper we used a dataset on regional macroeconomic indicators and the incidence of European Union regional policies for a wide sample of European regions at NUTS 2 level. For the period 1989-1999 covered in our study, we find no evidence of regional income convergence, except when one takes into account the country where the region is located. In our view, this signals that there is not convergence across regions in the EU, but there is convergence across regions inside EU country members.
26 Boldrin and Canova (2000) suggest the impact of regional funds on the poorer regions has been marginal.
We then answered the question regarding the effectiveness of European wide regional policies, namely if they furthered or diminished convergence. We saw that structural policies tend to increase convergence inside the member states but are ineffective fostering regional convergence across the EU. Interestingly, convergence across the EU was found in the subsample of regions excluded from these structural policies.28
Finally, we assessed whether policies at the country level affect regional income growth. We find that a larger weight of government activity and national investment in GDP both decrease regional growth, (primary) schooling has ambiguous effects though mostly negative, while trade openness decidedly fosters growth. In terms of geographical characteristics, we saw that regions in the center grow more than regions outside the center, and even more than regions in the periphery. This is further proof that regional convergence is not happening in the EU.
From our conclusions, we contend that countries interested in promoting growth should open themselves to trade, and not depend exclusively on structural EU policies, which merely foster intra-national convergence and not EU-level convergence. Also, national policies of the sorts of government expenditure or investment have negative effects over regional growth.
28
Other authors arrived at other suggestions as to the benefits of EU structural policies. In the wake of his study of the relation between income disparity and income growth, Ezcurra (2009) suggests that EU programmes that reduce the degree of regional polarization in income distribution might boost regional growth, a possibility that has so far been unexplored in the design of EU regional policy.
References
Andrés, J., Boscá, E., and Doménech, R. (2004), “Convergence in the OECD: Transitional Dynamics or Narrowing Steady-State Differences?”, Economic Inquiry, 42(1):141-149.
Armstrong, H.W. (1995), “Convergence Among Regions of the European Union 1950 – 1990”, Papers in Regional Science, 74(2): 143-152.
Barrios, S., Strobl, E. (2004), "Industry Mobility and Geographic Concentration in the European union", Economics Letters 82(1): 71-75. Barro, R. (1991), “Economic Growth in a Cross-section of Countries”, Quarterly Journal of Economics 106(2): 407-443.
Barro, R., Sala-i-Martin, X. (1991), “Convergence Across States and Regions”, Brookings Papers on Economic Activity 1991(1): 107 - 158. _________________________ (1995), “Economic Growth”, New York: McGraw-Hill.
Boldrin, M., Canova, F. (2000), “Inequality and Convergence: reconsidering European regional Policies”, Economic Policy, 16(32): 207 – 253.
Button, Kenneth J., Pentecost, Eric J. (1995), “Testing For Convergence of the EU Regional Economies”, Economic Inquiry, 33(4): 664-671. Cappelen, A., Castellacci, F., Fagerberg, J., Verspagen, B. (2003), “The Impact of Regional Support on Growth and Convergence in the European Union”, Journal of Common Market Studies 41(4): 621-644.
Carrington, A. (2008), “A Divided Europe? Regional Convergence and Neighborhood Spillover Effects”, Kyklos 56(3): 381-393.
Canova, F., Marcet, A. (1995), “The Poor Stay Poor: Non-convergence Across States and Regions”, CEPR Discussion Paper 1265.
Clemente, J., Pueyo, F. and Sanz, F. (2009), “Market Potential, European Union and Growth”, Journal of Policy Modeling 31(5): 719-730.
De la Fuente, A. (2002), “On the Sources of Convergence: a Close Look at the Spanish Regions”, European Economic Review 46(3): 569-599.
_____________(2002a), “Regional Convergence in Spain: 1965 - 95”, CEPR Discussion Paper 3137.
_____________ (2002b), “The Effect of Structural Fund Spending on the Spanish Regions: An Assessment of the 1994-1999 Objective 1 CSF”, CEPR Discussion Paper 3673.
Dhont, T., Heylen, F. (2008), “Employment and Growth in Europe and the US: the Role of Fiscal Policy Composition”, Oxford Economic Papers. Easterly, W., Ritzen, J., Woolcock, M. (2006), “Social Cohesion, Institutions and Growth”, Economics and Politics 18(2): 103-120.
Ertur C., Le Gallo, J., Baumont, C. (2006), “The European Regional Convergence Process, 1980-1995: Do Spatial Regimes and Spatial Dependence Matter?”, International Regional Science Review, 29(1): 3-34. European Commission (2004), “Third Report on Social and Economic Cohesion”. European Commission, Brussels.
European Commission (2001), “Second Report on Social and Economic Cohesion”. Statistical Annex., Belgium.
Ezcurra, R. (2009). “Does income polarization affect economic growth? The case of the European regions”, Regional Studies, 43(2): 267–285. Ezcurra, R., Pascual, P. (2005). “Is there convergence in income inequality levels among the European regions?”, Applied Economics Letters, 12 (12):763–767.
Giannetti, M. (2002). “The effects of integration on regional disparities: Convergence, divergence or both?”, European Economic Review 46(3): 539–567
Krugman, P. (1991), “Increasing Returns and Economic Geography”, Journal of Political Economy, 99(3): 483 - 199.
Martin, R. (2001), “EMU versus the regions? Regional Convergence and Divergence in Euroland”, Journal of Economic Geography, 1(1): 51- 80. Martinéz-Lopez, D. (2001), “Linking Public Investment to Private Investment: The Case of Spanish Regions, 1965 – 1995”, Working Paper E2001/04, Fundación Centro de Estudis Andaluces, Sevilla.
Meliciani, V., Peracchi, F. (2006), “Convergence in per-capita GDP across European regions: a reappraisal”, Empirical Economics, 31(3): 549-568. Mundell, R. A. (1961), “A Theory of Optimum Currency Areas”, American Economic Review 51(4), 657-665.
Quah, D. T. (1996), “Twin Peaks: Growth and Convergence in Models of Distribution Dynamics”, CEPR Discussion Paper 280.
Quah, D. T. (1997), “Empirics for Growth and Distribution: Stratication, Polarization, and Convergence Clubs”, CEPR Discussion Paper 324.
Roeger W. (1996), “Macroeconomic Evaluation of the Effects of Community Structural Funds with QUEST II”, Mimeo, European Commission, DG II.
Sala-i-Martin, X. (1996), “Regional Cohesion: Evidence and Theories of Regional Growth and Convergence”, European Economic Review, 40(6): 1325 - 1352.
World Bank (2001), “World Development Indicators”, World Bank, Washington D.C.
Appendix 1 Data description
GDPpc: per capita regional Gross Domestic Product. Unit: Euros per capita. Source: European Commission (2001).
Goal 1: dummy variable taking the value 1 for a region that is eligible for Objective 1 funding from the European Union, related to less developed regions. Unit: 0 or 1. Source: European Commission (2001).Regional Growth in European Union: National Policies, European Policies, and Geography 10 Goal 2: dummy variable taking the value 1 for a region that is eligible for Objective 2 funding from the European Union, related to industrial regions in decline. Unit: 0 or 1. Source: European Commission (2001).
Goal 5: dummy variable taking the value 1 for a region that is eligible for Objective 5b funding from the European Union, related to rural regions in need of diversification. Unit: 0 or 1. Source: European Commission (2001). Gov. Expenditures: share of national government spending on subsidies and transfers plus government consumption as a share of national GDP . Unit: Between 0 and 1. Source: World Development Indicators (2001).
Investment: share of national investment as a share of national GDP. Unit: Between 0 and 1. Source: World Development Indicators (2001).
Prim. School: primary school enrollment as a share of the appropriate age group. Unit: From 0 to slightly above 1 if adult education is present. Source: World Development Indicators (2001).
Trade: sum of exports and imports of goods and services measured as a share of gross domestic product. Source: World Development Indicators (2001). Coast: dummy variable taking the value 1 if the region has a coastline. Unit: 0 or 1. Source: European Commission (2001).
Border EU: dummy variable taking the value 1 for regions that border regions from other European Union countries. Unit: 0 or 1. Source: European Commission (2001).
Border non EU: dummy variable taking the value 1 for regions that border regions from a country outside the European Union. Unit: 0 or 1. Source: European Commission (2001).
Core: dummy variable taking the value 1 for a region that is classified as part of the central area in the European Union. Unit: 0 or 1. Source: European Commission (2001).
Periphery: dummy variable taking the value 1 for a region that is classified Regional Growth in European Union: National Policies, European Policies, and Geography 11 as part of the peripheral area in the European Union. Unit: 0 or 1. Source: European Commission (2001).
Appendix 2 Empirics
Table 6a
Determinants of Regional Income in the European Union Without Country Dummies
Initial GDP and EU Regional Policy Eligibility Interacted 1989- 1999
Dependent variable:
Real GDP 5-year average growth rate Goal1 Goal2 Goal5
All interactions Log (GDPt-1) 1.20** 1.23 ** 1.16 ** 1.14 ** 0.49 0.51 0.51 0.49 Govexpenditures -0.23 *** -0.24 *** -0.24 *** -0.24 *** 0.05 0.05 0.05 0.06 Investment -0.62 *** -0.63 *** -0.64 *** -0.64 *** 0.08 0.08 0.08 0.08 Schooling 0.14 ** 0.13 ** 0.14 ** 0.13 ** 0.06 0.06 0.06 0.06 Trade 0.04 *** 0.04 *** 0.05 *** 0.05 *** 0.01 0.01 0.01 0.01 Goal1_GDP -0.05 0.01 0.05 0.08 Goal2_GDP 0.06 0.04 0.05 0.04 Goal5_GDP 0.08 * 0.07 0.04 0.05 Constant -2.67765 -2.18471 -2.56116 -1.85111 7.80771 8.40040 8.13329 7.95481 Country dummies No No No No N 328 328 328 328 F 15.27000 14.24000 13.94000 10.62000 pvalue F test 0.00000 0.00000 0.00000 0.00000 R-squared 0.23940 0.24210 0.24520 0.24670
Note: *** denotes significance at 1%, ** at 5%, * at 10%. The Appendix describes data and sources. For the period 1989 to 1994 we have 155 NUTS 2 level European regions: 11 NUTS for Belgium, 1 for Denmark, 31 for Germany, 13 for Greece, 18 for Spain, 22 for France, 20 for Italy, 1 for Luxembourg, 12 for Netherlands , 9 for Austria, 7 for Portugal, 4 for Finland and 6 for Sweden. For the period 1995 to 1999 we have 194 NUTS 2 level European regions: 11 NUTS for Belgium, 1 for Denmark, 37 for Germany, 13 for Greece, 18 for Spain, 22 for France, 20 for Italy, 1 for Luxembourg, 12 for Netherlands, 9 for Austria, 7 for Portugal, 6 for Finland, 6 for Sweden and 31 for the UK.