2012/2013
Pedro Jorge Saldanha Ramos
DEDICATED EMERGENCY ROOM SURGICAL TEAM
Mestrado Integrado em Medicina
Área: Administração Hospitalar
Trabalho efetuado sob a Orientação de: Professor Doutor José Artur Osório de Carvalho Paiva
Trabalho organizado de acordo com as normas da revista: Journal of Health Economics (J Health Econ.) Pedro Jorge Saldanha Ramos
DEDICATED EMERGENCY ROOM SURGICAL TEAM
Projeto de Opção do 6º ano - DECLARAÇÃO DE INTEGRIDADE
Eu, Pedro Jorge Saldanha Ramos , abaixo assinado, nº mecanográfico 070801111, estudante do 6º ano do Mestrado Integrado em Medicina, na Faculdade de Medicina da Universidade do Porto, declaro ter atuado com absoluta integridade na elaboração deste projeto de opção.
Neste sentido, confirmo que NÃO incorri em plágio (ato pelo qual um indivíduo, mesmo por omissão, assume a autoria de um determinado trabalho intelectual, ou partes dele). Mais declaro que todas as frases que retirei de trabalhos anteriores pertencentes a outros autores, foram referenciadas, ou redigidas com novas palavras, tendo colocado, neste caso, a citação da fonte bibliográfica.
Faculdade de Medicina da Universidade do Porto, 03 de Abril de 2013
Projeto de Opção do 6º ano – DECLARAÇÃO DE REPRODUÇÃO
Nome: PEDRO JORGE SALDANHA RAMOS Email: PEDROSALDANHARAMOS@LIVE.COM.PT
Título da Dissertação: DEDICATED EMERGENCY ROOM SURGICAL TEAM Orientador: PROFESSOR DOUTOR JOSÉ ARTUR OSÓRIO DE CARVALHO PAIVA
Ano de conclusão: 2013
Designação da área do projeto: ADMINISTRAÇÃO HOSPITALAR
É autorizada a reprodução integral desta Dissertação para efeitos de investigação e de divulgação pedagógica, em programas e projetos coordenados pela FMUP.
Faculdade de Medicina da Universidade do Porto, 03 de Abril de 2013
1
DEDICATED EMERGENCY ROOM SURGICAL TEAM
Pedro Ramos a ,*, José Artur Paiva a ,b
a Faculdade de Medicina da Universidade do Porto, Portugal
b Unidade Autónoma de Gestão – Urgência e Medicina Intensiva, Centro Hospitalar São João, Portugal
* Corresponding author. Tel.: +351 918364331; E-mail adress: pedrosaldanharamos@live.com.pt
2
INTRODUCTION
In Portugal, the progressive endowment of the Emergency Room (ER1) with doctors in full-time employment, as well as the latter’s professional specialization with a degree and distinctive qualifications, were baseline assumptions for the organic and functional adequacy of the ER as a department of “hospital medical action”, multidisciplinary and multiprofessional, capable of delivering health care services to the emergent medical, surgical or trauma patient, in accordance with the highest international standards (Legislative Order 11/2002, 2002).
However, after ten years, almost half of the Portuguese ERs keep operating in the “classic” system, where the work is ensured on a part-time basis - 12 to 24h a week - by doctors with different specialities and who belong to other hospital departments. The nonexistence of the ER’s own medical staff may be one of the causes for a management failure of these services: firstly, in the ER, due to its inability to assert itself as a Hospital Department per se, reflected in the leadership of other departments’ medical staff, due to the difficulty in the awareness of this staff for the strategy of the ER, or even due to the lack of teamwork and discussion of patients’ information between shifts; and finally, upstream, in the other hospital departments, due to a spillover effect in the productivity of these departments (Miller et al., 2012). These consequences will inevitably lead to worse health outcomes and to higher costs for the Hospital and for the Health System (CRRNEU, 2012).
On the other hand, setting up dedicated teams both in the medical and in the surgical field in the ER, i.e. teams with doctors that work most of their time in the ER2, by dealing with the structural weaknesses pointed out in the former model, may not only help in enhancing the quality of care provided in the ER – both in the clinical outcomes (Salas et al., 2007;) and in the access to care (Qureshi et al., 2011) – but also reduce the financial burden with healthcare (CRRNEU, 2012), due to its strategic position in the Health System.
However, the creation of a dedicated team, while subject to a careful recruitment policy, is bounded by an appropriate formation structure, by a definition of the skills’ profile and by an overview of the career expectations of those health professionals. Actually, medical emergency and to a lesser extent emergency general surgery are legally recognised as medical specialities in a wide range of countries (Directive 2001/19/EC of the European Parliament and of the Council, 2001) and if in some of these countries some changes have already been made by widening the spectrum of activities developed by these professionals to urgent non-trauma conditions (Pryor et al., 2004 ; Ciesla et al., 2005;
1 We chose to use the more widespread designation of Emergency Room over some more recent ones (ie. Emergency Department, Accident&Emergency).
2 A more detailed description of the models of Human Resources in the ER in Portugal is available in the CRRNEU Report, February 2012.
3 Shackford, 2005), delaying the emergence of these specialities as formal medical expertise may not only place an unbearable burden on the doctors who wish to pursue those careers and in the hospitals which want to establish those teams, but will also affect the delivery of emergent health care to the population.
CONTEXT
The Centro Hospitalar São João (CHSJ) is a tertiary academic hospital that serves a population of 750 000 in the North of Portugal. Its ER, classified as a Polyvalent ER, has an average volume of 150 000 annual visits and an internal organization based on a mixed system, i.e. a dedicated medical team, set up in 2005-2006, and a surgical team working in the “classic” system.
Before 2005, medical care was delivered by different teams with doctors from different medical specialities, who took turns in the ER, in 12 to 24h shifts, returning to their activities in their original department during the rest of the week.
After 2005, these health services from medical specialities were handled by a dedicated team with doctors from the ER, who occasionally ask for specific consultancy from other medical specialities. Our study aims to project the formation of a dedicated surgical team in the Emergency Room of the CHSJ, by estimating the productivity variation which resulted from the creation of a dedicated medical team in that Emergency Room, which we will use for projecting the surgical team.
The rest of the thesis is organized as follows. In section 2 we present the methodology we have used, while the results are in section 3. Section 4 is dedicated to the discussion of our main findings and the limitations of our study. Section 5 concludes.
4
METHODOLOGY
Our study of human resources planning for the dedicated surgical team in the ER of the CHSJ used the methodological framework of benchmarking, with the process of setting up a dedicated medical team in that ER, started in 2003 and with a development period of 2 years, serving as the benchmark. Our decision to use productivity as the measurement unit is self-explanatory: it allows the analysis of a business unit’s efficiency in allocating its factors of production, comparing it over time.
Hence, we used the productivity variation estimated between 2002 (classic model) and 2005/2006 (dedicated model) in the medical team as a proxy for that expected in the surgical team between 2012 (classic model) and 2014 (dedicated model). However, we have analysed the productivity separately for 2005 and 2006, since in the former the dedicated model was still partially implemented, with a considerable number of doctors in the classic model, mainly in the specialty of Internal Medicine.
The rationale behind the use of this proxy lies in the fundamental assumption that the productivity variation with the transition from a classic model to a dedicated one will have approximately the same order of magnitude, regardless of the medical or surgical nature of the team.
We state it on the basis of the assumption that, with regard to the medical human resources’ relative productivity, primarily intrinsic to the organizational model of labour3, the medical team in 2002 and the surgical team in 2012 are at the same stage of the “productivity curve”, having, therefore, the same margin for relative variations while subject to the same organizational change, ie., transition from the classic model to the dedicated model. In order to ensure this assumption, the surgical activity in the ER’s Operating Room (OR) and the orthopaedics’ consultancy for the Paediatrics’ ER were analysed separately, as restrictions for planning the future dedicated surgical team, since they are activities the team needs to continue to ensure.
In order to isolate the medical and surgical work in the ER, we have selected the ER visits whose production we could reasonably assign to those doctors. Hence, we have selected those whose discharge was the responsibility of doctors assigned to the cost centre of medical or surgical specialities and, for those assigned to the ER’s cost centre, we have selected the doctors with more than 50% of discharges in medical or surgical specialities, depending on the year.
Therefore, in the production of the medical field in the ER, we have included the doctors from the cost centres of Internal Medicine, Cardiology, Neurology, Dermatology, Gastroenterology,
3
It is important to bear in mind that Health is a labour intensive economic field, regardless of technological evolution. Therefore, it has reduced productivity growth rates. A more detailed explanation of this phenomenon, described as Baumol’s Cost Disease, may be found in (BAUMOL, 1993).
5 Pulmonology, Infectious Diseases, Rheumatology Nephrology, Endocrinology, Immunoallergology, and Hemato-oncology. We have also included the doctors assigned to the cost centres of the Intensive Care Unit and Anaesthesiology, despite these not being strict medical specialities, since they were assigned to the emergency room.
As for the projection of the surgical team, we have only included the cost centres of General Surgery and Orthopaedics, since the other surgical specialities (Plastic Surgery, Vascular Surgery, Neurosurgery and Urology) are already in a consultancy regime in the ER, at this point.
The ER’s production in each of the years was adjusted to the quality of care provided, in accordance with a set of quality indicators published in the Report of the Comission for Re-evaluating the National Network of Emergency Rooms (CCRRNEU,2012). We have done this because we firmly believe that the comparison should not be made using the production per se, but instead by using the quality associated with that production, a mind-set that is nowadays paramount in the delivery of health care.
Hence, we have extended the concept of “equivalent patient” 4, which allowed us to determine the quality-adjusted production of the ER. According to the scale we have developed, a patient treated in the ER with a maximum standard of quality of care would be a “1 equivalent patient”, while one with a minimum standard of quality of care would be a “0 equivalent patient”.
Hence, in each year, we have calculated the number of “equivalent patients” by using 3 criteria, with a relative weight of 1/3:
1) the total duration of the ER visit;
2) the readmission rate to the ER within 72 hours;
3) the rate of patients who dropped out of the ER, leaving without being seen by a doctor.
According to the criteria of the total duration of the ER visit, all the patients who were discharged in less than 6 hours had a weighting of 1, whilst those who were discharged in more than 6 hours had decreasing linear weighting, depending on their destination after discharge: patients who were hospitalised had a weighting of 0 if the ER visit lasted 12 or more hours; patients who were discharged to other destinations had a weighting of 0 if the ER visit lasted 9 or more hours; patients who deceased, patients who left against medical advice or patients who had administrative discharge had a weighting of 1.
The readmission rate to the ER within 72 hours was also evaluated according to their destination after discharge in the revisit: patients who deceased in the revisit had a weighting of 0 in the previous
4
It is worth mentioning that despite the rationale behind our use of the methodology of the “equivalent patient” being somehow analogous to the one used in the financing of public hospitals for the inpatient care, the formula we have used is, naturally, different from this, since it uses intrinsic criteria from the ER.
6 visit, patients who were hospitalised had a weighting of 0.25 and patients with other discharge destinations had a weighting of 0.5. We gave a weighting of 1 to these last patients, in the equivalent percentage to the visits which had a Manchester Triage of “white” in 2007 (1st year of the Manchester Triage in the ER), as a way of taking into account the patients who had a formal indication from their discharge doctor to return to the ER in the following days for a re-evaluation (the typical case of patients who have a “white” triage). Furthermore, patients for whom we had no information about their Identification Process were not included in this admission rate, therefore having a weighting of 1 in this criterion.
Finally, patients who dropped out of the ER, leaving without being seen by a doctor, had a weighting of 0 in this criterion.
Hence:
We have also developed the concept of the ER’s Production Quality Index, defined as the ratio between the number of equivalent patients and the number of ER visits, which we have calculated for each of the years in our analysis.
The factors of production used for calculating Productivity were the respective hours of work, data provided by the CHSJ’s Management Control Centre and by the Autonomous Management Unit of the Emergency Room and Intensive Medicine.
Therefore, in the Classic model, in 2002 and in 2012, in each cost centre we have included the 12 hours of regular weekly work by doctors who had an age below the one defined in the legislation for leave of absence from the ER, Intensive Care Unit and Intermediate Care Unit work, (55 years-old, number 6 of the 44th Clause of the Special Collective Agreement for the Medical Career), weighing up the residency time (entry or exit) in the institution in that year.
We have also added the overtime, supplements and preventions that were allocated to the ER’s Cost Centre, made by doctors of the medical or surgical cost centres we had selected (depending on the year).
In the dedicated model, in 2005 and 2006, we have included the work hours of the doctors who were part of the dedicated team, as well as the 12 weekly hours of the doctors of Internal Medicine who were still working on the classic basis. We have also included the overtime, supplements and preventions allocated to the ER’s cost centre by the medical cost centres we have selected, as well as the hours of the duration of the visits that required the consultancy of specialties.
7 With reference to the work done by resident doctors, and since their graduate medical training requires a 12 hours-week residency in the ER in the 1st/2nd year(s) of residency (the remaining are also on a consultancy basis), we have cherry-picked the ones that were in those years of residency and allocated only 12 hours of their work time to the ER. As for the other residents, we have only allocated the hours of the duration of the visits that required their consultancy, as we have done for the senior doctors.
In view of the above, we have defined the Productivity of the ER as the ratio between the production of the ER – using the number of equivalent patients as the measure – and the factors of production – the doctors’ hours of work allocated to the ER.
Another analysis that we have conducted was of the costs of the models, in each year, for which we have used the gross remuneration earned by those doctors responsible for the ER visits we had selected, with a methodology which overlaps the one we used to account for the work hours. In order to compare the results, those remunerations were adjusted to the inflation rate reported by the National Statistics Institute (INE).
Finally, in planning for the dedicated surgical team’s size, we have used a heuristic model to find a quasi-optimal solution, while adjusted to the existing restrictions, namely the need for a minimum of 2 General Surgery and 2 Orthopaedics doctors, throughout the day and late into the evening, regardless of the expected demand on the ER, and the need for a minimum of 2 doctors available for the OR, in any surgery.
Therefore, we have considered 3 daily shifts of 8 hours (00-08; 08-16;16-24), and we have projected the human resources necessary for ensuring the service of the average volume of patients in each shift, considering the patients’ flow of these surgical specialties in the ER in 2012, in the 3 production categories – the service in the General ER, the orthopaedics consultancy in the Paediatrics’ ER and the production in the ER’s OR.
Considering these different productions that the dedicated team has to guarantee, we have projected different scenarios for the constitution of this team, namely by granting the possibility that some of these activities may no longer be done by the doctors of the ER. Academically, we have also projected the team from the perspective of the team not having to be split between General Surgery and Orthopaedics, yet all the work being done by the figure of the “Emergency General Surgeon”. Lastly, the employment contract we have used as the basis for our projection was of 40 hours per week.
8 STATISTICAL ANALYSIS
In order to evaluate whether the model of medical human resources in each year affected significantly the quality-adjusted production, measured in equivalent patients, we have used the Analysis of Variance (ANCOVA), followed by the post-hoc Games-Howell test for the variable Year, since the homogeneity of the variance was not guaranteed. We have also included in the analysis demographic (Sex, Age, Distance from the centre of the patient’s municipality to the ER, patient’s health subsystem) and accessibility (Average Time in the ER, Destination after discharge from ER, Career category of the doctor responsible for the discharge) variables, in order to isolate their influence in the variable Year (2002,2005,2006), conceived as equivalent to the Model (“Classic”, “Dedicated in adjustment”, “Dedicated”).
As for the Hours of work and for the Productivity, since we only had monthly information of these variables, we have used the Chi-Square Test and the Kruskal-Wallis Test to evaluate differences in the samples of the different years. Additionally, we used the Mann-Wittney U Test to make comparisons between two years, with regard to those variables.
All the statistical analyses were made with IBM SPSS 20® and the statistical significance was defined with α<0,05. In Annex 1, we present the outputs from the inferential statistics.
9
RESULTS
DEMOGRAPHIC CHARACTERISTICS
We identified a set of 153300 visits in the ER with discharges made by doctors of medical specialities, throughout the period of our analysis. The demographic and accessibility characteristics, in each year, are presented in Table 1.
Despite some mild variations, which we will discuss in the following section, the indicators presented remained essentially constant during the period of the study.
DEMOGRAPHIC INFORMATION
2002 2005 2006
NUMBER OF WOMEN 21520 (50,7%) 26983 (51,5%) 31206 (53,0%)
AGE (AVERAGE ± STANDARD-DEVIATION) 52 ± 21 54 ± 21 53 ± 21 DISTANCE (AVERAGE ± STANDARD-DEVIATION) 17,1Km ± 26,1Km 15,5Km ± 26,7Km 15,3Km ± 25,2Km ACCESSIBILITY INFORMATION
PATIENTS FROM THE NHS 37262 (88,9%) 46327 (88,4%) 42227 (89,1%) PATIENTS FROM THE “ADSE” 3058 (7,3%) 3897 (7,4%) 3344 (7,1%)
PRODUCTION OF THE GENERAL ER
In the period after the implementation of the dedicated team, there was an increase in the number of ER visits of 25 and 40%, in 2005 and in 2006 respectively. This increase occurred with a continuous release of the work carried out by the specialities in the classic model, with a progressive absorption by the dedicated team. On the other hand, in the period before the implementation of the dedicated team, the work in the ER was mainly undertaken by the resident doctors, while after they had been substituted by senior doctors, members of the team. (Table 2)
CAREER CATEGORY
2002 2005 2006
CHIEF DOCTOR 430 (1,0%) 464 (0,9%) 196 (0,3%)
SENIOR GRADUATE DOCTOR 7128 (17,0%) 3820 (7,3%) 2837 (4,8%)
SENIOR DOCTOR 9653 (23,0%) 36644 (70,0%) 42929 (72,8%)
RESIDENT DOCTOR 24108 (57,6%) 9962 (19,0%) 11585 (19,6%)
“INDEPENDENT-HIRED” DOCTOR 590 (1,4%) 1499 (2,9%) 1455 (2,5%) Table 1: Demographic and Accessibility characteristics of the ER visits
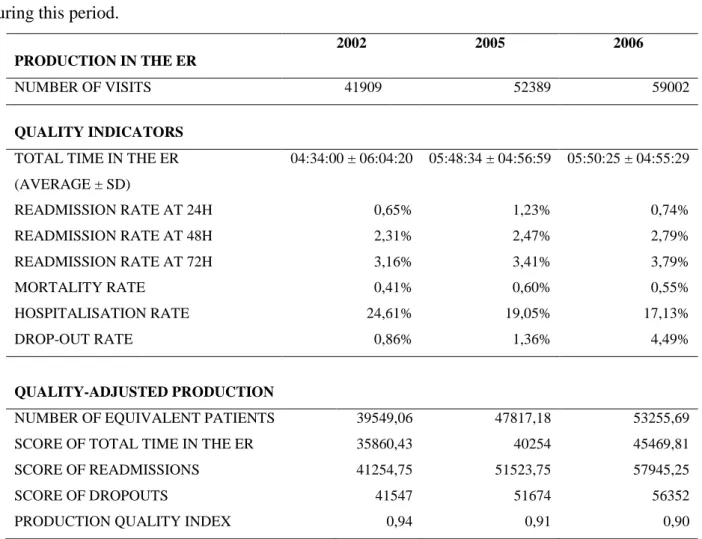
10 Table 3 shows that in the years after the intervention there was a deterioration of the quality indicators of the care provided in the ER, namely by the increase in the average visit time (despite the reduction in the standard-deviation), in the readmission rates at 24, 48 and 72 hours, in the mortality rate and in the “drop-out” rate. In contrast, the hospitalisation rate declined noticeably in this period.
Overall, the increase in production led to an increase in the number of equivalent patients of 21 and 35%, in 2005 and in 2006, respectively, even though the Production Quality Index decreased slightly during this period.
PRODUCTION IN THE ER
2002 2005 2006
NUMBER OF VISITS 41909 52389 59002
QUALITY INDICATORS TOTAL TIME IN THE ER (AVERAGE ± SD) 04:34:00 ± 06:04:20 05:48:34 ± 04:56:59 05:50:25 ± 04:55:29 READMISSION RATE AT 24H 0,65% 1,23% 0,74% READMISSION RATE AT 48H 2,31% 2,47% 2,79% READMISSION RATE AT 72H 3,16% 3,41% 3,79% MORTALITY RATE 0,41% 0,60% 0,55% HOSPITALISATION RATE 24,61% 19,05% 17,13% DROP-OUT RATE 0,86% 1,36% 4,49% QUALITY-ADJUSTED PRODUCTION
NUMBER OF EQUIVALENT PATIENTS 39549,06 47817,18 53255,69
SCORE OF TOTAL TIME IN THE ER 35860,43 40254 45469,81
SCORE OF READMISSIONS 41254,75 51523,75 57945,25
SCORE OF DROPOUTS 41547 51674 56352
PRODUCTION QUALITY INDEX 0,94 0,91 0,90
After we have considered the effects of the hospitalisation rate, mortality rate, total time in the ER, patient’s age and distance from the patient’s municipality to the ER, the variable Year had a statistically significant effect (p<0,001) and of a reasonable size (F=19.78) on the score of the equivalent patient (Annex 1).
This score had the highest results in 2002 ( ̅=0,9438 ; =0,1147), relative to 2005 ( ̅=0,9127 ; =0,1391) and 2006 ( ̅=0,9026; =0,1506). According to the post-hoc Games-Howell test, the
11 statistically significant differences occurred between the year 2002 and 2005 (0,031 ± 0,0009) and between 2005 and 2006 (0,01 ± 0,008).
The hospitalisation rate, the mortality rate and mainly the total time in the ER had the highest effects on the score of the equivalent patient. Similarly, the distance from the patient’s municipality to the ER had statistically significant effects on the score of the equivalent patient.
In contrast, both the sex and the career category of the doctor responsible for the discharge had no significant effect on the score. (p=0,781; p=0,073).
FACTORS OF PRODUCTION
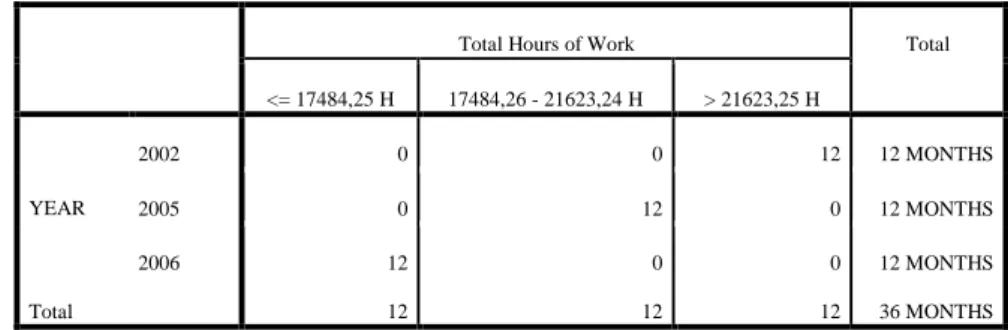
Table 4 shows the evolution in medical work hours of the ER. While in 2002, the total work hours in the 12 months are in the highest tertile, in 2005 they are all in the intermediate tertile and in 2006 they are in the lowest tertile. There was a pronounced decrease in the total hours of work between 2002 and 2005 and 2006, of 22% and 36% respectively. Moreover, between 2005 and 2006 there was still a reduction of nearly 19% in the total hours of work.
Graph 1 also presents the evolution of the work hours in the ER, yet considering their category. In 2002, the needs in regular hours, overtime and supplements are significantly higher, while the hours for preventions had only a slight reduction in the following years. On the other hand, in 2005 and 2006, the ER included a set of consultancy hours, which decreased between 2005 and 2006 in senior doctors’ consultancy calls and increased in the residents’ consultancy calls.
Total Hours of Work Total
<= 17484,25 H 17484,26 - 21623,24 H > 21623,25 H YEAR 2002 0 0 12 12 MONTHS 2005 0 12 0 12 MONTHS 2006 12 0 0 12 MONTHS Total 12 12 12 36 MONTHS
12 The data on production and on the factors of production allowed us to calculate the respective productivities of the ER, in each year. (Table 5 & Graph 2)
2002 2005 2006
PRODUCTIVITY
(EQ PATIENTS / HOUR) 0,13 0,20 0,27 PRODUCTIVITY
VARIATION 53,8% 107,69%
The Kruskall-Wallis Test showed that there were statistically significant differences between the productivity of the several years ( =31,135; N=36; p<0,001) and the Mann-Wittney U Test that those differences occurred between 2002 and 2005 and between 2005 and 2006.
0 20000 40000 60000 80000 100000 120000 140000 160000 180000 200000 2002 2005 2006 Dedicated Team Hours Regular Hours (12h/week) Overtime / Supp. / Preventions Consultancy Hours YEAR
Table 5 & Graph 2: Productivity in the ER
P RODU CT IVI T Y
13
COST WITH THE FACTORS OF PRODUCTION
Table 6 presents the evolution in the cost of the factors of production throughout the period of our analysis, after adjustments for inflation are made. There is a clear decrease in the cost with the factors of production in the medical field in the ER, yet bellow that of the productivity increase described above.
CAREER CATEGORY
2002 2005 2006
COST WITH FACTORS OF
PRODUCTION (in 2012 values) 6 544 622€ 4 695 463€ 3 602 738€
VARIATION OF COSTS -28,25% -44,95%
COST / EQ PATIENT (in 2012 values) 165,48€ 98,20€ 67,65€
PROJECTION OF THE DEDICATED SURGICAL TEAM
The production in General Surgery and Orthopaedics in the ER in 2012, which we have used for planning the dedicated team, is summarized in table 7.
The number of patients treated by these specialities accounts for approximately 50% of the number treated by the dedicated medical team, in an equitable distribution between General Surgery and Orthopaedics.
Furthermore, production in these specialities presented high quality indicators, not only when compared with the medical dedicated team, but also in absolute terms, as one can see by its Production Quality Index of almost 1.
PRODUCTION IN THE ER 2012 NUMBER OF VISITS 24089 DISCHARGES GENERAL SURGERY 12002 (49,8%) ORTHOPAEDICS 12087 (50,2%) QUALITY INDICATORS TOTAL TIME IN THE ER (AVERAGE ± SD) 03:03:22 ± 03:13:06 READMISSION RATE AT 24H 0,54% READMISSION RATE AT 48H 1,02% READMISSION RATE AT 72H 1,60% MORTALITY RATE 0,01%
14
HOSPITALISATION RATE 12,24%
DROP-OUT RATE 1,96%
QUALITY-ADJUSTED PRODUCTION
NUMBER OF EQUIVALENT PATIENTS 23350,15 SCORE OF TOTAL TIME IN THE ER 22519,96
SCORE OF READMISSIONS 23912,5
SCORE OF DROPOUTS 23618
PRODUCTION QUALITY INDEX 0,97
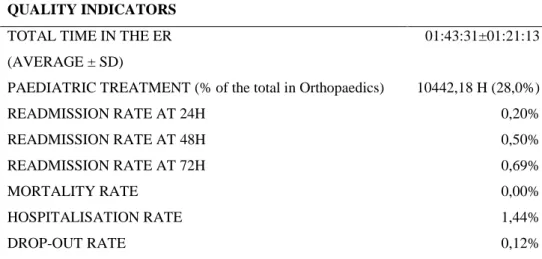
In the projection of the dedicated surgical team, we have also considered the consultancy in Paediatric Orthopaedics and the production in the OR, as shown in Tables 8 and 9. While the emergent production in the OR accounted for just a small proportion of these specialities’ total volume in the ER, the consultancy in the Paediatric ER had a significant production volume, accounting for one third of the total ER visits in Orthopaedics and nearly one fourth of the total period of this speciality in the ER. On the other hand, the quality of this production was extremely high, with even better quality indicators than those described for the General ER.
PRODUCTION IN THE PAEDIATRIC ER
2012
NUMBER OF VISITS (% of the total in Orthopaedics) 6052 (33,4%)
QUALITY INDICATORS TOTAL TIME IN THE ER (AVERAGE ± SD)
01:43:31±01:21:13
PAEDIATRIC TREATMENT (% of the total in Orthopaedics) 10442,18 H (28,0%)
READMISSION RATE AT 24H 0,20% READMISSION RATE AT 48H 0,50% READMISSION RATE AT 72H 0,69% MORTALITY RATE 0,00% HOSPITALISATION RATE 1,44% DROP-OUT RATE 0,12% QUALITY-ADJUSTED PRODUCTION
NUMBER OF EQUIVALENT PATIENTS 5991,5
PRODUCTION QUALITY INDEX 0,99
Table 7: Quality Indicators of the Surgical production
15
CAREER CATEGORY
2012
EMERGENT SURGERY (% of total) 991 (32,4%) DEFERRED SURGERY (% of total) 42 (1,4% ELECTIVE SURGERY (% of total) 2022 (66,2%) TOTAL TIME IN THE OR -
EMERGENT S. (% of total time) 1582,14 H (2,1%)
In order to fulfill the set of production outlined above, the factors of production allocated were of 105 414 hours, divided by 65472 hours of regular work and 27135, 12435 e 372 of overtime, supplements and preventions, respectively.
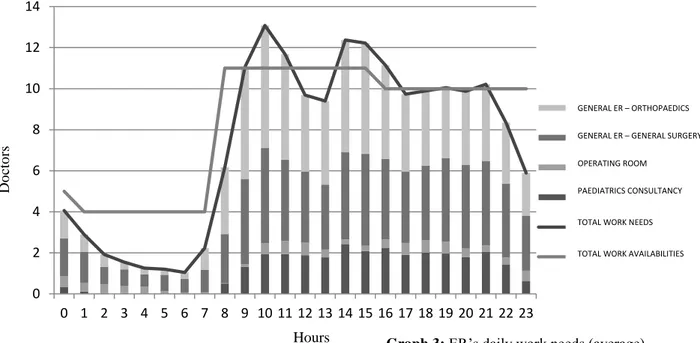
The data on production and on factors of production allowed us to estimate the baseline productivity of Orthopaedics and General Surgery in the ER in 0,22 equivalent patients per hour, to which we have applied the productivity variation in relation to 2006, in the medical field of the ER (107,69%). In the paediatrics’ consultancy and in the OR production, since we have not used the productivity variation mentioned, as these were not activities delivered by the medical team, we have estimated the number of hours to allocate to these activities by using the baseline productivity of the paediatrics’ consultancy in 2012 – 0,55 equivalent patients per hour – and the double of the total duration of each emergent surgery, assuring therefore the presence of 2 doctors in each surgery. Graph 3 presents the average daily needs of the ER, and the availability of resources, with the model we have developed. The analysis of the graph clarifies the existence of 3 distinct periods in patient-flow in the ER, with a higher need for human resources during the morning and afternoon hours - when there is an occasional under-allocation of resources - a lesser need in the late afternoon and minimal during the night. On the other hand, while the paediatrics’ production follows, lato senso, this same pattern, the production in the OR is more constant, with a high number of surgeries even during the night shift.
16 Considering these different productions, we have estimated the best constitution for the dedicated team, in each production scenario (Table 10), excluding the 12 hours of weekly work performed in the ER by the 42 general surgery and orthopaedics’ resident doctors that work in the ER nowadays. The dedicated team that guarantees the production of the General ER is made up of 19 doctors, 12 Orthopaedists and 7 General Surgeons, while the paediatrics’ consultancy would require recruiting an additional 6 Orthopaedists and the OR production 1 more General Surgeon.
The team made up of hypothetical “Emergency General Surgeons” would require 2 doctors less, in each scenario, in order to ensure the same level of production of the teams mentioned above
(Table 11).
CONSTITUTION OF THE DEDICATED TEAM
EMPLOYMENT CONTRACT (40H)
PRODUCTION IN THE GENERAL ER 18,4
NUMBER OF ORTHOPAEDISTS 11,5
NUMBER OF GENERAL SURGEONS 6,9
PRODUCTION IN THE GENERAL AND PAEDIATRICS ER 24,4
NUMBER OF ORTHOPAEDISTS 17,5
NUMBER OF GENERAL SURGEONS 6,9
PRODUCTION IN THE GENERAL AND PAEDIATRICS ER AND OR 25,4
NUMBER OF ORTHOPAEDISTS 17,5
NUMBER OF GENERAL SURGEONS 7,9
(horas) (m édi co s) 0 2 4 6 8 10 12 14 0 1 2 3 4 5 6 7 8 9 10 11 12 13 14 15 16 17 18 19 20 21 22 23 "SU GERAL -ORTOPEDIA" SU GERAL - CIRURGIA GERAL BLOCO SU ORTOPEDIA INFANTIL NECESSIDADES LABORAIS DISPONIBILIDADES LABORAIS Do cto rs GENERAL ER – ORTHOPAEDICS
GENERAL ER – GENERAL SURGERY OPERATING ROOM
PAEDIATRICS CONSULTANCY
TOTAL WORK NEEDS
TOTAL WORK AVAILABILITIES
Graph 3: ER’s daily work needs (average) Hours
17
“EMERGENCY GENERAL SURGEONS” TEAM
EMPLOYMENT CONTRACT (40H)
PRODUCTION IN THE GENERAL ER 16,4
PRODUCTION IN THE GENERAL AND PAEDIATRICS ER 22,4
PRODUCTION IN THE GENERAL AND PAEDIATRICS ER AND OR 23,4
In the annex, (annex 2) we present an (informal) analysis of the sensitivity of our model of determination of the dedicated team, where we highlight, on the one hand, the high efficiency of the model (it needs only 100h of work for each 95h of needs in the provision of care in the ER) and, on the other hand, the inexpressive variation in the quality of care delivered (-0,3% in relation to 2012). From the current costs of human resources of General Surgery and Orthopaedics that are allocable to the ER, we present in table 12 the variation of the costs in the ER, considering the different scenarios we have identified for the constitution of the dedicated team and the different income levels of the doctors recruited. We have considered, for instance, the variation in the ER costs with recruiting a team by the salary table in force (minimum cost) and with an additional 30% fee over the minimum salary, seen as an incentive for the singularity of the ER work. We have also calculated the maximum salary, considering that there would not be a cost reduction with the creation of the dedicated team. COST ANALYSIS ΔC (2012 – 2014) (ΔC=0) MINIMUM COST (S= 2746,24€) INTERMEDIARY COST (S= 3570,11€) MAXIMUM COST (AVERAGE SALARY)
DEDICATED TEAM (GENERAL ER) -55,7% -42,4% 6197,49€
DEDICATED TEAM (GENERAL ER
+ PAEDIATRICS ER) -42,5% -25,2% 4773,77€
DEDICATED TEAM (GENERAL
AND PAEDIATRICS ER + OR) -46,3% -30,2% 5112,20€
Table 12: Cost Analysis of the Dedicated ER Surgical Team Table 11: Constitution of the “Emergency General Surgeons” Team
18 DISCUSSION
In this study, we have evaluated the productivity variation that has taken place with the formation of a dedicated medical team in the ER, as a way of projecting the creation of a new dedicated team, but in the surgical field. Despite the model of a dedicated medical team is fairly widespread in the Portuguese ERs, to our knowledge, our study is the first to evaluate its impact and this makes comparison with other authors more difficult.
Throughout the time horizon of our analysis, we have estimated a productivity variation in the medical human resources of 53,8% relative to 2005 and 107,7% relative to 2006. For these pronounced differences in productivity, the factors that contributed were not only an increase in the number of patients treated, by 25 and 40%, but also a reduction in the number of work hours, by 22 and 36%, managed both in regular work hours and in overtime hours. As for the productivity variation between 2005 and 2006, there may have been an impact from the increase in the quality-adjusted production, but mainly by the reduction of the work hours, sspecially the regular work hours (12 hours per week in the ER) of the Internal Medicine specialists, which seems to indicate the progressive nature of the transformation between models.
Despite their totally different methodological approach, Austin et al. (2005) have also reported an increase in the volume of patients treated in the ER, with the creation of a dedicated team, in their case a surgical team. Also relevant to our study is the fact that these authors have underlined the diversity of clinical presentations and surgical procedures performed as a crucial factor for the success of the team. Such diversity will certainly be even more important in Portugal for the motivation and labour stability of a dedicated surgical team, in the light of the nonexistence of a formally established career in this field.
The evaluation of the quality of production has shown a significant reduction in the average score of the equivalent patient between 2002 and 2005 and 2006. In a separate analysis, we have verified that this reduction occurred mainly in the “total duration of the ER visit” and in the “patient drop-outs” criteria, two of the components of the equivalent patient score.
We have hypothesised that this difference may be due to the influence of the formalisation of the Manchester Triage in the ER during the period of implementation of the dedicated team, which may have led to an increase in the average duration time of the ER visit and in the drop-out rate in the less severe visits, which account for the highest share of the ER’s volume (CRRNEU, 2012).
The total duration of the ER visit and, to a lesser extent, the mortality rate and the hospitalisation rate were the variables where we found the highest relation to the average score of the equivalent patient, as would be expected from the criteria we have used in its definition. As for the influence of the
19 distance from the centre of the patient’s municipality to the ER, it may be related to the increase in patients from Porto and Gondomar, neighbouring municipalities of the CHSJ, and the relative reduction in the number of patients from Maia, Matosinhos and other more distant municipalities, due to changes in the hospital reference network.
The analysis of the costs of the factors of production has shown a sharp reduction between 2002 and 2005 and 2006. However, this reduction was lower than the productivity variation, which is probably attributable to the intrinsic cost of setting up the dedicated team (setup costs). Furthermore, we have found a reduction in the costs of the factors of production between 2005 and 2006, due to the previously-mentioned decline in the number of Internal Medicine doctors in the ER, and also to the reduction in the total cost spent on the dedicated team, even in the context of an increase of its size in 2006. These two circumstances support our hypothesis of an evolution in the dedicated model between 2005 and 2006, with a significant enhancement of the efficiency in the allocation of factors of production to the dedicated team and in the remuneration levels established.
The quality-adjusted production that set the basis for our production of the dedicated surgical team had quality indicators significantly higher than those we had found in the medical field. That may indicate that the surgical production in the ER is already facing “diminishing marginal returns”, ie. improvements in the quality-adjusted production may be difficult to get without employing a considerable amount of resources. In this regard, it is reasonable to admit that the increase in productivity will be due to the reduction in the factors of production, namely the regular work hours allocated to the ER and the overtime hours. Moreover, in the remaining surgical specialities, which are already on a consultancy basis in the ER, despite not having a productivity variation which overlaps that estimated in the medical benchmarking, a decrease is to be expected in the number of annual consultancies with the creation of the dedicated team, albeit slight and deferred in time, due to a likely absorption of those visits by the dedicated team.
The different constitutions of the dedicated team that we have considered highlight the distinct relative importance of the production of the Paediatrics ER and of the ER’s OR in the total workload of the team. While production in the OR, considering its marginal proportion and its predominance at night time, when there is overallocation of resources, may easily be ensured without extra costs for the hospital (for instance, with the support of physicians from the General Surgery and Orthopaedics departments, when needed), production in the Paediatrics ER, considering its volume and its continuous year-round nature, will certainly require the employment of additional resources. The decision to keep this production in the General ER or create a specific team for Paediatrics Orthopaedics should take into account not only the resources needed to deliver that service, but also the current excellent health outcomes we have brought into being.
20 Our projection of a team made of “Emergency General Surgeons” emphasizes the accrued costs for the hospital which come from the fact that the elasticity of substitution between General Surgery and Orthopaedics in the ER is currently 0 (a situation where the factors of production are perfect complements, also known as the Leontief production function), caused by the nonexistence of the medical speciality of “Emergency General Surgery”.
Finally, it is worth mentioning that the success of the dedicated model is strongly dependent on the political background of Health Care, in the way that releasing the doctors belonging to other departments from their ER duties shall be used for performing additional normal production, ie. reducing waiting times, or even extraordinary production, which may be difficult if the Contratos-Programa (Contracts) with the hospitals are too strict. With the prospect of an overallocation of resources in these departments, choosing to recruit the dedicated surgical team internally may be a solution to avoid overburdening hospital costs.
LIMITATIONS
Our study has several limitations. The most significant arises from our need to use data from 2002 to estimate the productivity of the classic model, increasing the probability of misclassifying doctors. Even so, we have tried to minimize that possibility by confirming the doubtful cases both in the online database of the Ordem dos Médicos (Medical Association) and in the CHSJ’s Human Resources database.
On the other hand, throughout the study, every time we had to make any decision about including or excluding factors of production or ED visits, we always adopted a conservative approach, ie. underestimating the productivity of the dedicated medical team and therefore minimizing the risk of underestimating the future size of the dedicated surgical team. Hence, one may consider that the risk of our model is in overestimating the size of the surgical team, which may be adjusted throughout time, with a lesser risk of deteriorating the quality of care provided in the ER, something that would be explicitly opposite to the goal of setting up a dedicated team.
One other limitation lies in the use of a heuristic model in order to reach a solution for the constitution of the dedicated team, since we cannot ensure that our solution is optimal. Even though resorting to more complex algorithms is particularly desirable in the (optimal) allocation of public resources, designing such a tool lies absolutely out of the focus of this study. Furthermore, we have not only designed a model with high efficiency levels, but have also embedded in it the ideas that work best in the context of the ER, such as the division of work in shifts, possibly more beneficial than a chaotic solution with multiple scheduling, even though technically more efficient.
21 Lastly, some limitations that are drawn from our score of equivalent patient are the absence of information about the severity of the patient during the admission, since there was not yet in place a priority triage system during those years, or the subjective determination of the criteria that was part of that score. However, not only is that criteria extensively described in the national (CRRNEU,2012) and international (Position Statement of Emergency Surgery, RACS, 2008) literature, but also the use of other cut-offs (total time of the ED visit< 4 hours ; non-equitable weighting of the different components of the score) did not change significantly the results we have described, a hypothesis that we have tested to measure the sensitivity of our score.
Nevertheless, whilst the efficiency improvements with the reduction in the factors of production are manifest, information on the quality of care delivered by the dedicated model should be further assessed.
CONCLUSION
In our study, we have projected a dedicated surgical team for the CHSJ’s ER with 19 physicians – 12 Orthopaedists and 7 General Surgeons – to which should be added 6 Orthopaedists in order to keep delivering the service of consultancy to the Paediatric ER.
For this projection, we have used the productivity variation calculated in the creation of the dedicated medical team, between 2002 and 2006, which we have estimated at 107,69%.
The recruitment of these professionals in accordance with the salary tables in force may allow cost savings with the surgical work in the ER of 25 to 55%.
22 REFERENCES
Austin M, Jose J, Feurer I, Miller R, May A, Guillamondegui O, Pinson C, Morris J. Creating an Emergency General Surgery Service enhances the productivity of trauma surgeons, general surgeons and the hospital. The Journal of Trauma 2005; 58-5: 906-910
Baumol W. Health Care, education and the cost disease: a looming crisis for public choice. Public Choice; 77: 17-28
Ciesla D, Moore E, Moore J, Johnson J, Cothren C, Burch J. The Academic Trauma Center Is a Model for the Future Trauma and Acute Care Surgeon. The Journal of Trauma 2005;58-4: 657-662
Directive 2001/19/EC of the European Parliament and of the Council, Official Journal of the European Communities, 2001 L 206/1
Legislative Order number 11/2002, Ministry of Health, 2002
Miller P, Wildman E, Chang M, Meredith J. Acute Care Surgery: Impact on Practice and Economics of Elective Surgeons. Journal of the American College of Surgeons 2012;214:531–538
Pryor J, Reilly P, Schwab C, Kauder D, Dabrowski G, Gracias V, Braslow B, Gupta R. Integrating Emergency General Surgery with a Trauma Service: Impact on the Care of Injured Patients. The Journal of Trauma 2004;57-3: 467-473
Qureshi A, Smith A, Wright F, Brenneman F, Rizoli S, Hsieh T, Tien H. The Impact of an Acute Care Emergency Surgical Service on Timely Surgical Decision-Making and Emergency Department Overcrowding. Journal of the American College of Surgeons 2011;213:284–293
Report “Comissão para a Reavaliação da Rede Nacional de Emergência e Urgência”, 2012
Salas E, Rosen M, King H. Managing teams managing crises: principles of teamwork to improve patient safety in the Emergency Room and beyond. Theoretical Issues in Ergonomics Science, 8:5, 381-394
23 Shakford S. The Future of Trauma Surgery – A Perspective. The Journal of Trauma 2005;58-4: 663-667
24 ACKNOWLEDGMENTS
I am indebted to Professor José Artur Paiva, who supervised my thesis, for his helpful criticism and advice.
I also owe a debt of gratitude to Lídia Castro (Serviço de Controlo de Gestão), for her invaluable help and patience during the process of
collecting the data.
In the course of developing this work, I have benefited from precious conversations and/or comments on previous drafts from Sofia Vaz, to
whom I am particularly grateful.
“Não se descobrem novas terras sem estar disposto a perder de vista a costa, por muito tempo” Os Moedeiros Falsos, André Gide
25 ANNEXS
ANNEX 1
ANNEX 2
SENSITIVITY ANALYSIS
EFFICIENCY OF THE HEURISTIC MODEL (AVERAGE) 95,3%
DIFFERENCE IN THE NUMBER OF DOCTORS FOR THE BEST POSSIBLE COMBINATION (AVERAGE)
+ 1 DOCTOR
WORK HOURS NOT SATISFIED (AVERAGE) 195,67
QUALITY VARIATION IN RELATION TO 2012 (% IN EQUIVALENT PATIENTS)
-0,3%
PATIENTS WITH TRIAGE “YELLOW”, “ORANGE” OR “RED” WITH
WAIT TIME HIGHER THAN CURRENT WAIT TIME 0
ANNEX 3
HIGHLIGHTS REQUIRED BY THE JOURNAL OF HEALTH ECONOMICS
We project a dedicated surgical team for the Emergency Room.
We use the productivity variation with the creation of a dedicated medical team in that ER.
We project a team with 19 doctors – 12 Orthopaedists and 7 General Surgeons.
Creating a dedicated team in the ER will allow important cost savings. Type III Sum of
Squares
Df Mean Square F Sig.
Corrected Model 1247,467a 11 113,406 10225,292 ,000 Intercept 2750,143 1 2750,143 247967,329 ,000 HOSPITALISATION 9,335 1 9,335 841,695 ,000 MORTALITY 5,482 1 5,482 494,262 ,000 YEAR ,439 2 ,219 19,780 ,000 TIME IN THE ER 1108,040 1 1108,040 99906,688 ,000 AGE 4,898 1 4,898 441,612 ,000 DISTANCE ,102 1 ,102 9,189 ,002 Error 1700,078 153288 ,011 Total 131949,063 153300 Corrected Total 2947,545 153299 Adjusted R2= ,423
26 JOURNAL OF HEALTH ECONOMICS (J HEALTH ECON) – GUIDE FOR AUTHORS
Article structure
Essential title page information
• Title. Concise and informative. Titles are often used in information-retrieval systems. Avoid abbreviations and formulae where possible.
• Author names and affiliations. Where the family name may be ambiguous (e.g., a double name), please indicate this clearly. Present the authors' affiliation addresses (where the actual work was done) below the names. Indicate all affiliations with a lower-case superscript letter immediately after the author's name and in front of the appropriate address. Provide the full postal address of each affiliation, including the country name and, if available, the e-mail address of each author. • Corresponding author. Clearly indicate who will handle correspondence at all stages of refereeing and publication, also post-publication. Ensure that phone numbers (with country and area code) are provided in addition to the e-mail address and the complete postal address. Contact details must be kept up to date by the corresponding author.
• Present/permanent address. If an author has moved since the work described in the article was done, or was visiting at the time, a 'Present address' (or 'Permanent address') may be indicated as a footnote to that author's name. The address at which the author actually did the work must be retained as the main, affiliation address. Superscript Arabic numerals are used for such footnotes.
Abstract
A concise and factual abstract is required. The abstract should state briefly the purpose of the research, the principal results and major conclusions. An abstract is often presented separately from the article, so it must be able to stand alone. For this reason, References should be avoided, but if essential, then cite the author(s) and year(s). Also, non-standard or uncommon abbreviations should be avoided, but if essential they must be defined at their first mention in the abstract itself.
Highlights
Highlights are mandatory for this journal. They consist of a short collection of bullet points that convey the core findings of the article and should be submitted in a separate file in the online submission system. Please use 'Highlights' in the file name and include 3 to 5 bullet points (maximum 85 characters, including spaces, per bullet point).
27
Keywords
Immediately after the abstract, provide a maximum of 6 keywords, using either British or American spelling, but be consistent, and avoiding general and plural terms and multiple concepts (avoid, for example, "and", "of"). Be sparing with abbreviations: only abbreviations firmly established in the field may be eligible. These keywords will be used for indexing purposes.
Classification codes
Please provide up to 6 standard JEL codes.
Artwork
Color artwork
Please make sure that artwork files are in an acceptable format (TIFF (or JPEG), EPS (or PDF), or MS Office files) and with the correct resolution. If, together with your accepted article, you submit usable color figures then Elsevier will ensure, at no additional charge, that these figures will appear in color on the Web (e.g., ScienceDirect and other sites) regardless of whether or not these illustrations are reproduced in color in the printed version. For color reproduction in print, you will receive information regarding the costs from Elsevier after receipt of your accepted article. Please indicate your preference for color: in print or on the Web only.
Please note: Because of technical complications which can arise by converting color figures to 'gray scale' (for the printed version should you not opt for color in print) please submit in addition usable black and white versions of all the color illustrations.
References
Web references
As a minimum, the full URL should be given and the date when the reference was last accessed. Any further information, if known (DOI, author names, dates, reference to a source publication, etc.), should also be given. Web references can be listed separately (e.g., after the reference list) under a different heading if desired, or can be included in the reference list.
Reference management software
This journal has standard templates available in key reference management packages EndNote and Reference Manager. Using plug-ins to wordprocessing packages, authors only need to select the appropriate journal template when preparing their article and the list of references and citations to these will be formatted according to the journal style which is described below.
28
Reference Style
All citations in the text should refer to:
- Single Author: the Author's name (without initials, unless there is ambiguity) and the year of publication;
- Two Authors: both Authors' names and the year of publication; -Three or more Authors: first Author's name followed by "et al." and the year of publication. Examples: "as demonstrated in (Allan, 1996a, 1996b, 1999; Allan and Jones, 1995). Lee et al. (2000) have recently shown"
In the references list references should be arranged first alphabetically and then further sorted chronologically if necessary. More than one reference from the same Author(s) in the same year must be identified by the letters "a", "b", "c", etc., placed after the year of publication. Examples: Reference to a journal publication:
-Griffiths W, Judge G. Testing and estimating location vectors when the error covariance matrix is unknown. Journal of Econometrics 1992;54; 121-138 (note that journal names are not to be abbreviated).
Reference to a book:
-Hawawini G, Swary I. Mergers and acquisitions in the U.S. banking industry: Evidence from the
capital markets. North-Holland: Amsterdam; 1990.
Reference to a chapter in an edited book:
-Brunner K, Melzer AH 1990. Money Supply. In: Friedman BM, Hahn FH (Eds), Handbook of monetary economics, vol.1. North-Holland: Amsterdam; 1990. p. 357-396.
Submission checklist
The following list will be useful during the final checking of an article prior to sending it to the journal for review. Please consult this Guide for Authors for further details of any item. Ensure that the following items are present:
One author has been designated as the corresponding author with contact details: • E-mail address
• Full postal address • Phone numbers
All necessary files have been uploaded, and contain: • Keywords
• All figure captions