All rights me&&. Printed in Great Britain 0308-8146/97 $17.00+0.00 PII:SO308-8146(96)00323-8
Effects of ripening time and combination of ovine
and caprine milks on proteolysis of Picante
cheese*
A. Cristina Freitas,” J. Maria Fresno,b Bernard0 F%ieto,b
F. Xavier Malcataat
& Javier Carballo’
“Escola Superior de Biotecnologia, Universidade Catdlica Portuguesa. 4200 Porto, Portugal bDepartamento de Higiene y Tecnologia de 10s Alimentos, Universidad de Lkon, 24071 tion, Spain cArea de Tecnologia de 10s Alimentos, Facultad de Ciencias de Orense, Universidad de Vigo, 32004 Orense, Spain
(Received 15 May 1996; revised version received 30 September 1996; accepted 30 September 1996)
Proteolysis in Picante cheese was characterized by assaying for breakdown pro- ducts throughout a 180 day ripening period using different combinations of ewe’s and goat’s milks. Parameters analysed were total nitrogen (TN), water-soluble nitrogen (WSN) and non-protein nitrogen (NPN) using Kjeldahl and spectro- photometric methods, and casein profile by electrophoresis. WSN at 180 days of ripening was 2529% TN. The maximum NPN values were attained by 180 days of ripening and corresponded to 87% and 92% of the WSN in OC and lOOC, respectively (where iC denotes a cheese manufactured with i% caprine milk). Statistically significant correlations were obtained between the various analytical methods of assay for nitrogen and ripening time. The spectrophotometric meth- ods using either trinitrobenzenesulphonic acid or cadmium-ninhydrin proved satisfactory in assessing the ripening index (instead of the Kjeldahl method). Degradation of /J-caseins at 180 days was 18.8,26.4,40.2, 55.6 and 36.5% for OC, 25C, 5OC, 75C and 1 OOC, respectively. Degradation of cw,-caseins by 180 days was
35.9,40.2, 81.8,93.0 and 68.7% for OC, 25C, 5OC, 75C and lOOC, respectively. In general, a higher cheesemaking milk fraction of caprine milk was associated with higher amounts of y-caseins. 0 1997 Elsevier Science Ltd
INTRODUCTION
Picante cheese is a hard, spicy and heavily salted Por-
tuguese traditional cheese. This type of cheese is manu- factured at the farm level only from mixtures of ovine and caprine raw milks using commercial calf rennet without any starter culture, and is ripened for a long period of time (Cruz, 1945) in rooms without tempera- ture or humidity control on layers of wheat straw and sand. As happens with other Portuguese traditional cheeses, scant data are available on biochemical and microbiological aspects of Picante cheese, and not until recently was information available on physicochemical and microbiological aspects of Picante cheese (Freitas et *Part of the data reported in this paper was presented as a poster communication entitled ‘Proteolysis of Picante cheese: effects of ripening time and combination of ovine and caprine milks’ at the EAAP-CIHEAM-FAO International Sympo- sium: Basis of the Quality of Typical Mediterranean Animal Products, 29 September to 2 October 1996, Badajoz, Spain.* +To whom correspondence should be addressed.
219
al., 1995, 1996) and the influence of several technologi- cal parameters on its final characteristics (Freitas &z Malcata, 1996).
It is commonly accepted that cheese ripening is char- acterized by a network of complex physical, chemical and microbiological changes that affect the major com- ponents of the cheese matrix (Fernandez-Salguero et al., 1989). Attempts to monitor this process have led to development of objective physicochemical indices which will eventually be useful in predicting the final quality of cheese. For most hard and semi-hard cheese varieties, proteolysis is the most commonly used index of maturation (Farkye & Fox, 1990) and it is also helpful in evaluating starter culture performance (Fox, 1989) because proteolysis strongly contributes to flavour and texture development (Guinee 8z Wilkinson, 1992). Sev- eral techniques for measuring proteolysis in cheese have been developed and reviewed (Fox, 1989). In attempts to characterize the proteolysis in Picante cheese, several such methods were tested and compared (e.g. Kjeldahl protein determination, spectrophotometry and electro-
phoresis). In addition, changes in the nitrogen fractions and intact casein in Picante cheese throughout a
180 day ripening period were followed and the effects of different proportions of ovine and caprine milks were ascertained.
MATERIALS AND METHODS Manufacture and sampling
Five batches of mixtures of raw caprine and ovine milks from selected flocks at the ratios O/l00 (caprine/ovine), 25175, SO/SO, 75125, and 100/O (%, v/v) were prepared. These batches will be denoted hereafter as OC, 25C, 5OC, 75C, and lOOC, respectively. For each batch, 90 litres of milk were used to manufacture 20 cheeses according to traditional procedures (Freitas et al., 1996). Namely, milk was coagulated with calf rennet in liquid form (Fabre, Monza, Italy) without addition of a starter culture; the fresh cheeses were rubbed with dry salt after manufacture, and the cheeses ripened for a minimum of 4 months by appropriate piling up on straw and sand in maturation rooms.
Ten cheeses (two cheeses from each batch) were taken randomly and sent under refrigerated conditions to our laboratory for analysis at 0, 9, 25, 40, 55, 83, 110, 140 and 180 days of ripening (counted from the time that the first salting procedure was complete). The resulting experimental layout was thus in accordance with a (duplicated) 5x9 full factorial design. Samples of milk were also taken for analysis at 0 days.
Compositional analyses
Compositional analyses were done according to Richardson (1985) and Kosikowski (1982). The pH was measured with an electrode for solids (Ingold, Urdorf, Switzerland) connected to a potentiometer MicropH 2001 (Crison, Barcelona, Spain). The moisture content was determined gravimetrically after drying at 100°C in an oven (Memmert, Schwabach, Germany). The NaCl content was determined by the modified Volhard method using AgNOs and KCNS (Merck, Darmstadt, Germany). Fat content was determined by the Van Gulik method (Anonymous, 1975) using 40% H$SOd and isoamyl alcohol (Pronalab, Lisbon, Portugal). Titrable acidity was determined according to AOAC (1990).
Chemical analysis
Nitrogen fractions
Total nitrogen (TN), water-soluble nitrogen (WSN) and non-protein nitrogen (NPN) were determined by the micro-Kjeldahl method using a Kjeltec System 1002 distilling unit (Tecator, Hogan&, Sweden). WSN was obtained via fractionation with water according to
Kuchroo & Fox (1982), followed by acidification to pH 4.3 with 1.41 N HCl (Pronalab). The NPN fraction, i.e. the nitrogen fraction soluble in 12% trichloroacetic acid (TCA), was prepared by adding 7.5 ml of an aqueous solution of 48% (w/v) TCA (Merck) to 22.5 ml of WSE (water-soluble extract); the mixture was allowed to stand for 30 min at room temperature and then filtered through Whatman No. 42 filter paper (Maidstone, UK). Aliquots from WSN and NPN (5 ml) were then ana- lysed by the micro-Kjeldahl method.
The spectrophotometric method of Adler-Nissen (1979) with modifications, which comprises use of 2,4,6- trinitrobenzenesulphonic acid (TNBS; Fluka Biochem- ika, Buchs, Switzerland) was also used to quantify the NPN and N-PTA fractions. The N-PTA fraction, i.e. the nitrogen fraction soluble in 5% phosphotungstic acid (PTA), was prepared by adding 14.0 ml of an aqu- eous solution of 3.95 M H2S04 (Pronalab) and 6 ml of 33.3% (w/v) PTA (Merck) to 20 ml of WSE; the mix- ture was allowed to stand overnight at 4°C and subse- quently filtered through Whatman No. 42 filter paper. In order to distinguish the NPN results obtained by the Kjeldahl method and by the spectrophotometric method, the former will hereafter be denoted as simply NPN and the latter as N-TCA. Samples (0.2 ml) of N- TCA or N-PTA were diluted in 0.1 M sodium tetrabo- rate or 4.0% sodium bicarbonate, respectively, and treated with 1.0 ml of 0.1% TNBS. The mixtures were heated at 50°C for 1 h; 2.5 ml of 0.2 M HCl were added to quench the reaction, and were cooled to room tem- perature; absorbance was then read at 340 nm.
The evolution of free amino acid nitrogen (N-NH2) was monitored according to Folkertsma & Fox (1992) using the cadmium-ninhydrin reagent (Sigma, St Louis, MO, USA). A sample (25-50 ~1) of WSE was diluted to 1 ml with distilled water; to this, 2 ml of cadmium-nin- hydrin reagent were added. The mixture was heated at 84°C for 5 min, cooled to room temperature, and absorbance was read at 507 nm.
Stock solutions of 2 mM leucine (Sigma) and 1 mM glycine (Merck) were used to obtain calibration curves for the cadmium-ninhydrin and the TNBS spectopho- tometric methods, respectively.
All analyses were perfomed in duplicate, and the average of each pair of determinations was used as a datum point.
Casein degradation
Degradation of casein was assayed by urea-polyacryl- amide gel electrophoresis (PAGE) (10.5% T, 4.8% C) according to the method of Andrews (1983) with modi- fications using a Protean II XI vertical slab-gel unit (Bio-Rad Laboratories, Watford, UK). The cheese samples were prepared according to Farkye et al. (199 1), with modifications. The gels were stained with Coo- massie Blue G-250 (Bio-Rad, Richmond, CA, USA) according to the method of Blakesley & Boezi (1977). Ovine and caprine casein standards were purchased
Statistical analysis
Table 1. Composition of ovine and caprine milks and mixtures thereof used for the mamhcture of the various experimental
Cheeses
Type of Cheese pH Acidity Total fat Casein Density
cheese milk (“D) (%I W) (g m-3)
oc Ovine 6.72 30.0 5.80 4.47 1.036 Ovine 6.71 29.0 6.00 4.40 1.035 25c Caprine 6.70 25.0 5.90 3.15 1.030 Mixture 6.70 28.0 5.95 3.96 1.035 Ovine 6.70 29.5 5.10 4.40 1.035 5oc Caprine 6.62 23.0 5.30 3.70 1.028 Mixture 6.65 26.5 5.20 3.95 1.033 Ovine 6.65 29.0 5.30 4.20 1.036 75c Caprine 6.68 27.0 5.40 3.08 1.031 Mixture 6.68 27.5 5.40 3.37 1.032 1ooc Caprine 6.62 22.5 6.10 3.20 1.031
Linear relationships between the various methods of assessment of proteolysis with respect to ripening time and cheesemaking milk composition, were statistically evaluated; for each significant effect, the corresponding difference was determined by ScheffG F multiple com- parison test at the 5% significance level. All statistical analyses were carried out with the StatView@ software v.4.01 (Abacus Concepts, Berkeley, CA, USA).
RESULTS AND DISCUSSION Compositional characteristics from Sigma. The evolution of the densitometric peak
areas associated with the various caseins throughout the ripening time was quantitatively assessed by the soft- ware package Diversity One@ 1.0 (pdi, New York, NY, USA) after having duly scanned the electrophoresis gels. All electrophoresis analyses were performed in dupli- cate.
Sensorial analysis
The results of the compositional analyses of the milks used in the manufacture of the five batches of Picante cheese are summarized in Table 1. Using a t-test, it was concluded that variations in pH were not significant between the averages for the ovine and caprine milks at the 5% level. The acidity values for ovine milk were higher than those for caprine milk, probably due to the higher content of casein in ovine milk. Conversely, the fat content of caprine milk was slightly above that of ovine milk.
Cheeses ripened for 180 days were assessed organolep- tically by a group of nine experienced panellists. Para- meters assessed were form (WI: 0, very bad; 4, very good), surface (O-4), texture (O-6) and flavour (O-6).
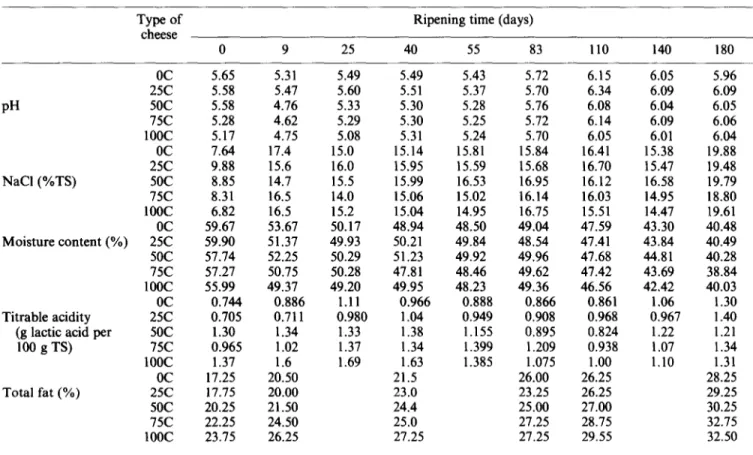
Table 2 summarizes the major compositional charac- teristics of the various experimental cheeses manufac- tured. The cheeses produced from caprine milk had the lowest moisture content during the early stages of
Table 2. Compositional characteristics of the various experimental cheeses Type
of
cheeseoc
25C PH 5oc 75c 1ooc 2:: NaCl (%TS) 5oc 75c 1OOc oc Moisture content (%) 25C Titrable acidity (g lactic acid per 100 g TS) Total fat (%) 5oc 75c 1OOc oc 25C 5oc 75c 1oOC oc 25C 5oc 75c 1ooc TS. total solids. - - 0 9 25 40 55 83 110 140 180 5.65 5.31 5.58 5.47 5.58 4.76 5.28 4.62 5.17 4.75 7.64 17.4 9.88 15.6 8.85 14.7 8.31 16.5 6.82 16.5 59.67 53.67 59.90 51.37 57.74 52.25 57.27 50.75 55.99 49.37 0.744 0.886 0.705 0.711 1.30 1.34 0.965 1.02 1.37 1.6 17.25 20.50 17.75 20.00 20.25 21.50 22.25 24.50 23.75 26.25Ripening time (days) - - 5.49 5.60 5.33 5.29 5.08 15.0 16.0 15.5 14.0 15.2 50.17 49.93 50.29 50.28 49.20 1.11 0.980 1.33 1.37 1.69 5.49 5.51 5.30 5.30 5.31 15.14 15.95 15.99 15.06 15.04 48.94 50.21 51.23 47.81 49.95 0.966 1.04 1.38 1.34 1.63 21.5 23.0 24.4 25.0 27.25 5.43 5.37 5.28 5.25 5.24 15.81 15.59 16.53 15.02 14.95 48.50 49.84 49.92 48.46 48.23 0.888 0.949 1.155 1.399 1.385 5.72 6.15 5.70 6.34 5.76 6.08 5.72 6.14 5.70 6.05 15.84 16.41 15.68 16.70 16.95 16.12 16.14 16.03 16.75 15.51 49.04 47.59 48.54 47.41 49.96 47.68 49.62 47.42 49.36 46.56 0.866 0.861 0.908 0.968 0.895 0.824 1.209 0.938 1.075 1 .oo 26.00 26.25 23.25 26.25 25.00 27.00 27.25 28.75 27.25 29.55 6.05 6.09 6.04 6.09 6.01 15.38 15.47 16.58 14.95 14.47 43.30 43.84 44.81 43.69 42.42 1.06 0.967 1.22 1.07 1.10 5.96 6.09 6.05 6.06 6.04 19.88 19.48 19.79 18.80 19.61 40.48 40.49 40.28 38.84 40.03 1.30 1.40 1.21 1.34 1.31 28.25 29.25 30.25 32.75 32.50
ripening; in general, a higher content in ovine milk led to a higher moisture content of the corresponding cheese. Table 1 indicates that the level of fat of both milk types was similar, but the level of casein was higher for ovine milk. Therefore, the observed differences in the moisture content of the cheeses may be attributed to the higher content in casein which leads to a higher water-holding capacity. This observation is in agree- ment with Mallatou et al. (1994) and Pappas et al. (1994) who reported that the moisture content of cheeses increases as the ratio of casein to fat in cheese milk increases. Such differences in moisture content tended, nevertheless, to vanish as ripening progressed.
Picante cheese is typically characterized by a high content of NaCl, as was confirmed by Table 2. The values for NaCl content at 0 days and 9 days of ripen- ing were due to the fact that the first salting procedure is performed on the fresh cheese and the second salting procedure normally takes place after about 1 week of ripening; hence, a considerable increase in NaCl content is expected from 0 days to 9 days (as observed in Table 2). Throughout the ripening period and for the different types of cheese, the values of NaCl showed considerable variability; this is likely the result of the way salting is done (manually and in a completely empirical fashion) and to the several washes with tap water throughout the ripening period. The increase of NaCl content from 140 to 180 days was somewhat unexpected; this probably resulted from inadvertent use of a strong brine to wash the experimental cheeses that had reached that stage in ripening, as is sometimes done by local manufacturers (especially during summer) in response to topical contamination by insects.
The mean pH values were lower for the cheeses with a lower content in caprine milk. This observation dis- agrees with results reported for the mean pH values by Mallatou et al. (1994) in their study of Feta cheese, where five compositions in ovine and caprine milks similar to those used in our study were considered. The magnitude of the pH range for the various cheeses decreased throughout ripening, and by 83 days it was virtually nil. The pH of all cheeses decreased until 55 days and then increased until the end of ripening. A similar pattern of pH change was observed in Feta cheese manufactured with ovine milk (Alichanidis et al.,
1984; Pappas et al., 1992). The lowest value of pH found for cheeses manufactured with caprine milk at 0 days could be attributed to the lower buffering capa- city of caprine milk derived from a lower protein con- tent (Simos et al., 1991) as can be concluded from inspection of Table 1.
The percentage dry matter increased by 47.6% for cheeses manufactured with ovine milk and by 36.3% for cheeses manufactured with caprine milk for the whole duration of the ripening period. These values are larger than those observed in Idiazabal cheese (22%) (Ibaiiez
et al., 1995) for a similar ripening time (i.e. 180 days).
Such large changes in total solids can be attributed to
surface evaporation (Schlesser et al., 1992), especially because Picante cheese does not develop an actual rind, as well as to diffusion of salt towards the interior of the cheese throughout ripening (Abo El-Ella et al., 1988; Schroeder et al., 1988; Zorrilla & Rubiolo, 1991).
With respect to total fat, higher contents were found in cheeses with higher contents of caprine milk, which correlates with the caprine milk fat content (see Table 1).
Nitrogen fractions
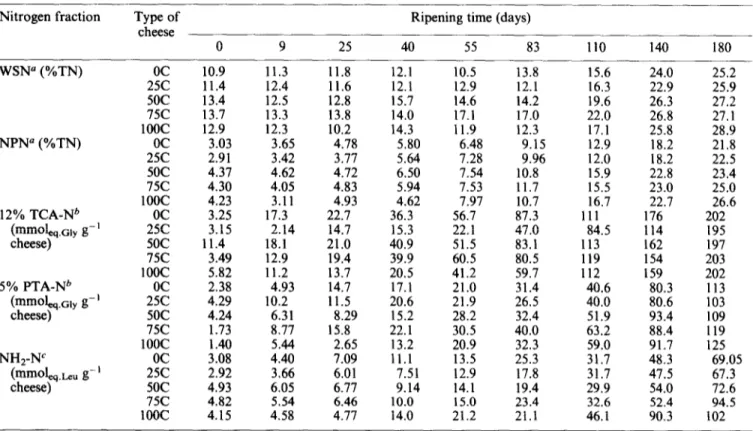
The results for the various nitrogen fractions through- out the ripening period for the different experimental cheeses are summarized in Table 3. The average varia- tions and corresponding standard deviations (through- out the whole 180 day ripening period) in total nitrogen as percentage of total solids were 5.51 f 0.11 for the OC cheeses, 5.14* 0.13 for the 25C cheeses, 4.78 f 0.19 for the 50C cheeses, 4.69 *0.20 for the 75C cheeses, and 4.54 & 0.19 for the 1OOC cheeses.
All nitrogen fractions showed significant increases during ripening. Levels of WSN reached 2529% by 180 days, which were higher than those observed in Idiazabal cheese (16.6%) (Ibafiez et al., 1995). Compar- ison with values observed in Majorero cheese, a goat’s milk cheese with 33.8% WSN (Fontecha et al., 1990), and in a semi-hard ewe’s milk cheese with 23.8% WSN (Fontecha et al., 1994), both by 90 days of ripening, indicated that Picante cheese exhibits a moderate ripen- ing extension index which, according to Furtado & Partridge (1988), is a measure of moderate rennet activity. In fact, one of the major agents responsible for proteolysis during cheese ripening is residual coagulant retained in the curd after manufacture (de Jong, 1977; Visser, 1977a,c; O’Keeffe et al., 1978). The general pathway of proteolysis involves a primary limited breakdown of paracasein by residual rennet (and/or plasmin) to polypeptides, which are then further degra- ded by the proteinase/peptidase systems of starter or non-starter bacteria to peptides and amino acids (Kleter, 1977; Visser, 1977b,c; Wilkinson et al., 1992). According to Guinee & Wilkinson (1992), changes in the rennet-to-casein ratio (due to changes in milk com- position) are one of the possible process events that give rise to variations in residual rennet activity. In our case, as a result of the different volumetric fractions of ovine and caprine milks used in the manufacture of experi- mental cheeses, the rennet-to-casein ratio varied between the different types of cheese. This ratio increased with increase in the caprine milk content (relative increases of 13% for the 25C cheese and 38% for the 1OOC cheese, using the OC cheese as a reference), and such an increase thus provides a possible justifica- tion for the observed differences in WSN.
Inspection of the ANOVA table reveals that ripening time and, to a lesser degree, milk composition were sig- nificant factors with regard to all nitrogen fractions. Scheffe’s F multiple comparison test revealed that the
changes in WSN between 0 and 25 days and between 40 and 83 days of ripening were not significantly different at the 5% level, which is consistent with the higher increments in all nitrogen fractions in the second half of the normal ripening period (see Table 3). The pattern throughout the ripening period may be attributed chiefly to such factors as salt content and starter/non- starter microflora. Inspection of the ANOVA table also indicates that the milk composition/ripening time inter- action was statistically significant and that only cheeses manufactured with 0% and 25% caprine milk did not exhibit significant differences in terms of total soluble nitrogen.
The NPN measured by both methods (see Table 3) followed similar patterns with respect to WSN evolu- tion, i.e. a slight increase in the beginning and a larger increase by the end of ripening. The maximum NPN values (87% and 92% of WSN in OC and lOOC, respec- tively) were attained by 180 days of ripening. According to Desmazeaud & Gripon (1977), the NPN fraction contains the free amino acids released from casein; in studies of six varieties of Blue cheese, FemPndez-Sal- guero ef al. (1989) claimed that, due to the high NPN content of the samples, most of the WSN fraction was accounted for by non-proteinaceous compounds. Based on values obtained for NPN (%TN), it was concluded that Picante cheese is characterized by a high ripening depth index which, according to Furtado & Partridge (1988), is an indication of a strong starter peptidase
activity. Freitas et al. (1996) reported that enterococci and lactobacilli were the predominant groups of lactic acid bacteria identified throughout ripening; conse- quently, it appears that the metabolic action of such lactic acid bacteria leads to release of amino acids and short peptides. Multiple comparison tests showed that, in terms of ripening time, there was no statistical differ- ence only between 0 and 9 days, whereas, in terms of milk composition, there was no statistical difference between OC and 25C, and between 5OC, 75C and 1OOC with respect to NPN (%TN).
In addition to studying the proteolysis in Picante cheese, the suitability of faster (and simpler) methods for estimating proteolysis as an alternative to the Kjel- dahl method was assessed. This goal was important because Picante, as a minor traditional cheese, has gen- erated little interest by researchers to date, and so the alternative methods have not yet been looked at. According to Gonzilez de Llano et al. (1993), methods which use reagents that are specific for free amino groups are faster and easier than the Kjeldahl method. Table 4 tabulates the results of linear regression analy- ses for each of the ripening indices on ripening time. The values of the coefficients of determination (r*) were in all cases above 0.83, which indicates that all methods con- sidered were, in general, suitable for estimating the degree of ripening. However, the linear model provided the poorest fit when the classical Kjeldahl method was used to quantify WSN. Apparently, proteolysis in
Table 3. Indices of proteolysis in the various experimental cheeses
Nitrogen fraction Type of cheese
Ripening time (days)
WSN” (%TN) NPNa (%TN) 12% TCA-Nb (mmoleq.Giy g- ’ cheese) 5% PTA-Nb (mmo4+Gly g-’ cheese) NH*-NC (mmo~.kU g-l cheese)
oc
25C 5oc 75c 1ooc oc 25C 5oc 75c 1ooc oc 25C 5oc 75c 1ooc oc 25C 5oc 75c 1ooc 2:; 5oc 75c 1OOc 0 9 25 40 55 83 110 140 180 10.9 11.3 11.8 12.1 10.5 13.8 11.4 12.4 11.6 12.1 12.9 12.1 13.4 12.5 12.8 15.7 14.6 14.2 13.7 13.3 13.8 14.0 17.1 17.0 12.9 12.3 10.2 14.3 11.9 12.3 3.03 3.65 4.78 5.80 6.48 9.15 2.91 3.42 3.77 5.64 7.28 9.96 4.37 4.62 4.72 6.50 7.54 10.8 4.30 4.05 4.83 5.94 7.53 11.7 4.23 3.11 4.93 4.62 7.97 10.7 3.25 17.3 22.7 36.3 56.7 87.3 3.15 2.14 14.7 15.3 22.1 47.0 11.4 18.1 21.0 40.9 51.5 83.1 3.49 12.9 19.4 39.9 60.5 80.5 5.82 11.2 13.7 20.5 41.2 59.7 2.38 4.93 14.7 17.1 21.0 31.4 4.29 10.2 11.5 20.6 21.9 26.5 4.24 6.31 8.29 15.2 28.2 32.4 1.73 8.77 15.8 22.1 30.5 40.0 1.40 5.44 2.65 13.2 20.9 32.3 3.08 4.40 7.09 11.1 13.5 25.3 2.92 3.66 6.01 7.51 12.9 17.8 4.93 6.05 6.77 9.14 14.1 19.4 4.82 5.54 6.46 10.0 15.0 23.4 4.15 4.58 4.77 14.0 21.2 21.1 15.6 24.0 25.2 16.3 22.9 25.9 19.6 26.3 27.2 22.0 26.8 27.1 17.1 25.8 28.9 12.9 18.2 21.8 12.0 18.2 22.5 15.9 22.8 23.4 15.5 23.0 25.0 16.7 22.7 26.6 111 176 202 84.5 114 195 113 162 197 119 154 203 112 159 202 40.6 80.3 113 40.0 80.6 103 51.9 93.4 109 63.2 88.4 119 59.0 91.7 125 31.7 48.3 69.05 31.7 47.5 67.3 29.9 54.0 72.6 32.6 52.4 94.5 46.1 90.3 102“Determined by the micro-Kjeldahl method.
bDetermined by the TNBS spectrophotometric method.
Picante is relatively slow during early stages of ripening and faster at later stages, suggesting a (tentative) quad- ratic relationship between the values of WSN (%TN) and time. As expected, higher correlation coefficients were achieved with a second-degree polynomial; how- ever, the quadratic term could not be justified from a statistical point of view at the 5% level of significance. Regression of the amino acid nitrogen contents (i.e. 5% PTA-N and NH*-N) obtained by the two spectophoto- metric methods was satisfactory (see Table 4). Accord- ing to Jarrett et al. (1982), although not perfect, measurements of PTA-N by reaction with TNBS prob- ably lead to the best method of quantification of total amino nitrogen; Doi et al. (1981) claimed that cad- mium-ninhydrin is much more reactive with the amino group of free amino acids than with the amino group of small peptides, and so is a suitable method for moni- toring terminal stages of proteolysis in cheese (Folk- ertsma & Fox, 1992).
The ripening indices of Picante cheese were also compared with the reference index (WSN/TNx 100) in order to determine whether any of them could be used to replace this classical index. Table 5 summarizes the parameter values for the linear regression equations. The 9 values were higher than 0.84 in all cases; these
results agree with those reported by Gonzalez de Llano
et al. (1993). The mean values and standard deviation of r* for the 12% TCA-N, 5% PTA-N, and NH*-N were
0.915kO.020, 0.94OkO.017 and 0.918kO.044, respec- tively. These values indicate again that the spectopho- tometric methods using either TNBS or cadmium- ninhydrin are good substitutes for the Kjeldahl method as measures of the ripening indices. Furthermore, results pertaining to several other varieties of cheese indicate that methods which evaluate free amino groups generate more information about the extension of pro- teolysis in cheese than methods that assess plain total nitrogen (Ardii & Meisel, 1991).
Casein degradation
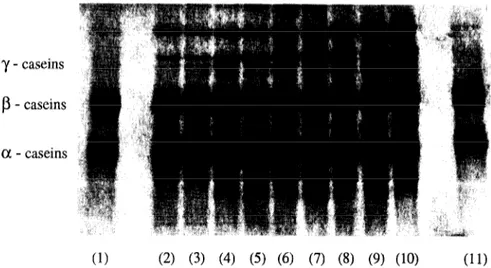
The electrophoretograms for caseins in the OC and 1OOC cheeses throughout ripening are depicted in Figs 1 and 2, respectively. The changes in peak areas of the as-, /?- and y-caseins throughout ripening for the different experimental cheeses are depicted in Fig. 3.
The (Y,- and /I-casein contents decreased with ripening time with respect to those at 0 days as a consequence of the action of residual rennet (as explained before), combined with the action of hydrolytic enzymes
Table 4. Parameter values, and corresponding standard deviation (SD), obtained by linear regression of proteolysis indices (NF) on ripening time (tR), and associated correlation coefficient (9)
Nitrogen fraction Type of cheese NF=a+btR
a*SD b&SD
r;?
WSN” (%TN)
NPN” (%TN)
12% TCA-Nb (mmol,.o,, g-’ cheese)
5% PTA-Nb (mmol,,.cl, g-’ cheese)
NH2-NC (mmol,,k, g-’ cheese)
oc
9.027 zk 0.842 25c 9.569 f 0.832 5oc 11.225 f 0.796 75c 12.085 f 0.559 1ooc 9.386& 1.140 oc 1.887zkO.414 25C 1.617zk0.398 sot 2.523 +I 0.635 7x 2.116zkO.606 1ooc 1.425 * 0.642 oc -2.538 k 3.630 25C - 16.970 f 6.487 5oc 0.872k 3.012 75c -2.453 f 2.097 1ooc -11.929*5.193 oc -5.204 k4.000 25C -2.247 * 3.795 5oc -4.826 f 3.305 75c - 1.882 f 2.079 IOOC - 10.555 f 3.596 oc -1.864zk 1.570 25C -3.015’*22.038 5oc -2.589 f 2.464 75c -5.1791t3.660 1ooc -7.206h4.171 0.084 f 0.009 0.841 0.080 f 0.009 0.831 0.086 f 0.009 0.861 0.087 f 0.005 0.928 0.095zk0.012 0.787 0.107 * 0.005 0.973 0.111*0.004 0.976 0.121*0.007 0.947 0.129*0.007 0.960 0.138*0.007 0.961 1.142f0.039 0.981 1.013 *0.070 0.928 1.073 f 0.033 0.985 1.1131kO.023 0.993 1.1401tO.056 0.960 0.580 f 0.043 0.918 0.528 zk 0.041 0.911 0.612~0.036 0.948 0.633 f 0.023 0.980 0.696 f 0.039 0.952 0.359*0.017 0.965 0.352 zt 0.022 0.940 0.374 f 0.027 0.924 0.454 f 0.040 0.891 0.584 f 0.045 0.911“Determined by the micro-Kjeldahl method.
bDetermined by the TNBS spectrophotometric method.
released by microorganisms present in cheese (Fontecha
et al., 1994). Identification of bands resolved by urea-
PAGE electrophoresis of Picante cheese samples posed, however, several problems due to the mixture of ovine and caprine milks in their composition. According to Jaubert & Martin (1992), the caseins in ruminant milks, which account for 83% (ovine) to 77% (caprine) of the overall protein, consist of four proteins (asi-, as2-, /I- and K;-caseins). In addition to total casein content, the relative proportions of each casein are also characteris- tic of the species: the asI-, as2-, /I- and q-caseins exist in ovine milk in the approximate proportions 2:2:5:1, respectively, whereas in caprine milk their proportions are 1:2:5:2, respectively (Assenat, 1985; Remeuf & Lenoir, 1986). In Picante cheeses manufactured either with ovine milk or with caprine milk, two bands could be distinguished in the electrophoretograms (see Figs 1 and 2) in the /Lcasein electrophoretic region (which might thus correspond to F2- and pi-caseins). In terms of bands in the electrophoretic region of a,-caseins, three bands could be clearly distinguished in the OC cheese (corresponding probably to as3-, a,2- and a,~-caseins), whereas in the 1OOC cheese only two bands could be clearly perceived (corresponding probably to ay,2- and a,i-caseins). In electrophoretograms of cheeses manufactured from mixtures of both milks (not shown), three bands corresponding to a,-caseins were observed in 25C, whereas only two bands appeared in 50C and 75C cheeses.
High molecular weight peptides (with mobilities similar to y-caseins) were present in all types of cheese. The y-caseins, which are formed on hydrolysis of ,9-caseins by indigenous plasmin (Noomen, 1978; Richardson & Pearce, 1981; Grufferty & Fox, 1988a,b), increased in concentration in all experimental cheeses during ripening, and up to four bands could be identi- fied in their typical electrophoretic region.
The extent of breakdown of a,- and Bcaseins, expressed as relative percentage of peak areas at 0 days, varied with the composition of the milk used. Higher resistance of /?-caseins to enzymatic hydrolysis com- pared with a,-caseins was observed among the various cheeses. These observations are consistent with those reported by Marcos et al. (1976) pertaining to several different types of cheese manufactured with caprine, ovine and bovine milks and coagulated with animal and plant rennets. The extent of degradation of fi-caseins by 180 days were 18.8, 26.4, 40.2, 55.6 and 36.5% for the OC, 25C, 5OC, 75C and 1OOC cheeses, respectively. In terms of a,-caseins, the extents of degradation were 35.9, 40.2, 81.8, 93.0 and 68.7% for the OC, 25C, 5OC, 75C and 1OOC cheeses, respectively. Inspection of Fig. 3 suggests unexpected variability in terms of peak areas of caseins, especially a,-caseins in the 75C cheese. Appli- cations of different amounts of NaCl (see Table 2) to the fresh cheeses, which thus lead to different degrees of protein loss during syneresis of whey and different intrinsic rates of enzymatic breakdown of proteins by
Table 5. Parameter values, and corresponding standard deviation (SD), obtained by linear regression of the proteolysis indices (NF) on tbe reference index (WSN/TNx MO), and associated correlation coefficient (3)
Nitrogen fraction Type of cheese NF = a + b (WSN/TN x 100)
U&SD b*SD r2 NPN” (%TN) OC 25c 5oc 75c 1OOc OC 12% TCA-Nb (mmol_,Gly g- ’ cheese) 25c
5Oc 75c IOOC
5% PTA-Nb (mmoLq.oi, g-’ cheese)
oc
25c 5OC NHrNc (mmoleq.Leu g-l cheese) 7x 1OOC oc 25c 5oc 75c 100 c -7.697 5 1.200 -9.068 f 1.556 -11.399k 1.432 -14.930+ 1.134 -8.508 f 2.075 -100.996* 15.217 -119.592% 14.076 -116.154* 15.468 -142.762k13.611 -95.945 i 15.464 -59.283*7.158 -58.787* 5.135 -76.013k6.663 -82.203 * 8.065 -63.865 f 8.245 -33.433 f 4.675 -39.263 f 3.914 -46.492h4.714 -62.062 zk 10.031 -55.146*5.532 1.147 l 0.075 0.936 1.216ztO.097 0.908 1.298 f 0.079 0.944 1.433 f 0.060 0.973 1.223*0.120 0.867 11.792 f 0.954 0.908 11.441 f 0.873 0.915 11.147*0.851 0.915 11.998*0.714 0.946 10.216iO.890 0.891 6.352 f 0.449 0.926 6.163kO.319 0.959 6.611 f 0.366 0.953 6.851 f 0.423 0.942 6.360 f 0.475 0.918 3.803 zk 0.293 0.913 4.014 f 0.243 0.945 4.065 f 0.259 0.939 4.874 zt 0.526 0.843 5.525hO.319 0.949“Determined by the micro-Kjeldahl method.
bDetermined by the TNBS spectrophotometric method.
y - caseins
P- caseins
a - caseins
(2) (3) (4) (5) (6) (7) (8) (9) (10) (11)
Fig. 1. Electrophoretogram for the casein fraction obtained by urea-PAGE in OC cheeses (100% ovine milk) at 0 (2), 9 (3), 25 (4), 40 (5), 55 (6), 83 (7), 110 (8), 140 (9) and 180 days (10) of ripening, and for the ovine casein standard (1 and 11).
residual rennet (Guinee & Fox, 1993), are likely responsible (at least partially) for the aforementioned variability of casein breakdown.
The electrophoretically visible degradation products from cr,-caseins (i.e. pre-a,-caseins) yielded thinner bands than those from fi-caseins (i.e. y-caseins). According to Marcos et al. (1978), this is probably due to their greater susceptibility to further hydrolysis or to differences in their dye-binding capacities. Inspec- tion of Figs 1 and 2 shows that the intensity of the bands corresponding to y-caseins increased, whereas that of the bands associated with the pre-a,-caseins decreased, throughout ripening. The effect of milk composition was also reflected in the presence of y-caseins throughout ripening: higher content in caprine milk led to higher increases in their concentrations. This observation is consistent with degradation data relating to /3-casein (with the exception of the 1OOC cheese).
In the electrophoretograms of the different types of cheese, one (or two) bands located between the electro- phoretic region corresponding to j?- and cr,-caseins
could be detected. These bands are especially visible in the last three sampling points, and are possibly degra- dation products of B-casein. Mora & Marcos (1981) reported a similar band in an ovine cheese and claimed that it corresponded to products of degradation of B- casein.
Sensorial analysis
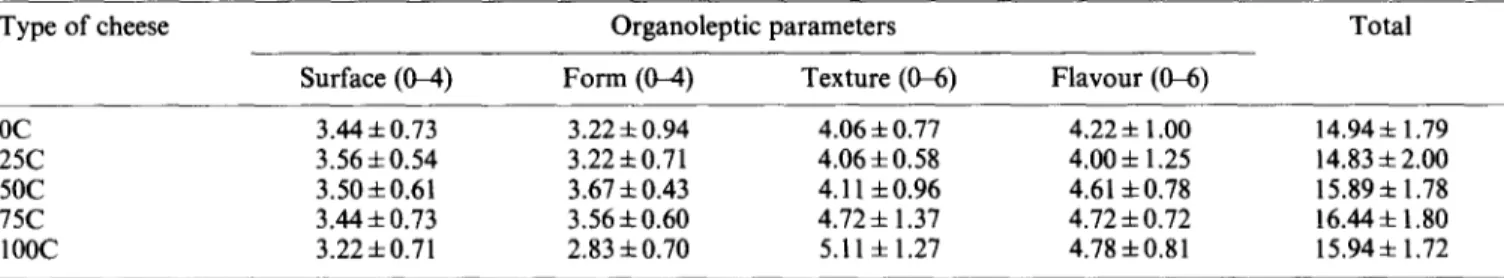
The results of organoleptic assessment are summarized in Table 6. The appearance parameters (surface and form) of cheeses were rated as quite satisfactory by the taste panel (all scores were above 3 in a S4 scale). Texture and flavour scores were also considered quite acceptable by the taste panels (the mean values by the end of ripening were above 4 in a O-6 scale). The effect of composition of the milk mixture was not statistically significant in terms of the organoleptic parameters ana- lysed; however, both 75C and 1OOC cheeses obtained the highest scores in terms of texture and flavour (see Table 6).
y - caseins P- caseins a - caseins
(1) (2) (3) (4) (5) (6) (7) (8) (9) (10)
Fig. 2. Electrophoretogram for the casein fraction obtained by urea-PAGE in IOOC cheeses (100% caprine milk) at 0 (2), 9 (3), 25 (4),40 (51, 55 (6h 83 (71, 110 (8h 140 (91, and 180 days (10) of ripening, and for the caprine casein standard (1).
-q* l l * l l l l or I.l~l.~.Ils.ljl,ll. 0 50 100 150 200 Ripening time (d) :** l l * l OrI’.““““““““’ 0 50 100 150 200 Ripening time (d) 3 C : 0 :0= O $ 2, Qo q n 0 z 0 La n 0 ym Lz 1 1 I l l * l l :** l n o-“““““l”,‘l”,‘- 0 50 100 150 200 Ripening time (d)
ot;““~““‘,
I”/“‘*1
0 50 100 150 200 Ripening time (d) dl I > I, * < > I 50 100 150 Ripening time (d)1
8
200Fig. 3. Evolution of peak areas of y- (+), /I- (0) an d cY,-caseins (m) throughout the ripening period for: (a) OC cheese. Standard error of the mean (SEM) for y-casein is 0.053, SEM for ,!?-casein is 0.223, and SEM for qcasein is 0.268; (b) 25C cheese. SEM for y-casein is 0.072, SEM for B-casein is 0.085, and SEM for cr,-casein is 0.125; 50C cheese. SEM for y-casein is 0.073, SEM for B-casein is 0.271, and SEM for cr,-casein is 0.240; (d) 75C cheese. SEM for y-casein is 0.066, SEM for /3-casein is 0.161, and SEM for a,-casein is 0.154; (e) 1OOC cheese. SEM for y-casein is 0.130, SEM for ,%casein is 0.409, and SEM for cr,-casein is 0.258.
Table 6. Mean values (from uiue panellists), and corresponding standard deviation, of orgauoleptic evaluation of Picante cheese manufactured with different compositions of ovine and caprine milks by 180 days of ripening
Type of cheese Organoleptic parameters Total
Surface (@I) Form (WI) Texture (&6) Flavour (fL6)
oc 3.44zto.73 3.22 f 0.94 4.06 f 0.77 4.22+ 1.00 14.94% 1.79
25C 3.56 ho.54 3.22 f0.71 4.06 f 0.58 4.00 f 1.25 14.83 f 2.00
5oc 3.50+0.61 3.67 f 0.43 4.11 ho.96 4.61 f 0.78 15.89& 1.78
75c 3.44 f 0.73 3.56f0.60 4.72 +I 1.37 4.72 & 0.72 16.44* 1.80
ACKNOWLEDGEMENTS
The authors are grateful to the members of the technical board of the Governmental Directorate of Agriculture of the Region of Beira Interior (DRABI, Portugal) for their cooperation in supervising the local manufacture of cheeses according to the experimental design selected and in transporting such cheeses to the ESB premises. The authors are also grateful to the members of OVI- BEIRA for their cooperation in performance of the sensorial analysis. Financial support for author A. C. F. was provided by a Ph.D. Fellowship, BD/211 l/92-IF, within the Programme for the Creation of National Infrastructures in Applied Science and Investigation (CIENCIA) administered by the National Board for Scientific and Technological Investigation (JNICT, Portugal). Partial financial support for the research expenses was provided by project ‘MAQUETTE: Improvement of traditional cheeses and their technology’, administered by the Innovation Agency (AI, Portugal) and by project ‘PROTOLACTIS: Production, via opti- mized technologies, of traditional dairy products from certified sources’, administered by PAMAF-IED (INIA, Portugal). The careful and critical reading of the origi- nal manuscript by Prof. Patrick Fox, c/o University College Cork (Ireland), is also gratefully acknowledged.
REFERENCES
Abo El-Ella, W. M., Abdel Baky, A. A., Aly, M. E. & Fox, P. F. (1988). Effect of ripening temperature on proteolysis and lipolysis in outer and inner regions of Ras-type cheese made by various salting methods. Food Chem., 28, l-16.
Adler-Nissen, J. (1979). Determination of the degree of hydrolysis of food protein hydrolysates by trinitrobenzene- sulfonic acid. J. Agric. Food Chem., 6, 12561262.
Alichanidis, E., Anifantakis, E., Polychroniadou, A. & Nanou, M. (1984). Suitability of some microbial coagulants for Feta cheese manufacture. J. Dairy Res., 51, 141-147. Andrews, A. T. (1983). Proteinases in normal bovine milk and
their action on caseins. J. Dairy Res., 50, 45-55.
Anonymous (1975). Fromages. Determination de la teneur en mat&e grasse. IS0 3433.
AOAC (1990). Acidity of cheese: Titrimetric method (970.124). In Oficial Methods of Analysis, vol. 2 - Food composition: additives and natural contaminants, pp. 842- 843.
Ard8, Y. & Me&l, H. (1991). Methods for direct measure- ment of peptide bond cleavage in cheese. Int. Dairy Fed. Bull., 261, l&13.
Assenat, L. (1985). Lait de brebis. Composition et proprittes. In Luits et Produits Luitiers, Vol. 1, ed. F. M. Luquet. Technique et Documentation Lavoisier, Paris.
Blakesley, R. W. & Boezi, J. A. (1977). A new staining tech- nique for proteolysis in polyacrylamide gels using Coomas- sie Brilliant Blue G-250. Anal. Biochem., 82, 58&581. Cruz, A. A. (1945). Lacticinios da Beira Baixa: queijo a ovel-
heira e queijo a cabreira. Bol. Pecu. Lisboa, 12, 55-100. de Jong, L. (1977). Protein breakdown in soft cheese and its
relation to consistency. 2. The influence of the rennet con- centration. Neth. Milk Dairy J., 31, 314-327.
Desmazeaud, M. J. & Gripon, J. C. (1977). General mechan- ism of protein breakdown during cheese ripening. Milch- wissenschaft, 32, 73 l-734.
Doi, E., Shibata, D. & Matoba, T. (1981). Modified colori- metric ninhydrin methods for peptidase assay. Anal. Bio- them., 118, 173-184.
Farkye, N. Y. & Fox, P. F. (1990). Objective indices of cheese ripening. Trends Food Sci. Technol., 1, 3740.
Farkye, N. Y., Kiely, L. Y., Allshouse, R. D. & Kindstedt, P. S. (1991). Proteolysis in Mozarella cheese during refriger- ated storage. J. Dairy Sci., 74, 14331448.
Fernandez-Salguero, J., Marcos, A., Alcala, M. & Esteban, M. A. (1989). Proteolysis of Cabrales cheese and other European blue vein cheese varieties. J. Dairy Res., 56, 141- 145.
Folkertsma, B. & Fox, P. F. (1992). Use of Cd-ninhydrin reagent to assess proteolysis in cheese during ripening. J. Dairy Res., 59, 217-224.
Fontecha, J., Pelbez, C., Juirez, M., Requena, T. & Gbmez, C. (1990). Biochemical and microbiological characteristics of artisanal hard goat’s cheese. J. Dairy Sci., 73, 1150-l 157. Fontecha, J., Pelaez, C. & Juirez, M. (1994). Biochemical
characteristics of a semi-hard ewe’s milk cheese. 2. Lebensm. Unters. Forsch., 198, 24-28.
Fox, P. F. (1989). Proteolysis during cheese manufacture and ripening. J. Dairy Sci., 72, 1379-1400.
Freitas, A. C. & Malcata, F. X. (1996). Influence of milk type, coagulant, salting procedure and ripening time on the final characteristics of Picante cheese. Int. Dairy J., 6, 1099-
1116.
Freitas, A. C., Sousa, M. & Malcata, F. X. (1995). Effect of ripening time and the combination of ewe and goat milk on the microflora of Picante cheese. Ital. J. Food Sci., 7,361-377. Freitas, A. C., Pais, C., Malcata, F. X. & Hogg, T. A. (1996).
Microbiological characterization of Picante da Beira Baixa cheese. J. Food Protect., 59, 155-160.
Furtado, M. M. & Partridge, J. A. (1988). Characterization of nitrogen fractions during ripening of a soft cheese made from ultrafiltration retentates. J. Dairy Sci., 71, 2877-2884. Gonzalez de Llano, D., Ramos, R. & Martin-Alvarez, P. J.
(1993). Comparative study of different methods for evalu- ating proteolysis in Blue cheese. Z. Lebensm. Unters. Forsch., l%, 29-31.
Grufferty, M. B. & Fox, P. F. (1988~). Milk alkaline proteinase. J. Dairy Res., 55, 609630.
Grufferty, M. B. & Fox, P. F. (19886). Factors affecting the release of plasmin activity from casein micelles. N. Z. J. Dairy Sci. Technol., 23, 153-163.
Guinee T. P. & Fox, P. F. (1993). Salt in cheese: physical, chemical and biological aspects. In Cheese: Chemistry, Physics and Microbiology, ed. P. F. Fox. Chapman and Hall, London, pp. 257-302.
Guinee, T. P. & Wilkinson, M. G. (1992). Rennet coagulation and coagulants in cheese manufacture. J. Sot. Dairy Tech- nol., 45, 94-104.
Ibariez, F. C., Torres, M. I., Ordonez, A. I. & Barcina, Y. (1995). Effect of composition and ripening on casein break- down in Idiazabal cheese. Chem. Mikrobiol. Technol. Lebensm., 17, 3744.
Jarrett, W. D., Aston, J. W. & Dulley, J. R. (1982). A simple method for estimating free amino acids in Cheddar cheese. Aust. J. Dairy Technol., 37, 5558.
Jaubert, A. & Martin, P. (1992). Reverse-phase HPLC analy- sis of goat caseins. Identification of (Y,, and (Y,~ genetic var- iants. Lait, 72, 235-247.
Kleter, G. (1977). The ripening of Gouda cheese made under strictly asseptic conditions. II. The comparisons of the activity of different starters and the influence of certain lac- tobacilli strains. Neth. Milk Dairy J., 31, 177-187.
Kosikowski, F. V. (1982). Cheese and Fermented Milk Foods. Edwards Brothers, New York, pp. 560-597.
Kuchroo, C. N. & Fox, P. F. (1982). Soluble nitrogen in Cheddar cheese: comparison of extraction procedures. Milchwissenschaft, 37, 331-335.
Mallatou, H., Pappas, C. P. & Voutsina, L. P. (1994). Manu- facture of Feta cheese from sheep’s milk, goat’s milk or mixtures of these milks. ht. Dairy J., 4, 641-664.
Marcos, A., Esteban, M. A., Leon, F. & Femlndez-Salguero, J. (1978). Electrophoretic patterns of European cheeses: comparison and quantitation. J. Dairy Sci., 62, 892-900. Marcos, A., Esteban, M. A. & Femindez-Salguero, J. (1976).
Influence of some chemical and physical factors on the pro- teolysis of cheese caseins. Arch. Zootec., 25, 73-86.
Mora, T. & Marcos, A. (1981). Proteolysis in Manchego cheese: casein breakdown and their insoluble degradation products. Arch. Zootec., 30, 139155.
Noomen, A. (1978). Activity of proteolytic enzymes in simu- lated soft cheeses (Meschanger type) 1. Activity of milk protease. Neth. Milk Dairy J., 32, 26-49.
O’Keeffe, A. M., Fox, P. F. & Daly, C. (1978). Proteolysis in Cheddar cheese: role of coagulant and starter bacteria. J. Dairy Res., 45, 465-477.
Pappas, C. P., Kondyli, E., Voutsinas, L. & Mallatou, H. (1992). Final Report of Research Project on Moisture con- trol in Feta cheese. Ministry of Industry, Energy and Tech- nology, Athens.
Pappas, C. P., Kondyli, E., Voutsinas, L. P. & Mallatou, H. (1994). Effect of standardization of ewe’s milk for casein/fat ratio on the composition, organoleptic and rheological properties of Feta cheese. Int. Dairy J., 4, 763-778.
Remeuf, F. & Lenoir, J. (1986). Relationship between the physico-chemical characteristics of goat’s milk and its rennetability. Int. Dairy Fed, Bull., 202, 68-72.
Richardson, G. H. (Ed.) (1985). Standard Methods for the Examination of Dairy Products. American Public Health Association, Washington, DC.
Richardson, B. C. & Pearce, K. N. (1981). The determination of plasmin in dairy products. N. Z. J. Dairy Sci. Technol., 16,209-220.
Schlesser, J. E., Schmidt, S. J. & Speckman, R. J. (1992). Characterization of chemical and physical changes in Camembert cheese during ripening. J. Dairy Sci., 75, 1753- 1760.
Schroeder, C. L., Bodyfelt, F. W., Wyatt, C. J. & McDaniel, M. R. (1988). Reduction of sodium chloride in Cheddar cheese: effect on sensory, microbiological, and chemical properties. J. Dairy Sci., 71, 2010-2020.
Simos, E., Voutsinas, L. P. & Pappas, C. P. (1991). Composi- tion of milk native Greek goats in the region of Metsovo. Small Ruminant Res., 4, 47-60.
Visser, F. M. W. (1977a). Contribution of enzymes from rennet, starter bacteria and milk to proteolysis and flavour development in Gouda cheese. 1. Description of cheese and asseptic cheesemaking techniques. Neth. Milk Dairy J., 31, 12&133.
Visser, F. M. W. (1977b). Contribution of enzymes from rennet, starter bacteria and milk to proteolysis and flavour development in Gouda cheese. 2. Development of bitterness and cheese flavour. Neth. Milk Dairy J., 31, 188- 209.
Visser, F. M. W. (1977~). Contribution of enzymes from rennet, starter bacteria and milk to proteolysis and flavour development in Gouda cheese. 3. Protein breakdown: analysis of the soluble nitrogen and amino acid nitrogen fraction. Neth. Milk Dairy J., 31, 210-239.
Wilkinson, M. G., Guinee, T. P., O’Callaghan, D. M. & Fox, P. F. (1992). Effects of commercial enzymes on proteolysis and ripening in Cheddar cheese. bit, 72, 449 459.
Zorrilla, S. E. & Rubiolo, A. C. (1991). Average NaCl concentration in cheese for different volume ratios of brine and solid during salting. J. Food Sci., 56, 1548- 1551.