Júri:
Presidente: Professor Doutor Hugo Manuel Brito Águas
Arguentes: Professor Doutor Vítor Manuel Grade Tavares
Vogais: Doutor Jonas Deuermeier
Orientadora: Doutora Asal Kiazadeh, Investigadora Doutorada, Faculdade de Ciência e Tecnologias da Universidade Nova de Lisboa
Co-orientador: Doutor Jonas Deuermeier, Investigador Doutorado, Faculdade de Ciência e Tecnologias da Universidade Nova de Lisboa
Dissertação para obtenção do Grau de Mestre em Engenharia de Micro e Nanotecnologias
Dissertação para obtenção do Grau de Mestre em
[Engenharia Informática]
Memristor based on amorphous zinc-tin oxide
Schottky diodes
[Título da Tese]
Licenciado em Ciências de Engenharia de Micro e Nanotecnologias
[Habilitações Académicas] [Habilitações Académicas] [Habilitações Académicas] [Habilitações Académicas] [Habilitações Académicas] [Habilitações Académicas] [Habilitações Académicas]
Nuno Miguel de Almeida Casa Branca
[Nome completo do autor]
[Nome completo do autor]
[Nome completo do autor]
[Nome completo do autor]
[Nome completo do autor]
[Nome completo do autor]
[Nome completo do autor]
iii
Memristor based on amorphous zinc-tin oxide
Schottky diodes
Copyright © Nuno Miguel de Almeida Casa Branca
Faculdade de Ciências e Tecnologia
Universidade Nova de Lisboa
A Faculdade de Ciências e Tecnologia e a Universidade Nova de Lisboa têm o direito,
perpétuo e sem limites geográficos, de arquivar e publicar esta dissertação através de
exemplares impressos reproduzidos em papel ou de forma digital, ou por qualquer outro meio
conhecido ou que venha a ser inventado, e de a divulgar através de repositórios científicos e
de admitir a sua cópia e distribuição com objectivos educacionais ou de investigação, não
comerciais, desde que seja dado crédito ao autor e editor.
v
Acknowledgements
First and foremost, I’d like to thank the Faculty of Science and Technology of Nova University of Lisbon for all the excellent teaching and support throughout this journey.
Secondly, I’d like to thank all the teachers and investigators from the Center of Investigation in Materials (CENIMAT) and from Department of Science and Materials (DCM) for all the opportunities that they constantly provide, with special thanks to prof. Rodrigo Martins and prof. Elvira Fortunato for their most valuable work in bringing science together from all around the world.
Thirdly, I’d also like to thank my supervisors Asal Kiazadeh and Jonas Deuermeier for their availability and attention. Also, to the memory investigation team: Jorge Martins, Ana Ruvísco, Emanuel Carlos and Daniela Salgueiro. This work would not have been done if it wasn’t for their support.
I am also grateful to all my colleagues throughout this course that accompanied me along these years in projects, long nights of study, and in general were just great companionship.
Lastly, I need to thank my parents and my sister for their great patience toward my stressful moments. I also cannot forget to mention my cat Pinóquio, a cat that barely ever bites its owner.
vii
Abstract
This work reports the fabrication and characterization of metal-insulator-metal (MIM) structures based on Schottky junction between platinum and zinc-tin oxide (ZTO) for memristor application. The devices were produced exclusively by physical vapor deposition methods at room temperature (RT). Before evaluating memory performance, these devices were first characterized in their pristine state as diodes. It was studied how the addition of an intermediate step of oxygen plasma treatment on the platinum surface, as well as the influence of oxide film thickness impact device performance.
The produced memristors exhibited a very distinct operation dynamic on the reset process depending on the voltage signal applied in the electroforming process. When the voltage coincides with the forward direction of the diode the reset process runs in gradual analogic way; otherwise the reset process runs in a threshold manner, like the set process in both cases. Oxygen plasma treatment tends to improve the analog mechanism in terms of operation window, regardless of thickness. However, the stability of resistive RAM operation is improved with thicker devices.
ix
Resumo
Este trabalho relata a fabricação e caraterização de estruturas metal-isolante-metal (MIM) construídas com base na junção Schottky entre a platina e o óxido de zinco-estanho (ZTO) para aplicações em memristores. Os dispositivos foram produzidos exclusivamente a partir de processos de deposição física à temperatura ambiente (RT). Antes de avaliar a performance das memórias, os dispositivos foram primeiro caracterizados no seu estado pristine como díodos. Foram estudados como a adição de uma etapa intermédia de tratamento de plasma de oxigénio na superfície da platina, bem como a influência da espessura do filme isolante teêm ao avaliar a performance.
Os memristores produzidos apresentam uma dinâmica de funcionamento bastante diferente no processo de reset consoante o sinal aplicado no processo de electroforming. Quando o sinal coincide com o sentido de polarização direta do díodo o reset decorre de forma gradual e analógica; caso contrário o reset decorre de forma threshould semelhante ao processo de set em ambos os casos. O tratamento de plasma de oxigénio tende a aumentar o desempenho do mecanismo analógico em relação à janela, independentemente da espessura. Contudo, a estabilidade das memórias RAM resistivas é melhorada com espessuras maiores.
xi
List of Abbreviations
1S1R – One-selector one-resistor AE – Active Electrode
AFM – Atomic force microscopy
AOS – Amorphous oxide semiconductor CC – Current compliance
CF – Conductive filament
CMOS – Complementary metal-oxide-semiconductor DRAM – Dynamic random-access memory
ECM – Electrochemical EF – Electroforming
FeRAM – Ferroelectric random-access memory HRS – High resistive state
IGZO – Indium-gallium-zinc-oxide LRS – Low resistive state
MIM – Metal-insulator-metal MLC – Multilevel cell
MRAM – Magnetic random-access memory NVM – Non-volatile memory
PRAM – Phase-change random access memory RRAM – Resistive random-access memory RE – Rectifying element
RT – Room temperature SCM – Storage-class memory SMU – Source measure unit SED – Stretched exponential decay STD – Short-Term Depression STF – Short-Term Facilitation
SRAM – Static random-access memory STP – Short-term plasticity
TCM – Thermo-chemical mechanism VO – Oxygen Vacancy
VCM – Valence Change Mechanism
VRESET – Reset Voltage
VSET – Set voltage
XPS – X-Ray photoelectron spectroscopy XRD – X-Ray Diffraction
xiii
Table of contents
1. Motivation and objectives ... 1
2. Introduction ... 3
2.1 Memristor ... 3
2.1.1 HP Lab’s mechanisms ... 3
2.1.2 Oxygen exchange at metal-oxide active electrode interface ... 4
2.2 Digital Memory ... 4
2.2.1 Resistive random access memory ... 5
2.2.1.1 RRAM classification ... 5
2.3 Synaptic Memory ... 7
2.4 State of the art of zinc-tin-oxide as a RRAM switching layer ... 7
3. Materials and Methods ... 9
3.1 Device fabrication ... 9
3.1.1 Oxygen treatment ... 9
3.2 Device characterization ... 10
3.3 Electrical characterization ... 10
4. Results and discussion ... 11
4.1 Material characteristics ... 11
4.1.1 XRD ... 11
4.1.2 AFM ... 11
4.1.3 XPS ... 13
4.2 Electrical characteristics ... 16
4.2.1 Oxygen plasma treatment influence in pristine state ... 16
4.2.2 Electroforming ... 17
4.2.3 Bipolar resistive switching properties ... 18
4.2.3.1 Temperature dependency of LRS and HRS ... 21
4.2.4 Unipolar resistive switching properties ... 22
4.2.5 Thickness impact on RRAM ... 23
4.2.6 Forward set ... 24
4.2.6.1 Area dependency of the analog resistive switching ... 26
5. Conclusions and Future Perspectives ... 31 5.1 Conclusions ... 31 5.2 Future Perspectives ... 32 6. References ... 33 7. Annex ... 37 7.1 Annex A ... 37 7.2 Annex B ... 38 7.3 Annex C ... 38 7.4 Annex D ... 40 7.5 Annex E ... 40
xv
List of Figures
Figure 2.1 Band diagram representation of switching between LRS and HRS according to the direction of the VO migration. Oxygen anions move in the opposite direction of VO. Adapted from reference [12].
... 3 Figure 2.2 a) Schematics of the oxygen vacancy profile in reset and set mechanisms. b) Modified model including ion ionic exchange switching mode. c) Oxygen exchange reaction taking place in proximity to the switching interface during set and reset. Adapted from reference [13]. ... 4 Figure 2.3 RRAM classification according to primary mechanism, polarity and material impact. [2] ... 5 Figure 2.4 (a) Pristine state. (b) Low resistive state after an initial forming process. (c) High resistive state after an applied VRESET. Arrows between (b) and (c) portray a valence change mechanism (VCM)
system in which VO filament formation and rupture based on voltage bias applied after a forming
process. Adapted from reference [15]. ... 6 Figure 3.1 Device structure layer by layer, devided into each deposition step. ... 9 Figure 4.1 Diffractogram of ZTO with 77 nm (black) and 158 nm (red) thicknesses. ... 11 Figure 4.2 AFM measurements of both Pt/ZTO/TiAu (left) and ITO/ZTO/Pt (right). (a) and (b) Top electrodes. (c) and (d) ZTO layers. (e) and (f) Bottom electrodes. All dimensions are of 5 × 5 μm2. ... 12
Figure 4.3 Hillocks represented in a 3D image of platinum bottom electrode. ... 13 Figure 4.4 X-ray photoelectron spectra obtained from the ZTO surface: (a) Full spectrum. (b) Valence band minimum. (c) Sn 3d5/2 (d) Zn 2p3/2. (e) O 1s. (f) C 1s. ... 14
Figure 4.5 Spectrum of Pt 4f region of oxygen plasma treated platinum surface (black) and untreated (red). Green circle refers to the zone where different platinum oxidation states overlap each other. ... 16 Figure 4.6 I-V characteristic comparison of pristine state without (black) and with (red) oxygen
treatment in (a) logarithmic scale and (b) linear scale. ... 16 Figure 4.7 Examples of the resistive switching current-voltage characteristic. (a) Unipolar switching on both polarities, also considered non-polar. The resistive switching (RS) mechanism is certainly filamentary (b) Bipolar switching with negative set and positive reset polarities. The RS mechanism can be both filamentary or interfacial. Adapted from reference [9]. ... 17 Figure 4.8 Bipolar resistive switching of a 79 nm thick untreated device. (a) Electroforming, first set and different reset process at both polarities. (b) Endurance for 50 successful consecutive cycles. (c) Cumulative probability of ON and OF current levels with an inset of VSET and VRESET distribution.
(d) Retention for 100,000 s at a reding voltage of 0.1 V. ... 18 Figure 4.9 Endurance continuation of bipolar switching represented in Figure 4.8. (a) Endurance tests until failure at cycle number 74. (b) Cumulative probability of ON and OF current levels with an inset of VSET and VRESET distributions, both for the 74 successful cycles. ... 19
Figure 4.10 Lowest power consumption achieved of a 79 nm untreated device. (a) Electroforming and first three cycles with decreasing CC of 10 mA to 0.5 mA (b) Endurance for 50 cycles. (c) Window distribution of cycling from (c). (d) VSET and VRESET distribution of successful switching cycles. ... 20
Figure 4.11 Oxygen treated device with 79 nm thickness. (a) Electroforming and first set-reset cycles. (b) Cycling endurance for 31 cycles. (c) Window endurance of cycles, showing a failure from cycle number 19 and beyond. (d) Retention time for 100,000 s at a reading voltage on 0.1 V. ... 21
Figure 4.12 Temperature dependency of (a) HRS and (b) LRS. ... 21 Figure 4.13 (a) Arrhenius plot for HRS and (b) TCR plot for LRS. ... 22 Figure 4.14 Unipolar resistive switching of an oxygen untreated device with 79 nm thickness.
(a) Electroforming. (b) Endurance for 50 cycles. (c) Window distribution of endurance cycles. (d) VSET
and VRESET distribution of successful switching cycles. ... 23
Figure 4.15 Change in mechanism in an oxygen untreated device with 79 nm thickness.
(a) Electroforming in the reverse polarity. (b) Endurance with a shift in mechanism from a set in the reverse polarity to a set in the forward direction. ... 24 Figure 4.16 Device without oxygen treatment and with twice the thickness (158 nm) in ZTO switching layer. (a) Electroforming in the reverse polarity. (b) Endurance for 100 switching cycles with 76 % yield. ... 24 Figure 4.17 Forward electroformed large area untreated device. (a) Electroforming. (b) Set and reset at different incremental voltages. (c) Endurance for 50 cycles. (d) Gradual reset from (b) in linear scale. ... 25 Figure 4.18 Comparison of oxygen plasma treatment in forward forming homogeneous reset.
(a) Without treatment. (b) With treatment. ... 25 Figure 4.19 Current compliance influence in small, medium and large area devices, corresponding to 0.5 mm, 1 mm and 2 mm diameter circular shapes, respectively. (a) Approximate scaling CC with area. (b) Same instrument 0.1 A CC condition for all areas. ... 26 Figure 4.20 Gradual SET after different reset voltages 3 V, 4 V and 5 V at a reading voltage of − 0.8 V. Inset shows a set process in which the window at − 0.8 V is highlighted in green. ... 27 Figure 4.21 Retention loss from the same HRS to a lower resistance state, with application of various constant voltage bias shown in the legend... 28 Figure 4.22 Retention loss from the same LRS to a higher resistance state with application of various voltage bias; and fitting of these curves to a stretched exponential decay equation. ... 29 Figure 4.23 Joined retention from figures Figure 4.21 and Figure 4.22 at a reding voltage of − 0.1 V. 30 Figure 7.1 ITO/ZTO/Pt structure. (a) IV characteristics with a rectification ratio above 105.
(b) IV characteristics at different partial pressures. ... 37 Figure 7.2 Optical microscope measurements of different device diameter. The bottom electrode can be seen on the top right corner. ... 38 Figure 7.3 XPS spectra of depth profiling showing the main emission of (a) zinc, (b) tin, (c) gold, (d) titanium and (e) platinum, with increased etch time from bottom to top, in intervals of 500 s. ... 39 Figure 7.4 MLC capability of an untreated device achieved after a successful retention for 100,000 s. ... 40 Figure 7.5 Initial filamentary nature cycles of a small forward formed untreated cell, before being transformed into homogeneous type mechanism. ... 40
xvii
List of Tables
Table 4.1 Root means square (Rms) values corresponding to surface roughness of every layer portrayed in Figure 4.2. ... 12 Table 4.2 Atomic and mass concentration of C 1s, O 1s, Sn3d5/2, and Zn 2p3/2 for ZTO surface XPS
analysis. ... 15 Table 4.3 Activations energies and temperature coefficients of resistance values obtained from linear fittings on HRS and LRS, respectively. ... 22 Table 4.4 Tau and beta results from fitting LRS retention loss present in Figure 4.22. ... 29
1
1. Motivation and objectives
There are fundamental limits to the downscaling of materials involved in current complementary metal-oxide-semiconductor (CMOS) technologies. Therefore, there is a necessity to investigate new materials and device configurations to continue reaching milestones in line with Moore’s law. Amorphous oxide semiconductors (AOS) represent a low-cost (compared to crystalline silicon) and yet reliable matrix in which to build electrical elements with new and improved characteristics, while also allowing the integration of increasingly complex functionalities into a single device.
When it comes to non-volatile memories, the most promising candidate for the next generation of storage-class memory (SCM) [1] is resistive random access memory (RRAM) because of its high potential to combine the benefits of solid-state memories, such as high performance and robustness, with the archival capabilities and low cost per bit of conventional hard disk magnetic storage [2], [3].
To achieve such a high density in information storage, the best candidate for device configuration is the crossbar architecture, allowing a 4F2 minimum feature size [4]. Nevertheless, it
exhibits one major drawback related with sneak current paths [3], reducing the read margin significantly. This happens when reading a cell in the high resistive state (HRS) surrounded by others in the low resistive state (LRS) that act as parallel low resistance sneak current paths and result in a misread of the current state. Solving this problem requires adding a rectifying element (RE) in series with the RRAM to create a one-selector one-resistor (1S1R) crossbar configuration.
However, such stacked 3D architectures generally involve additional deposition processes and materials, thus increasing the complexity of fabrication at the nanoscale. In contrast, a “selectoreless” approach constitutes an alternative solution to this problem by integrating self-rectifying behavior onto the memory device itself within the crossbar array. This functionalization can be done by constructing a memory cell starting from an intrinsic rectifying or nonlinear device [1].
This study aims to explore a functionalized memory based on a well documented Pt/ZTO Schottky junction [5] and to investigate its resistive switching behavior after electroforming. A thin inert ohmic contact is deposited on top to realize a metal-insulator-metal (MIM) structure. All fabrication steps are by physical vapor deposition: e-beam deposition for different kinds of bottom and top electrodes and sputtering for the ZTO switching matrix. Electrical measurements of diodes include pristine rectification ratios and temperature IV sweeps; and for memory devices: endurance cycles, retention time, on/off ratio and switching speed tests will be performed.
3
2. Introduction
2.1 Memristor
A memristor is considered the fourth basic circuit element apart from the resistor, capacitor and inductor. It was predicted by Professor Leon Chua in 1971 [6] as a two terminal device whose behavior could be described by the relationship between charge moving through it and the magnetic flux surrounded by it [7], as described in the following equation:
𝑑(𝜑) = 𝑀 ∙ 𝑑(𝑞) (memristance)
where M stands for the memristance, which represents the current state variable of the device, and d(φ) and d(q) are flux and charge derivates, respectively. The effective resistance value depends on the magnitude and polarity of the voltage applied and the time that voltage has been applied [2]. In other words, the electrical response of a memristor is polarity and frequency dependent [7], yielding a nonlinear circuit element. This results in a pinched hysteresis IV characteristic, resembling a Lissajous pattern [8], which is the most attractive feature that permits this device to be used as a non-volatile memory [9]. In fact, inherent memory property of memristance is distinctly observed in the nanoscale [10] and therefore, it is considered as a strong candidate for the next generation memories capable of storing and processing multilevel resistance values as well as analog values [11].
2.1.1 HP Lab’s mechanisms
Even though the memristor was a theoretical device in the 70s, the first device was only later fabricated in 2008 by HP Lab. [7]. It consisted in a metal-insulator-metal (MIM) structure, where Pt and TiO2 were used, respectively, as metal and insulator thin films. The relying mechanism was based on a
resistance switching between a high resistive state (HRS) and a low resistive state (LRS) due to a stoichiometry change in the titanium oxide near the interface with the platinum active electrode (AE). An exact 2:1 ratio of O to Ti resulted in a TiO2 insulating film, composing the HRS, while a lower ratio, due
to the loss of some oxygen, resulted in an oxygen-deficient titanium oxide TiO2-x which exhibited a more
conductive characteristic.
Figure 2.1 Band diagram representation of switching between LRS and HRS according to the direction of the VO migration. Oxygen anions move in the opposite direction of VO. Adapted from reference [12].
Unlike in the case of typical semiconductors, such as silicon in which only electronic carriers move, in the case of the memristor, both the ionic and the electronic movements, into and out of the undoped TiO2, are responsible for the hysteresis in its current–voltage characteristics [2]. This
phenomenon is represented in Figure 2.1 in terms of a band diagram in which the arrows point to the travelling direction of oxygen vacancies (VO), which represent the absence of an oxygen atom and is an
move away from the Pt electrode and decrease the doping of the TiO2-x layer, raising the effective barrier
height, and consequently increasing the resistance. If a negative bias is applied instead, the process is reversed so that the TiO2 layer becomes more conductive due to the migration of oxygen atoms away
from AE, which decreases the barrier height and lowers the resistance. [7] 2.1.2 Oxygen exchange at metal-oxide active electrode interface
Recently it has been shown that an ionic exchange at the electrode interfaces can have a significant impact on switching characteristic of memristor cells. Schönhals et. al. proposed that there is a coexistence of two distinct mechanisms implicit in their Ta2O5/Pt interface [13]:
I. The first, depicted in Figure 2.2 (a), is due to the migration of VO near the interface, much like
the one described earlier for HP’s Lab., where the TiO2 is substituted by Ta2O5 and the
concentration of oxygen VO the oxide semiconductor close to the interface with the Pt AE is
responsible for switching.
II. The second, shown in Figure 2.2 (b) and (c), occurs when a high positive electric field applied to the AE forces oxygen to be extracted from the metal-oxide (leaving an VO defect) to be
physically absorbed in the AE. This reversable injection of O2 increases the VO concentration in
the oxide semiconductor very close to the interface, which sets the device ON. Figure 2.2 (c) portrays this forming and annihilation of oxygen anions mechanism in closer detail.
Figure 2.2 a) Schematics of the oxygen vacancy profile in reset and set mechanisms. b) Modified model including ion ionic exchange switching mode. c) Oxygen exchange reaction taking place in proximity to the switching interface during set and reset. Adapted from reference [13].
After a high voltage set, at a very low reading voltage bias, the current state will decrease due to annihilation of oxygen vacancy defects at the metal-oxide interface. The time dependence is governed by the diffusion of the absorbed oxygen within the Pt electrode toward the interface with the metal-oxide, the diffusion of the oxygen vacancies in the metal-oxide toward the interface with the Pt, and the defect annihilation process at the interface. The required combination of at least these three processes can explain why the resulting time dependence obeys the stretched exponential law. [13]
2.2 Digital Memory
A memory is an essential component to every logical computing system based on the von Neumann architecture, being responsible for storing data and instructions. Digital data is classified as either volatile or non-volatile, depending on whether the information is lost or not when the power supply
5 often to prevent the loss of the current state. The most common examples are static random access memory (SRAM) and dynamic random access memory (DRAM). While for non-volatile memories (NVM) speed is also of importance, the main attributes are reliability, retention time and feature size. Magnetic tapes, floppy disks, optical disks and more recently flash memories represent, by the order mentioned, the evolution of NVM. [1], [2]
As an alternative to improve current silicon technologies, mainly in feature size and power consumption, more types of NVM random access memories based on other physical phenomena have been researched and developed by the scientific community, the most relevant being magnetic (MRAM), phase change (PRAM), ferroelectric (FeRAM) and resistive (RRAM). [1]
2.2.1 Resistive random access memory
Out of all emerging NVM mentioned, RRAM is regarded as the one with the most potential to replace current floating gate technologies due to advantages in simplicity and potentially low cost. They can be built with just three layers like a capacitor structure, sandwiching a semiconductor or insulator between two metal electrodes. This is called a MIM structure and is the basic building block for cross point high density crossbar array, allowing for a 4F2 minimum feature size. [1], [2]
RRAM switching is generally attributed to the formation and rupture of conductive filaments inside of insulating oxides, like a controllable and reversible soft dielectric breakdown process. This usually involves two states: a high-resistive state (HRS) (or low-conductance state LCS) and a low-resistive state (LRS) (or hight-conductance state HCS), each representing the logic value of “0” and “1”, respectively. RRAM cells can achieve multiple levels (MLC) which increases the data density with the same physical cell size. [1]
2.2.1.1 RRAM classification
RRAMs are generally classified by their main mechanism out of a combination of possible physical and/or chemical affects. Ultimately, they can be classified by the dominant contribution mechanism out of thermal effect, ionic effect or redox-related effect and electronic effect as represented in Figure 2.3. [14]
Out of all core mechanisms displayed in Figure 2.3, the chalcogenide dominant ones are the most relevant with regards to oxygen composition and respective stoichiometry in oxide semiconductors or insulating materials, therefore these are further explained in the following sub-sections.
2.2.1.1.1 Thermo-chemical Mechanism (TCM)
Thermo-chemical mechanism (TCM), also called fuse-antifuse, exhibit either unipolar or nonpolar type operation as oppose to VCM or ECM type RRAMs [2]. Here switching is of filamentary nature, in which Joule heating caused temperature gradient is a more dominant force than electric field for driving cations or anions to migrate.
The formation and rupture of a conductive filament resembles a fuse, hence the name fuse-antifuse. This mechanism is sometimes mixed with phase change mechanism (PCM), in which the change between resistance states is instead due to a change in the crystalline phase of the material itself [14]. Both rely on a current-induced stimulus to increase temperature enough for switching to occur, therefore current compliance (CC) is a required parameter to control switching between states, being used when turning on the device ON and removed to turn it OFF.
2.2.1.1.2 Valence Change Mechanism (VCM)
Valence change systems are characterized by migration of VO in oxides, such as NiOx, HfOx
and TiOx, this last one is explained earlier by HP’s memristor mechanism. The voltage induces anion
movement of oxygen towards the anode (better described by the migration of oxygen vacancies towards the cathode), which results in a subsequent change of the stoichiometry, and a valence change of the cation sublattice associated with a modified electronic conductivity. [9], [14]
VCM is divided into filament type and homogeneous type. Filament type is area independent, while homogeneous type has an inverse proportionality relation between LRS and area. These types of devices are generally composed by metal-oxide Schottky contacts that allow anion movement.
On the other hand, filament type VCM is due to a localized formation and rupture of a conductive filament by change in oxidation state. For this reason, they exhibit little to no relation between LRS and area. It is possible to use p-type or n-type semiconductors to achieve the filament formation, since both can present abundant cation vacancies and anion vacancies, respectively.
Figure 2.4 (a) Pristine state. (b) Low resistive state after an initial forming process. (c) High resistive state after an applied VRESET. Arrows between (b) and (c) portray a valence change mechanism (VCM)
7 Oxygen vacancies act as donors in oxides, any change in their concentration within the Schottky barrier will affect the barrier width. Bipolar switching can therefore be achieved by modulating the Schottky barrier using the motion of the oxygen vacancies. [12]
2.3 Synaptic Memory
Unlike digital memory which is recorded in a combination of binary bits, biological memory works via changing the effective strength of neuron interconnections, also referred to as synaptic weight. The connection between two neuron cells is called a synapsis, which can be interpreted as two-terminal device that bears striking resemblance to a memristor.
In biological systems, synaptic plasticity, the ability to change the strength between neuron cells based on the input activity, forms the physical basis of learning and memory [16]. Similar to a biological synapse, the conductance of a memristor (resembles synaptic weight) can be incrementally modified by controlling charge or flux through it. Short-term plasticity (STP), also called dynamical synapses, refers to a phenomenon in which synaptic efficacy changes over time in a way that reflects the history of pre-synaptic activity. Two types of STP, with opposite effects on synaptic efficacy have been observed. They are known as short-term depression (STD) and short-term facilitation (STF), referring to a loss and strengthen, respectfully, of synaptic weight. Reports have shown that memristor devices can replicate to a certain degree this kind of biological phenomena with application of square wave pulses. [16]–[21] 2.4 State of the art of zinc-tin-oxide as a RRAM switching layer
Zinc-tin-oxide (ZTO) consists of highly abundant elements and exhibits promising electrical properties, such as electron mobilities of 10 cm2Vs-1 and above, and an easily controllable conductivity
[5]. A significant advantage of ZTO over indium-gallium-zinc oxide (IGZO) for resistive switching interface [22], is that ZTO does not contain In or Ga, two elements which are becoming increasingly expensive and potentially scarce [23]. Both IGZO and ZTO have good electron mobility, show good TFT performance and have high transparency [24], but unlike IGZO, ZTO is still not a widely used material in the resistive memory field.
Huang C. et. al. has reported a zinc-oxide (ZnO) memristor working with a similar oxygen exchange principal as the HP Lab. previously explained, while also exhibiting a rectifying behavior with the addition of a ZnO1-x VO reservoir layer between Pt and ZnO to improve performance [25]. Other
reports have used aluminum as a doping agent in ZTO switching layer [26], and a thin layer of aluminum-oxide (Al2O3) between ZTO and Pt interface deposited by ALD to work as a tunnel barrier to
prevent misreading errors in a crossbar array configuration [27], [28].
To our knowledge, there are no reports of plain ZTO being used as in resistive switching matrix for memory structures. However, reports have shown that ZTO creates a good rectification barrier with platinum [5], therefore an opportunity to functionalize memory devices based on this interface has presented itself as a solution to minimize crosstalk between cell arrays in a crossbar architecture.
9
3. Materials and Methods
This chapter will focus on the methods used to fabricate the diode structures, as well as the characterization techniques performed. All device samples were fabricated exclusively by physical deposition methods on a glass substrate (1737, Corning). Some complementary devices were also built using commercial ITO deposited on glass, as to reproduce results of ZTO/Pt Schottky interface reported in reference [5] where platinum is used as top electrode. These last ones follow a unrelated study and therefore are explored in Annex A.
3.1 Device fabrication
First, the common bottom electrode was deposited via e-beam evaporation (homemade apparatus) onto a 10 × 10 cm2 glass substrate. This step consisted of depositing a 20 nm Ti adhesion
layer followed by a 80 nm Pt active electrode (AE) layer. This substrate was then cut into smaller 2.5 × 2.5 cm2 samples that were cleaned in an ultrasound acetone solution bath for 5 min followed by
5 min in alcohol solution and finally washed with pure water and dried with a nitrogen gun.
Next, a ZTO layer is deposited via sputtering (AJA International, Inc., ATC-Orion 8 UHV) using a ceramic target of ZTO (1:1 weight fraction, AJA International, Inc., 99,99 %) at room temperature in the presence of a mixture of argon (20 sccm) and oxygen (20 sccm) (so that the relative amount of oxygen was kept at 50 %) at a deposition pressure of 2.3 × 10⁻³ mTorr with a r.f. power of 160 W and a target substrate distance of 35 mm. In these conditions 79 nm and 158 nm films were deposited in 18 min and 36 min, respectively.
Lastly, the top electrode (TE) is deposited in the same manner as the bottom electrode, with the exception that this layer is patterned by a shadow mask with three circular shapes of (1) 0.5 mm, (2) 1 mm and (3) 2 mm in diameter. In this step, titanium (6 nm) and gold (60 nm) was used as TE. Figure 7.2 in Annex B depicts an optical microscope image for measurement. The following Figure 3.1 shows the distribution of every layer of the device’s constitution, divided into each deposition step.
Figure 3.1 Device structure layer by layer, devided into each deposition step. 3.1.1 Oxygen treatment
To attempt an enhancement on both diode and memory characteristics, an oxygen plasma treatment was performed on the bottom electrode (BE) platinum surface prior to depositing the ZTO layer. This treatment was realized inside AJA sputtering system and consisted of applying a substrate bias of 10 W in the presence of oxygen (20 sccm) at a pressure of 20 mTorr with an additional r.f. power of 50 W to stabilize the plasma, for a duration of 10 min.
3.2 Device characterization
Temperature depend I-V characterization was performed using a flow of liquid nitrogen and vacuum inside a probe station (JANIS ST-500) and a Temperature control unit (LakeShore 336). Here, in each 10 K temperature increment between 300 K to 200 K, a retention at + 0.1 V during 10 s (1 data point per second) was measured for as-formed RRAMs in both LRS and HRS.
ZTO crystallinity was characterized using x-ray diffraction (XRD) measurements being scanned in the 5-65º 2θ range with a step of 0.033º in a PANalytical’s X’Pert PRO MRD diffractometer with CuKα radiation.
The surface roughness of platinum, ZTO and TE films were analyzed and compared using atomic force microscopy (AFM) in an Asylum research MFP-3D, and examined with the data analysis software Gwyddion. Additionally, conductive AFM was also attempted on a TE portion of a sample but yielding poor signal.
Further material analysis includes x-ray photoelectron spectroscopy (XPS) for material composition and binding energies at surface and deeper layers. A Kratos Axis Supra was used with monochromatic AlKα radiation and CasaXPS for data analysis.
3.3 Electrical characterization
ZTO RRAM electrical characterization was performed using a semiconductor characterization system (Keithley 4200SCS). These two terminal devices were connected to source measure units (SMU) via the top and bottom electrodes with the objectives to investigate: (1) pristine state (2) electroforming process, (3) set voltage, (4) reset voltage, (5) operation window, (6) endurance and (7) retention time. All measurements were performed by applying voltage sweeps to the TE while keeping the BE grounded.
Electroforming (EF) was performed by applying either positive or negative dual voltage sweeps to the TE, always starting and ending at 0 V. A current compliance (CC) was used with the smallest possible value which allows switching properties, to achieve the lowest power consumption. Electroforming without CC (instrument 0.1 A CC) was also tested.
The reset voltage is performed by applying a 1 V amplitude dual voltage sweep to the TE without CC. In case the reset process does not occur, the dual voltage sweep is repeated with an increase in amplitude of 0.5 V until a reset is achieved. Both polarities after the of reset after EF were tested.
Set voltage is executed with a fixed CC with the same value as in EF, starting always with 0 V and sweeping with the same direction as the EF process until the current level matches that of the CC, and going back to 0 V while maintaining a low resistive state LRS state. Setting with a larger and smaller CC than the one used in EF process was also tested.
The I-V characteristics was always performed without delay time. Endurance tests were conducted with consecutive set and reset processes for 50 or 100 cycles, depending if the device could withstand them or not. Retention test for both ON and OFF states where performed at + 0.1 V constant
11
4. Results and discussion
This chapter focuses on the characterization of various fabricated MIM structures. The analysis is divided into two sub-chapters, one for material analysis of as-deposited devices, and the other for electrical characteristics after their respective electroforming or device initiation into memories, according to different electroforming procedures.
4.1 Material characteristics 4.1.1 XRD
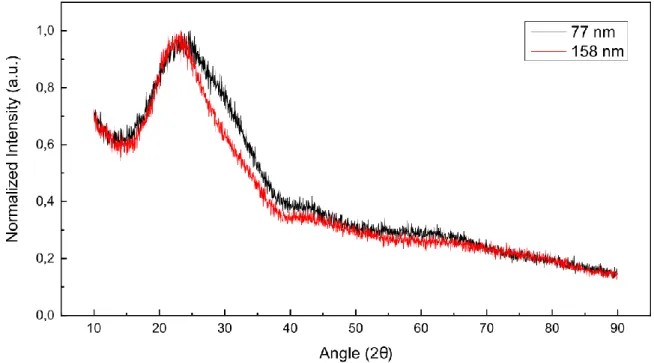
X-ray diffraction is a technique used to determine the presence of different crystalline phases in a material. Therefore, to determine whether the constitution of our ZTO was truly amorphous, a diffractogram was traced with samples deposited over corning glass substrate with thicknesses of 77 nm (black) and 158 nm (red).
Figure 4.1 Diffractogram of ZTO with 77 nm (black) and 158 nm (red) thicknesses.
From the diffractogram present in Figure 4.1 it is impossible to discriminate any single peaks from any zinc or tin oxide crystalline phases, therefore our films were indeed amorphous.
4.1.2 AFM
Atomic force microscopy (AFM) is an extremely sensitive nanoscale technique which permits a mapping of topographic profiles and conductive profiles (CAFM) when applying a fixed voltage bias to the tip. To determine if our deposited and cleaned platinum layer had hillocks, which is a common occurring phenomena when platinum is used as a bottom contact [29], [30], we measured the roughness of all three deposition stages and compared them. The goal here was to investigate how the roughness of the individual layers change when they are deposited on top of each other and if there is any layer that introduces significantly more or less roughness than the other ones beneath. The following Figure 4.2 and Table 4.1 shows the topographies and roughness of each layer, respectively.
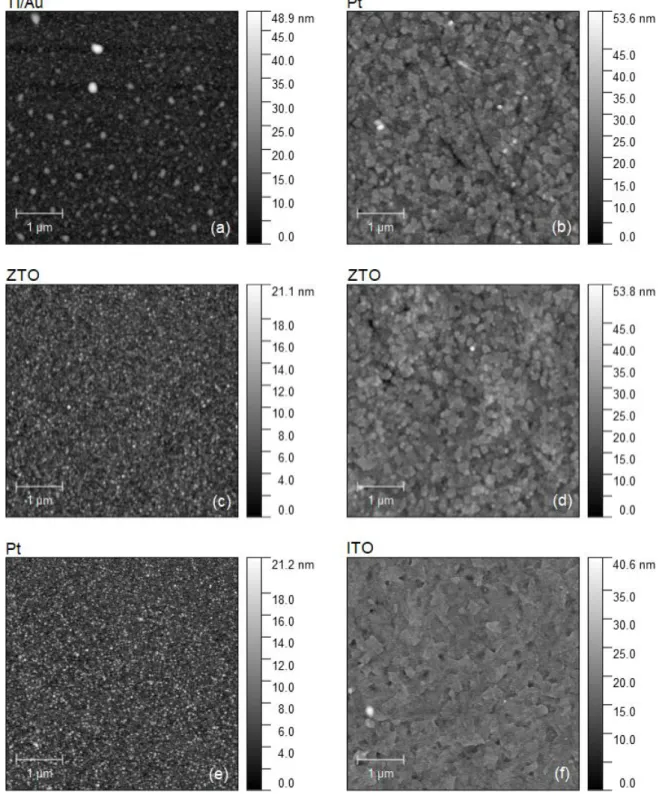
Figure 4.2 AFM measurements of both Pt/ZTO/TiAu (left) and ITO/ZTO/Pt (right). (a) and (b) Top electrodes. (c) and (d) ZTO layers. (e) and (f) Bottom electrodes. All dimensions are of 5 × 5 μm2.
Table 4.1 Root means square (Rms) values corresponding to surface roughness of every layer portrayed in Figure 4.2.
Pt/ZTO/TiAu ITO/ZTO/Pt
(a) 3.606 nm (b) 4.391 nm
(c) 1.958 nm (d) 4.401 nm
13 From Table 4.1 it is visible how surface roughness is in fact being lowered in the ZTO layer above platinum for Pt/ZTO/TiAu structure, which support the idea of existing hillocks. In the ITO/ZTO/Pt structure there is a slight roughness decrease from ZTO to Pt, however from ITO to ZTO there is a significant increase in roughness.
The presence of hillocks in platinum bottom contact can be seen in a topographic measurement of a 25 × 25 μm2 area, as shown in the following 3D image.
Figure 4.3 Hillocks represented in a 3D image of platinum bottom electrode.
These structures may be responsible for the differences in current values obtained in the forward direction of the diodes within the same sample, because they are not homogeneously distributed, as portrayed in Figure 4.3.
Finally, some CAFM measurements were also made on both ZTO and top electrode layers. The first ones did not show any current and the second ones were showing a very noisy signal response. It is of no surprise that Hall effect measurements were also not possible, because our ZTO was too insulating.
4.1.3 XPS
X-ray photoelectron spectroscopy (XPS) is a quantitative surface analysis technique that gives information about elemental composition and chemical states of a material up to 9 nm in depth. This technique helps gathering furthermore information about the existing phases and oxidation states at the surface of a sample that could not otherwise be obtained with XRD.
Figure 4.4 (a) shows a set of spectra obtained at the ZTO surface of a sample in which the substrate was ITO. It is assumed that this ZTO layer is thick enough so that this surface can serve as a reference for all devices built, regardless of the structure it is inserted in.
Figure 4.4 X-ray photoelectron spectra obtained from the ZTO surface: (a) Full spectrum. (b) Valence band minimum. (c) Sn 3d5/2 (d) Zn 2p3/2. (e) O 1s. (f) C 1s.
The wide spectrum in Figure 4.4 (a) shows that the material consists only of zinc, tin, oxygen and carbon. The valence band (VB) maximum shown in Figure 4.4 (b) is located at approximately 2.869 eV. With the band gap of ZTO of 2.8 eV [31], this corresponds to a degeneratively doped semiconductor material, but we must not forget that AOS materials surfaces are sensitive to ultra-high vacuum reductive atmosphere as the one inside XPS test chamber.
15 The peaks for Sn 2p3/2 and Zn 3d5/2 are presented in Figure 4.4 (c) and (d), respectively, and
are both well described as a single component. This means that both tin and zinc are fully oxidized in the compound.
The shape of O 1s in Figure 4.4 (e) suggests, that the emission is composed of two or three components. In literature, three components have been reported: Oxygen surrounded by metal cations and other oxygen ions (530.4 eV), oxygen in oxygen-deficient regions (531.7 eV) and surface-adsorbed species such as carbonates and water (532.7 eV) [32]. Comparing the relative intensity of the second oxygen to the mentioned literature, we can conclude that the ZTO in our case is relatively rich in oxygen. This confirms the effectiveness of using a high amount of oxygen during the sputter deposition to successfully oxidize the material.
The C 1s carbon emission is typical for adventitious carbon species adsorbed from the atmosphere.
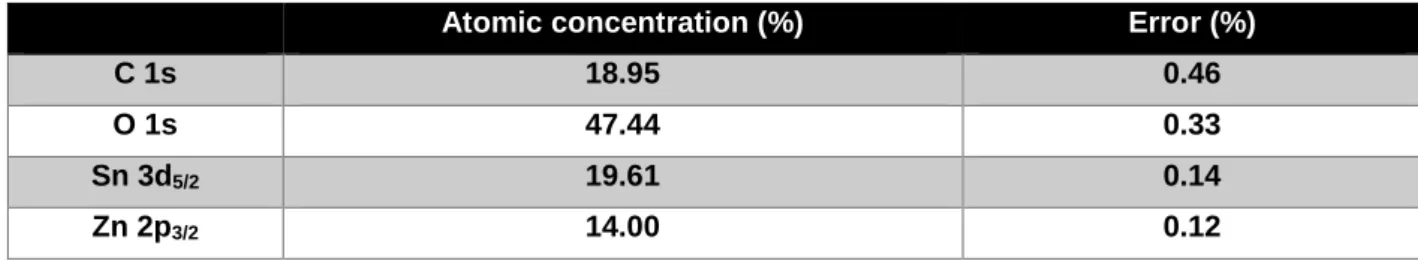
Table 4.2 Atomic and mass concentration of C 1s, O 1s, Sn3d5/2, and Zn 2p3/2 for ZTO surface XPS
analysis.
Atomic concentration (%) Error (%)
C 1s 18.95 0.46
O 1s 47.44 0.33
Sn 3d5/2 19.61 0.14
Zn 2p3/2 14.00 0.12
ITO is known to show a Sn surface segregation [33], and since ZTO is similar to ITO, it is possible that this phenomena is also responsible for the uneven quantification ratio (1.4) of Sn 3d5/2 to
Zn 2p3/2 obtained from a 1:1 ZTO target deposition. Later depth profiles were performed by removing
material from the surface, and it was found that there was a segregation of metallic Sn near both the interfaces with top Ti/Au and bottom Pt metal contacts. In Annex C there are the relevant spectra representing these results.
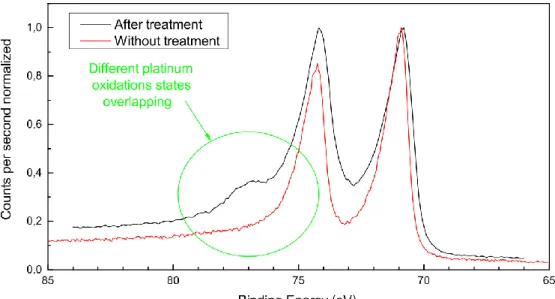
Additionally, to determine whether the oxygen plasma treatment has effectively changed the oxidation state of platinum, the Pt 4f spectra of a platinum surface is compared in Figure 4.5 before and after oxygen plasma treatment in a Diener Zepto Reactor.
Figure 4.5 Spectrum of Pt 4f region of oxygen plasma treated platinum surface (black) and untreated (red). Green circle refers to the zone where different platinum oxidation states overlap each other.
The component at around 77 eV after the plasma treatment is a clear indicator for oxidized platinum. It is also important to note that due to exposure to ultra-high vacuum inside the XPS (< 10−9 mBar), the intensity of the component at 77 eV of the oxygen treated sample was gradually lowering with repeated measurements, meaning that oxygen was removed from the surface under ultra-high vacuum conditions.
4.2 Electrical characteristics
4.2.1 Oxygen plasma treatment influence in pristine state
The following Figure 4.6 contains a comparison of pristine state for both without and with oxygen treatment on platinum surface.
Figure 4.6 I-V characteristic comparison of pristine state without (black) and with (red) oxygen treatment in (a) logarithmic scale and (b) linear scale.
It is clear how oxygen treatment decreases the reverse current by an order of magnitude. This may be due to a filling of oxygen vacancies, which leads to a reduction of the free-carrier concentration in the vicinity of the ZTO/Pt(O) interface. This increases the depletion layer width and subsequently reduces the tunneling current, resulting in a higher rectification ratio. [34]
17 In the following sub-sections, we shall present various types of switching mechanisms obtained based on the polarity of voltage sweep applied to the TE during electroforming or device initiation processes. Forward and reverse are in concordance with diode polarity, being the first obtained at negative voltages and the second at positive voltages.
4.2.2 Electroforming
The forming step is critical in determining the memory cell’s coming switching behavior. It constitutes the first set process, which, in the case of a filament nature, is also considered a soft breakdown. This phenomenon generally requires a larger electric field than that of the consecutive set processes, and a current compliance (CC) to prevent the current overshoot and permanent breakdown. If the electric field needed is not significantly higher than the following set voltage the term device initiation may be used instead of electroforming. A memory cell is then formed from a pristine state to a low resistive state (LRS) by formation of a nanoscale conductive filament (CF). From this ON state, a reset process is required for erasing the memory back to a high resistive state (HRS) and is performed without CC, applying a voltage bias of the opposite polarity (bipolar switching) or the same polarity (unipolar switching) as in the set process. It is important to note that due to the abrupt nature of the breakdown involving the growth of a CF, the HRS is always going to be more conductive than the initial virgin state. Figure 4.7 shows the possible electrical characteristics of filamentary resistive switching behavior, which are unipolar (or non-polar) (a) and bipolar (b).
Figure 4.7 Examples of the resistive switching current-voltage characteristic. (a) Unipolar switching on both polarities, also considered non-polar. The resistive switching (RS) mechanism is certainly filamentary (b) Bipolar switching with negative set and positive reset polarities. The RS mechanism can be both filamentary or interfacial. Adapted from reference [9].
Once the RS template is formed in the memory cell, the set and reset processes will only occur at the quantum point contact within a small area close to the corresponding contact, explaining the lower voltage operation. The magnitude of CC has an impact on the performance of the RRAM, because it determines the shape and the width of the conductive filaments (CFs). For this reason, a gradual forming process, in which the CC is increased incrementally between various forming voltage sweeps has been reported to be successful method to better control filament growth and final cone shape [23], [24].
4.2.3 Bipolar resistive switching properties
Electroforming (EF) in the reverse polarity of the diode always lead to a reverse set process and resulted in a non-volatile memory cell. To activate the conductive filaments (CFs), an initial large dual voltage sweep of 8 V with a small measuring step of 10 mV is required, as shown in Figure 4.8 (a) in black arrows 1 and 2. EF was achieved at 7.48 V, and from this point forth the current levels are much higher when compared with pristine state, below 1 V. Also, the set voltage decreases drastically from the first EF to 2.42 V on the first set process.
The first reset process is also important in establishing a repeatable switching RRAM. It is preferred to happen in the negative polarity for bipolar switching, with a low voltage between − 1 V and − 2 V. Interestingly, the reset process can also be done in the same polarity as the set process with symmetrical voltages of 1 V to 2 V, as shown in Figure 4.8 (a) in red. However, as we will present later, the reverse set process tends to show a non-polar TCM filamentary based switching.
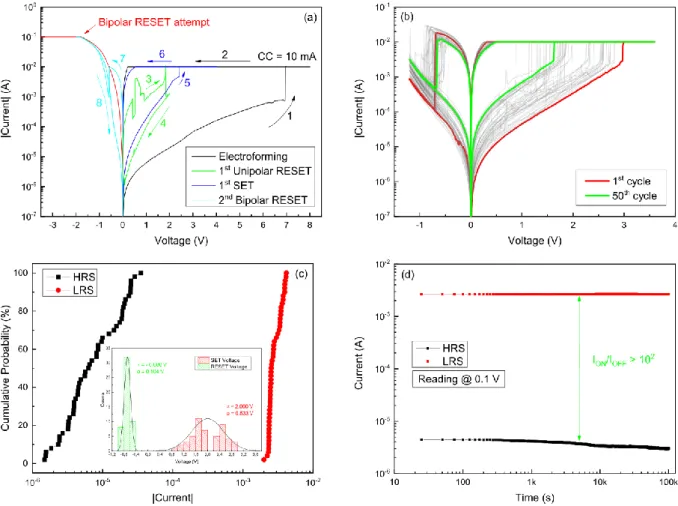
Figure 4.8 Bipolar resistive switching of a 79 nm thick untreated device. (a) Electroforming, first set and different reset process at both polarities. (b) Endurance for 50 successful consecutive cycles. (c) Cumulative probability of ON and OF current levels with an inset of VSET and VRESET distribution.
(d) Retention for 100,000 s at a reding voltage of 0.1 V.
Before submitting this cell to cycling endurance, it was first submitted to several cycles with successively smaller voltages. This intermediate process (not shown) is mandatory in achieving the best switching endurance possible, because it ensures the lowest power consumption, which in return reduces the probability of filament growth to the point of device short-circuit, i. e., device stuck in LRS.
19 successful, and in (c) the cumulative probability of ON and OFF current states are shown, along with an inset of set (VSET) and reset (VRESET) voltage distribution. This distribution was then fitted to a normal
Gaussian distribution and the mean and standard deviation values obtain for set and reset were (2.00 ± 0.53) V and (− 0.69 ± 0.10) V, respectively.
Additionally, Figure 4.8 (d) presents the retention for 105 s at a reading voltage of 0.1 V. The
window is kept greater than 102, and gets slightly larger after about 5 × 10³ s.
Once being submitted to 50 consecutive successful switching cycles and 105 s retention at each
state, the memory was submitted to 100 more cycles to further test endurance. It withstood 74 more consecutive cycles until failure. This failure may be due to large area and non-uniform resistive switching behavior. Temperature of the measurement itself is also a significant parameter that was not controlled, which may have led to a premature failure. Full device patterning and the use of pulse IV as opposed to double sweep should drastically increase the endurance.
The following Figure 4.9 shows (a) the set and reset cycles and (b) the cumulative distribution with inset of counts for the successful switches, after retention.
Figure 4.9 Endurance continuation of bipolar switching represented in Figure 4.8. (a) Endurance tests until failure at cycle number 74. (b) Cumulative probability of ON and OF current levels with an inset of VSET and VRESET distributions, both for the 74 successful cycles.
After retention, with successively more stimuli the mean value for the set voltages decreased to (1.63 ± 0.29) V. Reset voltage only decreased slightly to (− 0.66 ± 0.11) V, meaning that the reset process follows more consistent physical mechanism.
Since there is some variation in the initial pristine state, after the electroforming it is highly unlikely to obtain the same exact characteristics device-to-device without also shrinking the effective area by fully patterning the devices.
Also, there is one device reported that, after similar retention characteristic for 100,000 s showed two levels of MLC programming capability. This was an isolated case and was not reproducible, therefore it is portrayed in Annex D.
Nevertheless, we present the lowest power consumption memory that was able to be initiated at just 1.54 V (Figure 4.10 (a)). We note that the current level of the pristine state here is lower than the previous one, in addition the formation of CFs and resistance changes is obtained during different steps as can be seen in Figure 4.10 (a). The set-reset process was then performed with decreasing CC of
10 mA to 0.5 mA. An endurance of 50 cycles was recorded (Figure 4.10 (b)) with some faulty switching in between that are shown in Figure 4.10 (c) in cycle-by-cycle dependency as opposed to cumulative probability, because it better portrays the behavior throughout the full endurance test. Set and reset voltages of successful cycles were again fit to a normal distribution obtaining (0.768 ± 0.0398) V, and (− 0.478 ± 0.187) V, respectively. These values are significantly lower than the ones shown earlier from a device on the same substrate. Set voltage has much less variation than reset voltage, which further indicates variability that can originate from a different pristine state and can be addresses with full device patterning.
Unfortunately, there is no retention measurement for this memory, however it is expected to follow the same trend as the exposed earlier in Figure 4.8 (d), since it is also filamentary based.
Figure 4.10 Lowest power consumption achieved of a 79 nm untreated device. (a) Electroforming and first three cycles with decreasing CC of 10 mA to 0.5 mA (b) Endurance for 50 cycles. (c) Window distribution of cycling from (c). (d) VSET and VRESET distribution of successful switching cycles.
In Figure 4.11 the history of a memory with oxygen plasma treatment on platinum surface is shown. After an electroforming process following the same procedure as with untreated devices, endurance only yielded 18 consecutive cycles (Figure 4.11 (b) and (c)) before failing to switch any further due to being stuck in LRS. This concludes that oxygen treatment hinders endurance significantly.
Nonetheless, oxygen plasma treatment was not targeted directly at improving RRAM performance, so these results are simply to show that such treatment is not viable to achieve abrupt
21 However, retention characteristics of as-formed devices is kept similar, which supports the idea that the same filament mechanism is also present before switching property is lost completely due to short circuit.
Figure 4.11 Oxygen treated device with 79 nm thickness. (a) Electroforming and first set-reset cycles. (b) Cycling endurance for 31 cycles. (c) Window endurance of cycles, showing a failure from cycle number 19 and beyond. (d) Retention time for 100,000 s at a reading voltage on 0.1 V.
4.2.3.1 Temperature dependency of LRS and HRS
To characterize the conduction nature of both HRS and LRS, four as-formed devices, two on each state, were submitted to retentions for 10 s at 0.1 V reading voltage on different temperatures ranging from 300 K to 200 K in increments of 10 K. The following Figure 4.12 shows all devices.
From the graphs in Figure 4.12 we can conclude that in HRS the resistance decreases with temperature increase, which is indicative of a semiconductor material; and in LRS the opposed happens, which is indicative of a metallic material. Also, from comparing Figure 4.12 (a) with (b) resistance at HRS changes much more linearly with temperature than in LRS. This could be explained by some change in volume and shape of metallic filament with temperature.
It is also of interest to calculate activation energy (Ea) on the semiconductor like HRS using
Arrhenius plot, and to calculate the temperature coefficient of resistance (TCR) for the metallic LRS behavior. The following Figure 4.13 portrays these plots coupled with their respective linear regressions.
Figure 4.13 (a) Arrhenius plot for HRS and (b) TCR plot for LRS.
The results from linear fittings are shown in the following Table 4.3. The activation energy calculated in the same manner for the pristine state at − 1 V (not shown) is 46.2 meV, which is in agreement with results from literature for IGZO [36]. Note that the activation energies for HRS are lower compared to pristine state, however this is somewhat expected since they represent a state after an electroforming process that has a memory template. As for the TCR values, they are one order of magnitude less when compared to the TCR of metallic platinum thin film deposited via e-beam (3.1 × 10⁻³ K−1) [37], and of both zinc and tin metallic phases (3.6 × 10⁻³ K−1 and 4.5 × 10⁻³ K−1, respectively [38]) present in the ZTO switching matrix, which according to some authors excludes the possibility of electrochemical mechanism.
Table 4.3 Activations energies and temperature coefficients of resistance values obtained from linear fittings on HRS and LRS, respectively.
HRS LRS
Device 1 Device 2 Device 3 Device 4
𝐸𝑎= 15.4 𝑚𝑒𝑉 𝐸𝑎= 25.12 𝑚𝑒𝑉 𝑇𝐶𝑅 = 6.17493 × 10⁻⁴𝐾−1 𝑇𝐶𝑅 = 6.54765 × 10⁻⁴𝐾−1
4.2.4 Unipolar resistive switching properties
To prove that the mechanism is non-polar, unipolar switching is obtained performing the reset process in the same polarity of the set voltage but removing the CC. So, an untreated 79 nm thick device
23 From user experience, even if the first reset is made in a bipolar way, like in Figure 4.14 (a) in red, the memory can work in a unipolar manner. The unipolar behavior is a signature of filamentary resistive switching which shows the TCM mechanism where the filaments are ruptured by Joule heating [39], resulting in a nonpolar switching [40]. Unfortunately, there is no retention for unipolar, however it should be expected to be similar to the results from bipolar RRAM.
Figure 4.14 Unipolar resistive switching of an oxygen untreated device with 79 nm thickness. (a) Electroforming. (b) Endurance for 50 cycles. (c) Window distribution of endurance cycles. (d) VSET
and VRESET distribution of successful switching cycles.
The reset process has less variation (0.950 ± 0.243) V than the set process (3.070 ± 0.304) V, which is opposed to results from bipolar switching. Nonetheless, bipolar switching showed better cycle-to-cycle switching when compared with unipolar mechanism, with combined variation in switching voltages, being the reset process the most varying of the two. These problems may again be resolved by patterning and miniaturization of the device area.
4.2.5 Thickness impact on RRAM
Even though the initial purpose of studying these MIM structures was for RRAM application, the inherent memory mechanism tends to be in favor of an interface type gradual shift mechanism. The following two devices reported are from the same e-beam deposition, however the second one has twice the thickness on the ZTO thin film. In the first one we can clearly see a shift in resistive switching behavior comparing the first with the last endurance cycles in Figure 4.15 (b), following the arrows numbers 1 to 4 and 5 to 8, respectively. It changes polarity from an 8-wise to an counter-8-wise, according to the designations given in reference [13]. This type of switching has been reported before in Pt/ZnO/Pt interface switching [41].
Figure 4.15 Change in mechanism in an oxygen untreated device with 79 nm thickness. (a) Electroforming in the reverse polarity. (b) Endurance with a shift in mechanism from a set in the reverse polarity to a set in the forward direction.
Comparing this last memristor device with one that has twice the ZTO thickness (158 nm) it becomes clear that the memristor operation is more consistent with increasing thickness. It even permits the first reset to occur in a bipolar manner as shown in Figure 4.16 (a) and a yield of 76 out of 100 successful cycles. From comparing solely thickness influence on the last two devices it becomes clear that the RRAM digital switching benefits from increasing thickness, and thus analog switching does not benefit from increasing thicknesses.
Figure 4.16 Device without oxygen treatment and with twice the thickness (158 nm) in ZTO switching layer. (a) Electroforming in the reverse polarity. (b) Endurance for 100 switching cycles with 76 % yield. 4.2.6 Forward set
All combinations of switching mechanisms were attempted, including electroforming and set in the forward polarity. From this behavior, only bipolar mechanism was obtainable, meaning it was impossible to operate a reset in the same polarity. This is indicative that there is a different mechanism than the non-polar one present when EF in the reverse polarity. If it was possible, unipolar in the forward direction would have been the ideal mechanism to prevent sneak current paths in a crossbar array, because it would probably retain a reasonable rectification after forming.
A 79 nm thick device is used to explain forward set bipolar resistive switching of ZTO with and without oxygen treatment.
25 Figure 4.17 Forward electroformed large area untreated device. (a) Electroforming. (b) Set and reset at different incremental voltages. (c) Endurance for 50 cycles. (d) Gradual reset from (b) in linear scale.
Resistive switching is of a threshold manner under 1 V reset magnitude and analog over 2 V magnitude. In Annex E there is a device where this initial threshold switching is more pronounced. However, by extension of the reset voltage the device can switch off gradually Figure 4.17 (d). A maximum of 5 V was used for the reset process to prevent electroforming in the reverse polarity and to keep under the USB max Vpp standard.
The following Figure 4.18 portrays the differences introduced by oxygen treatment in this switching mode.
Figure 4.18 Comparison of oxygen plasma treatment in forward forming homogeneous reset. (a) Without treatment. (b) With treatment.
Apparently, the oxygen treatment makes a larger set variation cycle-to-cycle. In Figure 4.18 (b) shows that the set voltage increased beyond − 2.5 V in absolute value, whilst in the case of the non-treated device it never surpassed − 2.5 V.
4.2.6.1 Area dependency of the analog resistive switching
As mention in the previous sub-section, when electroforming a device in the forward direction it always led to a bipolar reset. However, this mechanism tends to be area dependent. To finally conclude so it is necessary to investigate EF current compliance and area correlation. For that, two scenarios were tested for all three areas, one with linear scaling CC with area (Figure 4.19 (a)) and another without CC (instrument 0.1 A) (Figure 4.19 (b)).
Figure 4.19 Current compliance influence in small, medium and large area devices, corresponding to 0.5 mm, 1 mm and 2 mm diameter circular shapes, respectively. (a) Approximate scaling CC with area. (b) Same instrument 0.1 A CC condition for all areas.
After setting, all ON current densities are the same, shown by Figure 4.19 (a), if a CC is used that scales with the device area. This shows area dependence in the LRS; however, CC did not scale exactly with the device area, i. e., CC was not increased following a fixed current density in all areas. Nonetheless, it is possible to conclude that forward resistive switching is an area-dependent resistive switching, since in the case where instrument compliance (0.1 A) was used in Figure 4.19 (b) all OFF current densities are the same, after reset, regardless of which device area used. This shows area dependence in the OFF state, which is indicative of a non-filamentary switching process.
4.2.6.2 Gradual SET/RESET and retention loss
In general terms, it is important for a memristor device to retain its state for the longest period possible whilst being read. Therefore, the term retention loss means that at the small read voltage (± 0.1 V) the current state is not stable. Furthermore, an analog memristor shows a vast spectrum of conductance states between the HRS and LRS that are accessed by applying a constant voltage bias over time, gradually switching from one state to the other. This phenomenon is called gradual SET/RESET depending on the initial and eventual current state. This process is dependent on the duration and amplitude of the signal input.
27 transition for untreated devices with 79 nm ZTO in both directions, i. e., (1) HRS → LRS and (2) LRS → HRS.
First, to prove that the decay is dependent on the initial state, we demonstrate the temporal current evolution characteristics with a fixed voltage bias (− 0.8 V) starting from different conductance states achieved in a gradual reset process. For this, three current responses over time were measured after 3 V, 4 V and 5 V incremental reset process, shown in Figure 4.20. To ensure these states were only reset voltage dependent, they were achieved by full cycling a couple of times before coming from the same LRS.
Figure 4.20 Gradual SET after different reset voltages 3 V, 4 V and 5 V at a reading voltage of − 0.8 V. Inset shows a set process in which the window at − 0.8 V is highlighted in green.
A constant voltage bias of − 0.8 V was used because it was the lowest voltage showing a window greater than 102, as shown in inset of Figure 4.20. The ratio at which devices change to a
lower-resistance state depends on the current state, i. e., how much reset voltage was applied earlier. For instance, the 5 V reset does not reach the lowest-resistance state after 4,000 s. Notice how all these curves tend to reach to the same LRS which coincides with the current level at − 0.8 V from the LRS.
All curves in Figure 4.21 start from the same HRS, each one at a different voltage bias applied to the TE to study the influence of voltage amplitude in turning the device on. Basically, the device can either be turn on by application of voltage sweep or gradually over time at a fixed voltage. Even though the switching voltage in voltage sweep is of about − 2.4 V, the device can switch to the LRS with a − 1.5 V or − 2 V voltage bias over a period of 23 s or 358 s, respectively. It is expected that voltage levels between − 1.5 V and − 2 V take times between 23 s and 358 s.
Figure 4.21 Retention loss from the same HRS to a lower resistance state, with application of various constant voltage bias shown in the legend.
The same procedure was made on the opposite direction from the same LRS. In order to show the similarity of the retention loss of our memristor to memory loss in biological system [42], the declines to HRS present in Figure 4.22 were fitted to a stretched exponential decay (SED) function [13], [43]:
𝑦(𝑡) = 𝐴1× 𝑒 −(𝜏𝑡
1)
𝛽
+ 𝑦0
where A1 is the initial conductance value, y0 is very small parameter that compensates any
existing offset and overall helps fitting, τ1 is the decay constant and β is the stretch index between 0 and
1. The stretched exponential behavior originates from the wide distribution of activation energies and the associated wide range of relaxation times among different relaxation processes in a disordered system. Thus, τ1 and β in the equation jointly account for the collective behavior of all possible relaxation
processes for VO in the memristor system.
In order to evaluate the retention time of LRS and HRS of an analog memristor, Figure 4.23 shows the retention time for 1,000 s from both states present at a reading voltage of − 0.1 V. The retention loss of about 10-1 due to a decrease of LRS is observed. The retention time of synapse device
and the programmable gradual current increase/decrease has a great potential for neuromorphic applications.