IDENTIFYING TARGET AUDIENCES ON SOCIAL NETWORK SITES
BY ANALYISNG USER CONNECTIONS:
A SOCIAL NETWORK ANALYSIS APPROACH FOR INSTAGRAM
Tina Schmidt
Dissertation submitted in partial fulfilment of requirements for the degree International Master of Science in Management at Universidade Católica Portuguesa
ABSTRACT
Social Network Sites offer users and brands a platform to interact by following each other and liking, commenting and sharing of content. This dissertation demonstrates that brands can leverage on rich data emerging from user-user-, user-brand-, and brand-brand-connections on Instagram to identify, understand and target new prospects. The concept of homophily
suggests that users are mainly connected to other users they perceive as similar to themselves and to brands they identify with. Taking these insights into account, this dissertation aims to develop an audience selection approach to identify prospects that are likely to be interest in following a focal brand on Instagram. By extracting real network data from Instagram, users were segmented based on their “follow-relationship” to a set of exemplar brands that share a similar image with the focal brand. Four segments were identified and profiled: True-Brand-Lovers, Fashion Seeker, Hidden Treasures and Intangibles. Additionally, by taking secondary layer effects into account, a targeting experiment was conducted on Instagram to examine whether and to what extent resulted segments can be employed to find highly interested prospects. Findings disclosed that new prospects can especially be found by detecting overlapping followers between brands within the set. Moreover, tendencies were found that new prospects can be detected in the secondary layer of existing followers, especially when their connection to the set is taken into account as well. Therefore, the results of this study suggest that taking users affinity to other entities to account can help brands to define more precisely targeting decisions.
SUMÁRIO
As redes sociais oferecem a utilizadores e marcas uma plataforma para que interajam. Esta dissertação demonstra que as marcas podem aproveitar a rich data emergente de interações utilizador-utilizador, utilizador-marca e marca-marca no Instagram, para identificar, perceber e visar potenciais clientes. O conceito de homofilia sugere que utilizadores estão
principalmente ligados a outros utilizadores que sejam semelhantes a si mesmos e a marcas com que se identificam. Esta dissertação ambiciona desenvolver uma abordagem de seleção de audiência para identificar novos clientes que poderão ter interesse em seguir uma marca no Instagram. Ao extrair dados reais do Instagram, os utilizadores são segmentados com base na sua “follow-relationship” para determinar um conjunto de marcas que partilham uma imagem semelhante com a marca focal. Quatro segmentos foram identificados e divididos:
True-Brand-Lovers, Fashion Seeker, Hidden Treasures e Intangibles. Adicionalmente, ao ter em
consideração efeitos de segunda camada, uma experiência de targeting foi conduzida no Instagram para examinar se e em que medida os segmentos resultantes podem ser utilizados para descobrir potenciais clientes altamente interessados. Os resultados indicam que
potenciais clientes podem ser encontrados particularmente ao detetar seguidores sobrepostos dentro do grupo. Para além disso, foram encontradas tendências que indiciam que potenciais clientes podem ser detetados na segunda camada de seguidores, especialmente quando a sua conexão ao grupo é levada também em conta. Portanto, os resultados deste estudo sugerem que ter em conta a afinidade dos utilizadores a outras entidades pode ajudar as marcas a definirem com mais precisão as suas decisões de targeting.
ACKNOWLEDGEMENTS
As important as online networks are for marketers, my personal network of family and friends is to me. This is, why I want to speak out special a “Thank you” to all the people that are not only part of my experiences, but also supported me by making them. Without you, I would not have become the person who is finally delivering this master dissertation. Before I thank my family and friends, I would like to thank Ana and Pedro for giving me so much interesting input and support during the last weeks.
Thank you to my parents: Mama, Papa, and Noppi and Tine. Thank you for giving me the chance to always follow the path I wanted to take although it was not always easy for you letting me go! Without you I could not be as proud as I am. Thank you to my siblings, Dani, Phil and Fabi! Having you always around, make me always feel supported. Thank you to my boyfriend for brainstorming so many times and supporting me whenever you can. Thank you to all my friends at home and all the new ones I was allowed to meet during my stay here in Portugal. A very special “Thank you” goes to my grandpa for all the inspiring and valuable hours we spend, especially during the last months. Thanks for being the best grandpa I could image and for always being curios in what I am doing. “Last but not least” I want to
remember my everlasting companions for always taking care of me from wherever you are: my best friend Anton, my grandma Omimichen, my grandma Wilma and my great aunt Tante Trudi. You will always remain!
TABLE OF CONTENTS
ABSTRACT ... II SUMÁRIO ... III ACKNOWLEDGEMENTS ... IV TABLE OF FIGURES ... VII TABLE OF TABLES ... VIII TABLE OF APPENDICES ... IX GLOSSARY ... X
CHAPTER 1: INTRODUCTION ... 1
1.1 Background and Problem Statement ... 1
1.2 Aim & Scope ... 2
1.3 Research Method ... 3
1.4 Relevance ... 5
1.5 Dissertation Outline ... 6
CHAPTER 2: LITERATURE REVIEW ... 7
2.1 Segmentation & Targeting ... 7
2.2 Social Network Analysis ... 7
2.2.1 Social Network Sites ... 8
2.2.2 Instagram ... 8
2.3 Segmentation and Targeting on Social Network Sites ... 9
2.3.1 User-to-User Connections ... 10
2.3.2 User-to-Brand Connections ... 12
2.3.3 Brand-to-Brand Connections ... 14
2.4 Conclusion and Hypotheses Development ... 15
CHAPTER 3: METHODOLOGY ... 17
3.1 Research Approach ... 17
3.2 Research Design ... 17
3.3 Population and Sample ... 19
CHAPTER 4: RESULTS & DISCUSSION... 22
4.1 Segmentation ... 22
4.2 Targeting ... 25
CHAPTER 5: CONCLUSION AND IMPLICATIONS ... 27
5.1 Conclusion and Implications ... 27
5.2 Limitations & Future Research ... 28
REFERENCES ... i
TABLE OF FIGURES
Figure 1: Overview of research steps (own contribution) ... 4
Figure 2: Visualization of pre-defined segments on a random example (own contribution) ... 4
Figure 3: Visualization of targeting scheme on a random example (own contribution) ... 5
TABLE OF TABLES
Table 1: Mean and standard deviations of survey participants’ ratings for each attribute and exemplar (n=29) or focal brand (n=87). ... 22 Table 2: Chi Square test results for gender and biography differences between segments (p <
.05; n= 60 in each segment) ... 23 Table 3: Median scores from Kruksal-Wallis H-test for differences in <amount of following>
between segment (n=60 in each segment)... 23 Table 4: Fisher’s exact test results for differences of new followers between targeted samples
TABLE OF APPENDICES
Appendix 1: Product industries of selected brands ……… vii
Appendix 2 a: Questionnaire pre-test-survey (Example for Block 1) ……… vii
Appendix 2 b: Firm-generated posts used to represent brands within Block 2 & 3 ……….. xi
Appendix 3: Biography analysis ……… xiii
Appendix 4: Amount of follower from each brand ..……….… xiii
Appendix 5: Allocation to segments ……….... xiii
Appendix 6: Results Chi-Square tests and one-way ANOVA pre-test survey …………... xiv
Appendix 7: Results multiple Fisher’s exact Test for H1 ………... xv
Appendix 8: Results multiple Fisher’s exact Test for H2 ………... xvi
GLOSSARY
SNS: Social Network Sites SNA: Social Network Analysis FGC: Firm-Generated-Content
A: Users with a connection to focal brand & a connection to at least one exemplar within the set
B: User with a connection to focal brand & no connection to exemplar within the set of
C: Users no connection to focal brand & a connection to at least two exemplars within the
D: Users with no connection to focal & a connection to only one exemplar within the set.
CG: Control Group
A*: Friends of users within segment A B*: Friends of users within segment B UGC: User-Generated-Content
CHAPTER 1: INTRODUCTION
1.1 Background and Problem Statement
Arrived in the digital media age, there is little point for companies to avoid the Internet to interact with customers anymore. “Digital Marketing” is a concept that is not only increasingly crossing the minds of marketing managers, but also academic researchers’ and the public as well. One way to take advantage of ever-growing online audiences are Social Network Sites (SNS), such as Twitter, Facebook or Instagram (Ngai, Tao, & Moon, 2015). Both large and small companies are realizing that they should not imagine a marketing strategy without tweeting and posting (Weinberg & Pehlivan, 2011).
SNS are online social media platforms where customers and companies can create profiles and interact with each other (Wilcox & Stephen, 2013). From a company perspective, they constitute a great tool to interact with customers and deliver several services. For instance, through social networks brands can target, communicate and build relationships with both prospect and actual customers. They can create a brand persona, deliver a desired brand image and build brand communities (Ashley & Tuten, 2015; Kim & Ko, 2012; Mangold & Faulds, 2009). Likewise, users also have the chance to represent themselves in the web by following1
other brands and other users, or by liking, sharing, and commenting on their contents (Naylor, Lamberton, & West, 2012; Kaplan & Haenlein, 2010; He, Zha, & Li, 2013; Mislove, Marcon, Gummadi, Druschel, & Bhattacharjee, 2007). However, such interactions mainly occur in relation to entities customers perceive more similar to themselves (Naylor et al., 2012; Morry, 2007). When following a brand, users (henceforth also referred to as follower or fans) often identify themselves with it and try to express their individuality through its values (Knight & Kim, 2007). For instance, they use brand associations as a mean to construct their social selves and communicate it to others in their network, which are likely to share the same interests (Mcpherson, Smith-Lovin, & Cook, 2001; Berger & Heath, 2007; Bernritter, 2017). The resulting interactions lead to a complex network structure consisting of connections among users and brands.
Consumers’ growing use of SNS to interact with brands lends itself to the leveraging of valuable network-based data (Zhang, Bhattacharyya, & Ram, 2016; Culotta & Cutler, 2016).
Accordingly, researchers and marketing managers have begun to recognize the value of analysing these networks, as they offer a better and more in-depth understanding of information diffusion, product adoption and branding phenomena (Goel, Watts, & Goldstein, 2012; Goel & Goldstein, 2013; Zhang et al., 2016; Culotta & Cutler, 2016). Yet, to the best of the authors knowledge, there are very few studies investigating how such insightful user, user-to-brand and user-to-brand-to-user-to-brand connection data could be leveraged for targeting purposes (Zhang et al., 2016).
For instance, the affinity of SNS users to other brands with similar perceived attributes could be used to identify those more likely to engage with the focal brand2 and represent its image
better to others. Taking brand images into account to engage these users could help to increase and reach key audience segments, supporting the development of more effective communication strategies (Lipsman, Mudd, Rich, & Bruich, 2012). In addition, the secondary layer network – i.e. users who are indirectly connected to the brand through its followers - could be explored to identify and target prospects.
If tenable, this approach would also lend itself to the development and implementation of advanced targeting strategies for expanding and strengthening brand follower networks.
1.2 Aim & Scope
The main aims of this dissertation were to develop and test a market analysis method, grounded on key branding and Social Network Analysis (SNA) concepts, enabling brands to better segment and target potential audiences in SNS based on followers’ connections to other brands and users. This method is driven by the theoretical assumption that stronger, more actionable user networks (i.e. composed by more interested and engaged users) can be built around SNS pages when users’ affinity towards particular entities is taken into account. Affinity here is operationalized as relationship behaviour (i.e. network connections) with other users and brands, materialised when a user follows another entity or likes, comments on or shares its content (Provost, Dalessandro, Hook, Zhang, & Murray, (2009); Zhang, Bhattacharyya, & Ram, 2014; Culotta & Cutler, 2016; Bernritter, 2017).
Getting users to follow them on SNS is a first and crucial step for brands to create meaningful online interactions with customers and prospects. Yet, the importance of this step has not been fully acknowledged by contemporary academic literature. In view of this, the follow
relationship became the main object of the study in this dissertation, rather than more engagement related behaviours, such as liking, commenting or sharing (Ashley & Tuten, 2015).
In order to guide the method development, two main research questions were proposed:
R1: Can SNS users be adequately segmented by analysing their brand following behaviour? R2: Can the resulting segments be employed in defining effective targeting decisions to increase a brand’s follower base on SNS?
To answer these questions, empirical research was conducted with the support of VAN, a digital marketing agency in Lisbon, in cooperation with one of its clients that functions as the focal brand. The brand “BS” offers modern sunglasses and conveys a vintage, surfing and cool style. For confidentiality reasons, its identity cannot be disclosed. Research focused on the SNS Instagram because of its increasing popularity and relevance to both consumer and brands. So far, Instagram has pretty much fallen under the radar for marketing research, although it seems to be a promising tool for brands to set up communication strategies (Latiff & Safiee, 2015). In 73 weeks that “BS” Instagram page was live so far, it posted 89 firm-generated content (FGC) and built a network with 944 follows and 980 following relationships. The brand posts moderately, with a constant frequency of 1-2 posts per week. The user’s activity rate on posted pictures is rather low and differs within a range of 10-80 likes and an average of 3 comments.
1.3 Research Method
The research approach in this dissertation is twofold consisting, of a descriptive and an explanatory approach. It first undertook a descriptive approach to develop a segmentation method, based on connections to other brands to detect new target audiences (segmentation
study). Quantitative secondary data from Instagram and primary data (through the performance
of a pre-test survey) were collected at this stage.
In the second part, the dissertation undertook an explanatory approach aiming at testing differences when targeting the obtained segments (targeting study). To this end, primary quantitative data were collected through a targeting experiment on Instagram. Figure 1 depicts the steps of the research approach here undertaken.
One of the main tasks involved was the development of the following frameworks segregating users according to user-to-user-, user-to-brand, and brand-to-brand connections. These were based on SNA assumptions about the value of these different types of connections.
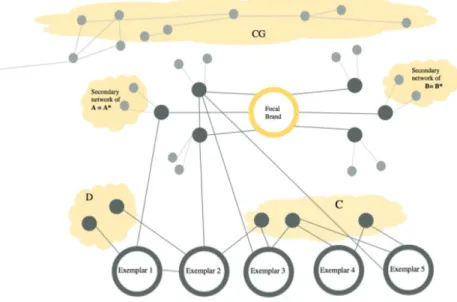
For the segmentation study, Instagram users were segmented based on their connection to brands that were closely related to the focal brand in terms of image (also referred to exemplars henceforth). This framework made use of user-brand connections that can give insight about a brands image (Culotta & Cutler, 2016) and brand-to-brand connections, that refer to overlapping users between exemplars. Subsequently, four pre-defined segments were created with users that have:
A: a connection to focal brand & a connection to at least one exemplar within the set; B: a connection to focal brand & no connection to exemplar within the set;
C: no connection to focal brand & a connection to at least two exemplars within the set; D: no connection to focal & a connection to only one exemplar within the set (Figure 2).
Figure 1: Overview of research steps (own contribution)
Figure 2: Visualization of pre-defined segments on a random example (own contribution)
The targeting study aimed to measure if and how different the obtained segments are interested in the focal brand. Since users within segment A and B are already connected to the brand, the approach additionally took advantage of secondary layer or amplification effects (user-to-user connections). Potential new customers may be found in the secondary layer of existing users (also called followers friends) who are already showing affinity to the focal brand. Therefore, the friends of followers in segment A and B were targeted, whereas followers within segment C and D were targeted directly (Figure 3). For the sake of clarity, friends of segment A and friends of segment B are labelled as A*, respectively B* in henceforth.
A control group (CG) including users with no connection to the focal brand & no connection to a brand within the set was added for comparative purposes.
1.4 Relevance
With growing costs to advertise to new customers, it becomes more and more important for brands to identify the prospects most likely to engage as a result of exposure to marketing campaigns (Iyer, Soberman, & Villas-boas, 2005; Luecke, 2006). As digital media technology advances and big data from social networks becomes easier to extract, marketing managers should increasingly leverage these for both strategic and tactical marketing purposes (Zhang et al., 2016).
Due to increasing diversity of users on SNS and their growing freedom to express their opinion, brands are forced to define their target audiences more accurately and determine how they want to present themselves to them in the social arena. (Pereira, de Fátima Salgueiro, & Mateus, 2014). Brand image enables users to express their identity and interests and should hence take increasing relevance in marketing activities, particularly in terms of managing customer relationships (Meenaghan 1995). User connections in SNS can provide insights about users’ brand perceptions and interests, enabling brands to reach out to people that could potentially be interested in them but have not yet recognized it (Culotta & Cutler, 2016; Atay & Kodaz, 2016; Zhang et al., 2016).
Making such connections more explicit should also strengthen users’ identification with brands, which is as an important determinant of engagement and long-term value in the form of future sales (Stokburger-Sauer, Ratneshwar, & Sen, 2012). Moreover, the follower base represents a brand’s image, so network or community management should focus on followers who reinforce the desire brand image and values with other audiences (Kuksov, Shachar, & Wang, 2013). All this ultimately translates into building stronger social networks for brands.
1.5 Dissertation Outline
Chapter 2 represents a review of contemporary literature in the fields of market segmentation and targeting, social network sites and SNA, from which the assumptions about the different segments derived. In chapter 3, the methodology used for data collection and analysis is described in detailed, while chapter 4 that provides the main results of this analysis. Finally, Chapter 5 summarizes conclusion, managerial implications, limitations and suggested directions for future research.
CHAPTER 2: LITERATURE REVIEW
This Chapter is dedicated to present the current state of academic research on relevant topics like segmentation and targeting, social network sites and connection patterns on social network sites. Conclusions are drawn in order to develop the hypotheses regarding the relevant connection types further analysed.
2.1 Segmentation & Targeting
According to Kotler and Keller (2012) target marketing requires three important steps: 1) identify and profile distinct groups (segmentation), 2) select one or more targets (targeting) and 3) communicate distinct offer benefits to each group (positioning). Marketing segmentation refers to the process of separating the market in groups of homogenous customers, thereby providing a better understanding of meaningful differences in consumer needs and behaviour between different groups (Smith, 1956; Shapiro & Bonoma, 1984; Kotler & Armstrong, 2010). Firms should target different groups of consumers with appropriate marketing actions, since they can rarely satisfy everybody with the same offer (Wedel & Kamakura, 2012; Kotler & Keller 2012). Appropriate targeting can help firms to reduce advertising expenditures in terms of money and time and improve advertising effectiveness (Iyer et al., 2005). In this sense, market segmentation become an important tool in marketing planning and is an essential pre-step to precise targeting and positioning, thereby creating value to both consumers and firms (Sharma & Sheth, 1995; Wedel & Kamakura, 2012). Segmentation is traditionally based on geographical, demographical, psychographic and behavioural variables (Kotler & Armstrong, 2010; Kotler & Keller 2012). Marketing managers consider the latter as best starting point for optimal market segmentation. The usual way to segment based on these variables is by analysing the customers purchase- and buying-behaviour such as their preference for, use of or response to a product (Kotler & Armstrong, 2010).
2.2 Social Network Analysis
In the past, increasing interest to study social networks has emerged in physical and social sciences, yielding interesting findings for a wide array of disciplines such as psychology and economics to explain social phenomena. SNA can shed light on how autonomous actors can build functioning networks through interactions and relations to each other (Borgatti, Mahra, Brass, & Labianca, 2009). These actors represented as nodes, can either be countries, people, companies or other organizations (Borgatti & Li, 2009). Actors are connected, or linked, to
each other by a set of ties (i.e. interactions) that can differ in strength and characterize their relationships (Borgatti & Foster, 2003; Borgatti & Li, 2009; Merchant, 2009). Offline social networks such as social fabrics of cities have been studied for a long time, but with the beginning of the internet, internet-mediated social networks (e.g. via email contacts) and, in particular, SNS are attracting the attention of marketing researchers (Borgatti et al., 2009; Mislove et al., 2007; Boyd & Ellison, 2007).
2.2.1 Social Network Sites
SNS such as Twitter, Facebook and Instagram, are becoming part of the ordinary life for millions of people (Boyd & Ellison, 2007; Latiff & Safiee, 2015). According to Boyd and Ellison (2007, p. 222), SNS can be defined as “web-based services that allow individuals to
create a public or semi-public profile within a bounded system”. Profiles are personalized
pages where users can display their interests and demographics and optionally upload profile pictures. Afterwards, they can join virtual communities based upon a common interest, by connecting to other users in the same or other SNS (Heinrichs, Lim, & Lim, 2011). These connections, or ties, are often labelled as becoming a “fan” or a “follower” of another user or entity (Boyd & Ellison, 2007). Companies take advantage of SNS by, among others, creating “fan” pages for their brands, where they post own content (aka FGC or firm-generated content, as opposed to UGC or user-generated content) and interact with their customers for branding or advertising purposes (De Vries, Gensler, & Leeflang, 2012). In this way, networks are not only built and maintained for social but also for commercial purposes (Trusov, Bucklin, & Pauwels, 2009).
Thus, SNS function as platforms for interactions between brands and users, where opinions, information and content can be created and shared among them (Heinrichs, et al., 2011; Mislove et al., 2007). According to Zhang, et al. (2014), user-to-brand network interactions can be either explicit–established merely by “following” relationships, or implicit, when users share common interests and brands have overlapping users.
2.2.2 Instagram
Next to popular and well established SNS providers, like Facebook or Twitter (Heinrichs, et al. 2011), the SNS Instagram is getting more and more attention from both users and brands. It is a smartphone application where users or brands can create an account to like, comment or share photos or videos with the social community (Lee & Lee, 2015). Users can follow others (aka “following”) and/or be followed by others (aka “followers”). In a section called “Biography”
users can leave short notes on what their interests are (Instagram, 2017). Instagram was created in 2010. Since then it has risen in popularity not only because of increasing usage of smartphones by young customers but also because of its creative and simple characters (Abd, Ayuni, & Safiee, 2015). Nowadays it has more than 700 million monthly active users (Fox Business, 2017). Due to the fact that pictures speak louder than words, Instagram, as a photo-sharing platform, seems to be a promising tool for branding purposes, delivering emotions and images (Lee & Lee, 2015). Advertisement on Instagram can look different from other social platforms such as Facebook. To attract the interest of potential users on Instagram, brands can send users a friend invitation to make aware of it. If the user is interested and likes the content of the brand, he or she can send a friend invitation back and a mutual following connection occurs (Latiff & Safiee, 2015). From the customer perspective, the followed brand shows up in the daily newsfeed and the customer will always stay informed about the content the brand posts. From the brand perspective one more potential customer entered the network.
2.3 Segmentation and Targeting on Social Network Sites
With evermore consumption activities taking place online, from ad exposure to e-WOM and online shopping, firms are increasingly feeling the need to take online behaviour into account to segment their customers, on one hand, and to their audiences of online prospects on the other. After a first stream of studies on online segmentation based on buying behaviour (e.g. e-commerce), marketing researchers began to consider online interactions, particularly social network behaviour on SNS, as a valuable tool to identify new groups of prospects (Campbell, Ferraro, & Sands, 2014; Zhang et al., 2016). One way to segment users based on their SNS behaviour is to scan profiles in order to get freely expressed demographic and geographic information about them and their followers (Montgomery & Chester, 2009; Zhang et al., 2016). Another way is to make use of self-reports to understand the drivers and main characteristics of users’ SNS interactions, such as motivations, activity level, reactivity to onsite marketing initiatives and user-generated content, among others (Campbell et al., 2014; Zhang et al., 2016).
Indeed, to fully acknowledge user heterogeneity in targeting activities, it may be helpful for brands to understand their underlying motivations to use social media. In a survey conducted in 2008 with 2471 Canadian students (aged 18-30), Foster, West, and Francescucci (2011) identified four meaningful segments depending on information sought and willingness to get involved: “Social Media Technology Mavens”, “Minimally Involved”, “Info Seekers” and
activity level. Alarcón-del-Amo, Romero-Lorenzo, and Gómez-Borja (2011) collected a sample of 399 out of Internet users between 16 and 74 years old during March and April of 2009 to classify them according to the frequency with which they perform different activities on SNS, among others. After applying a latent segmentation method they uncovered four different segments: “Introvert User”, “Novel User”, “Versatile User” and “Expert-Communicator User”. Conclusions drawn from this segmentation scheme are valuable for brands seeking to identify potential opinion leaders and social media influencers.
More recently, Campbell et al. (2014) proposed a method to segment online consumers (N=883) by analysing their responses to marketing activities. In an online survey respondents were asked to react to visual stimuli of Twitter campaigns for two different companies. Out of five identified segments through latent-class analysis - “Passive”, “Talkers”, “Hesitant”, “Active” and “Averse” - it was found great evidence that the “Actives” and the “Talkers” had a higher impact on brand engagement, purchase intention and WOM.
In another stream of segmentation research, marketers began to track brand-related, user-generated content, such as comments or offer reviews and ratings as a promising means of identifying meaningful consumer groups to target (Montgomery & Chester, 2009). According to Riegner (2007) users can be meaningfully grouped based on how they express their voice online. In a survey with 400 broadband users, conducted in July 2006 in the United States, the authors found five segments - “Online insiders”, “Content Kings”, “Fast Trackers”, “Social Clickers” and “Everyday Pros” - whom presented important differences in terms of WOM content. They identified the first segment as the most influential, with a tendency to grow considerably in the future.
However, so far little research has been done to segment users based on interaction behaviour emerging from connections in SNS, particularly Instagram. For the purpose of this dissertation it is helpful to look at some characteristics of how networks are build and review literature that exists about three different connection types between 1) users and user, 2) brand and user or 3) brand and brand.
2.3.1 User-to-User Connections
One of the core concepts in SNA is that of homophily (Mcpherson et al., 2001). That is the idea that people’s affinity to each other is a function of how similar to each other they perceived to be, in terms of socio-demographic, behavioural, and/or intrapersonal characteristics (Mcpherson et al., 2001; Morry, 2007, Naylor et al., 2012; Wallace, Buil, & De Chernatony, 2014). This leads to the creation of rather homogeneous social networks, composed of fairly
like-minded people (Mcpherson et al., 2001). This concept, that finds its root in classic, offline social network theories of how children build their friendships, has been recently adopted to analyse user-to-user and user-to-brand relationships in SNS (Bott 1928; Wellman, 1926; Mcpherson et al., 2001; Culotta & Cutler, 2016). In the context of homophily, friends of followers – the so called secondary layer, amplification or megaphone effects – have been studied as this provides a great chance for marketing managers to acquire and engage with new followers (Lipsman et al., 2012; John, Emrich, Gupta, & Norton, 2017). The interest in analysing the secondary layers of social networks originates also from studies of information diffusion (WOM), opinion leadership and influence and adoption of new products or technology (De Bruyn & Lilien, 2008; Bakshy, Eckles , Yan, & Rosenn, 2012; Hill, Provost, & Volinsky, 2006). The phenomenon of e-WOM is widely studied in marketing research where the similarity of users also plays an important role (De Bruyn & Lilien, 2008). Earlier SNA research (Brown & Reingen, 1987) showed that information flowed better through strong and homophilious ties, such as those occurring between people with very similar socio-demographic profiles. This is important to explain WOM by addressing the characteristics of the social relationships from which this type of phenomena emerge (Brown & Reingen, 1987). In two field experiments on Facebook, conducted during a short period in 2011, with a random sample (N=23,350,087) of Facebook users, Bakshy et al. (2012) calculated a cue-response function, where the relationship between numbers of received social signals and ad responses (measured in clicks) was calculated. They uncovered that advertised users with stronger ties to an affiliated advertised peer reacted with higher click rates to an ad. This result also suggests that characteristics of users may be predictable by analysing those of their SNS peers.
User homophily has also has been analysed in the context of product adoption (Hill et al., 2006; Goel & Goldstein, 2013). Hill et al. (2006), for instance, showed strong evidence that potential new customers can be detected within the secondary network layer of existing users, who otherwise would not have been identifiable through traditional segmenting methods. They uncovered that network neighbours of people that adopted a telecom service are 3-5 times more willing to adopt the same service than others. Other studies have also concluded that friends of users who endorsed a product by purchasing it, were more likely to buy than users without any connection to the brand. (Oestreicher-Singer & Zalmanson, 2013).
To sum up, prior research offers good reasons to believe that homophily can lead to positive effects on social endorsement. Secondary layer effects turn out to be of practical importance for brands and can help target audiences that are most enticing (John et al., 2017).
Nevertheless, to acquire the right prospects within the secondary network layer, brands have to understand their core customers. It is important to understand that not all followers have the same value and might be very heterogeneous in the way they identify and engage with a brand (Lipsman et al., 2012; Wallace et al., 2014). This motivates the idea to leverage also on user-to-brand connections. These can shed light into how consumers perceive a user-to-brands image and consequently hints to customer’s interests (Culotta & Cutler, 2016). By considering how users are connected to other brands, marketing managers are more likely to reach potentially profitable audiences (Lipsman et al., 2012).
2.3.2 User-to-Brand Connections
Affinity, as earlier described, applies both to user-to-user and user-to-brand connections in social networks (Kuksov et al., 2013). A connection with the brand emerges when users endorse it (aka: becoming a follower) by clicking the “follow” button of a fan page where they can later like, share or comment on branded content (Nelson-Field, Riebe, & Sharp, 2012; Bernritter, 2017). This type of interaction behaviour expresses users’ affinity with and interest in a brand (Lipsman et al., 2012; Culotta & Cutler, 2016).
The main natural reasons for users to become brand followers in SNS are preference and loyalty (Pereira et al., 2014). However, social identification is also often an important motivation for engagement. Prior studies have shown that customers use brands to construct and present their identities to other users in the digital world (Belk, 1988; Escalas, 2004; Berger & Heath, 2007; Chernev, Hamilton, & Gal, 2011; Hollenbeck & Kaikati, 2012; Belk, 2013). Indeed, there is evidence of a strong relationship between a brand’s image and the characteristics, and identities, of its follower or fans (Sirgy 1985; Escalas & Bettman, 2003; Kuksov et al., 2013; Culotta & Cutler, 2016). Brand image is here understood as a set of functional, intangible attributes, such as modern, youthful or traditional, which go beyond tangible and beneficial ones, like price or quality perceptions (Sirgy, 1985; Chernev et al., 2011).
Prior research by Berger and Heath (2007) examined the role of brands as a means for customers to express their identities to others. By conducting four experimental studies, they collected data through a Web survey from 202 participants across the United States about how choices of users to participate in SNS can signal identity. Users tend to infer the taste of other users within a social group to avoid signalling undesired identities. Results have shown that users rather diverge in symbolic product domains that others use to express identities such as music or cosmetics. Hollenbeck and Kaikati (2012) observed the SNS activity of 84
volunteering Facebook users from different ethnicities, namely Caucasian, African-Americans, Asians and Hispanics to study how they introduce the brands in their interaction with others in this SNS. During a two-year research period they employed multiple methods, such as observational research, diaries, focus groups and interviews. Overall, results showed that Facebook represented a true media for users to express both their actual and desired selves. Hence, they consequently chose to relate to brands that were congruent with the attributes of their own identities.
Identifying those who are likely to be interested in the brands attributes can bring several advantages. On the one hand, customers who choose brands that fit to their personal identity are more likely to engage with them (Govers & Schoormans, 2005; Escalas, 2004). According to Stokburger-Sauer, et al. (2012) this will lead to increased brand loyalty and advocacy in the long-term. With recent SNS development, the latter is becoming more and more important. Brands want to make advantage of users’ habit, wanting more and more to engage them to “spread the word” (Van Doorn et al. 2010). On the other hand, due to high visibility on SNS, besides active WOM, more silent users can equally influence how others may perceive a brand through their “mere virtual presence”, that is by simply liking or following a brand (Naylor et al., 2012). In this way, not only users express their selves through brands but the reverse also occurs.
A brand’s follower base also somehow represents its image; people may prefer them dependently on who else belongs to the fan group (Berger & Heath, 2007; Kuksov et al., 2013). This totally changed how brand identities are created as customers are being actively involved in the process (Muniz & Thomas, 2001). Self-expressive attributes of a brand are now set and projected by the people who are using it and are not under a firms control anymore (Kuksov et al., 2013). Brands can become cool because of social groups considering it as cool (Berger & Heath, 2007). Sometimes a product can become special by the group of people who is using it (Aral & Walker, 2011). Good examples in modern times are Timberland, GoPro or RedBull that were converted to “fashion and identity statement” by the people who used and communicated about them (Kuksov et al., 2013).
Therefore, it is very important for a brand to have people in the network that identify with it and are good representative of the brand’s image to others. Taking into account how potential customers perceive a brands image in respect to specific attributes may give insights about their interests. By developing an original Twitter network mining methodology, Culotta and Cutler (2016), studied how connection of users to other brands than a focal one can shed light into
detecting overlapping customers of similar brands can bring useful insights for marketing and branding purposes. After defining a set of exemplars, they calculated the intersection of customers by using an empirically successful similarity function, namely “Jaccard Index”. Furthermore, they incorporated they intuition that an exemplar with more followers should be weighted less and came up with a weighted social perception score: the higher this score, the more a brand is associated with a specific attribute. Their method was validated through the performance of a large survey, where 500 participants rated each brand with respect to different attributes on a scale. Other than traditional brand rating methods, they were the first to infer brand images with the help of follower overlaps between the focal brand and a set of brands representing those same attributes.
2.3.3 Brand-to-Brand Connections
The detection of overlapping communities is getting increasing attention by marketing researchers (Rees & Gallagher, 2010; Jebabli, Cherifi, Cherifi, & Hamouda, 2015; Atay & Kodaz, 2016). Building on the idea that nodes can belong to more than one community, a recent study by Atay and Kodaz, (2016) attempted to answer the question of “where a brand ends”. They showed that overlapping communities also exist on complex marketing co-purchasing networks such as Amazon and developed an algorithm in order to detect them. Users that are not following the focal brand yet (neither direct nor indirect), but rather brands within a set of closely related ones, can also be a promising field to find prospects. It may be, that they are interested in the style but have not yet realized the focal brand.
The main features of such SNS structures were analysed by Zhang et al., (2014) by conducting a Facebook experiment designed based on a large database of user activities. This provided a unique view on the relationships between brands by aggregating consumers’ overlapping interests. Two years later, same authors built upon this work about brand-to-brand connections to find target audiences for online advertising. They provided a framework about how to find audiences of interest, based on connections to brands that were closely related to a focal brand. In a four-step framework where they 1) extracted and normalize brand-to-brand networks, 2) found a set of closely related brands by using a hierarchical community detection algorithm 3) identified most influential brands and 4) identified target audiences. However, they define closely related brands by analysing community structures and by using node degree measurements work and not with brand image as this work does. Hence, their findings lack valuable marketing implications (Zhang et al., 2016).
The studies mentioned above are rarely marketing focused and lacking on concrete managerial implication for targeting and branding purposes. So far, rich data sources emerged from interaction behaviour on SNS, but there were rarely talen into account for strategically marketing decisions.
2.4 Conclusion and Hypotheses Development
Getting a better understanding of user behaviour in SNS and its underlying motivations is an important first step for successful segmentation and targeting (Goel & Goldstein, 2013).
However, most studies are typically based on self-reports and limited to users that are actively participating in SNS and self-select to answer surveys (Zhang et al., 2016). From a more macro-network viewpoint, where marketing can be understood as the interaction between many social actors, it is essential to analyse all social connections, preferably in a revealed, rather than a declared format (Bagozzi, 1974; Muniz, & Thomas, 2001). Market segmenting based on relationship behaviour is about identifying strong networks involving highly engaged people, who represents a brand’s desired image better and are therefore more long-term oriented (Kuksov et al., 2013). Unlike most prior research, this dissertation intended to leverage on rich data emerging from relationship behaviour in SNS. Therefore, users were segmented based on “follows” to other entities (i.e. connections to other users and brands), in a novel approach. Although some researchers already investigated these fields, little has been done to combine all these valuable insights emerging from the different types of network connections.
The developed framework for the segmentation and targeting process (Figure 2 and 3) was motivated by many studies in the field of social science , implying that proximity in a network is an indicator of similarity (Mcpherson et al., 2001; Culotta & Cutler, 2016). After segmenting the users based on their connection to other brands, this dissertation aimed to test whether there are differences in effectiveness – measured in brand page followers- when targeting the obtained segments or as earlier explained, the friends of the obtained segments. Taking the affinity into account allows a brand to identify likely interested audiences.
Through the lens of homophily, potential new fans were expected to be found in the secondary layer of existing users that already showed affinity to the focal brand (Mcpherson et al., 2001) which led to the first hypothesis:
H1: Targeting B* will lead to a higher increase in followers on the focal brands Instagram page than targeting users within CG.
Users seem to be more willing to engage with the brand when they have interest and like the image or style in order to express their selves in the social web. Due to the fact that fans like a brand in order to express their interests (Culotta & Cutler, 2016; Zhang et al., 2016; Bernritter, 2017) targeting the secondary layer of existing users who already showed affinity to the exemplars, is expected to be even more effective. Consequently:
H2: Targeting A* will lead to a higher increase in followers on the focal brands Instagram page than targeting users within B*.
In addition, discovering overlapping users between those closely related brands may also identify potential new fans who are neither indirectly nor directly connected to the focal brand yet (Zhang, et al., 2016). Consequently:
H3: Targeting segment C will lead to a higher increase in followers on the focal brands Instagram page than targeting users within CG.
To sum up, this work not only contributes to research for strategical marketing decisions on Instagram but also provides insights on how valuable insights emerged from different types of connections can be used for targeting purposes.
CHAPTER 3: METHODOLOGY
This Chapter presents the research approach used for the data collection and analysis in order to answer the proposed research questions.
3.1 Research Approach
Three main types of research approaches can be defined: exploratory, descriptive and explanatory (Aaker, Kumar, Day, & Leone, 2010). An exploratory approach aims to discover and explain new and complex phenomenon. On the other hand, descriptive research provides a detailed snapshot of an existing and known phenomenon. Lastly, exploratory research is undertaken when it is necessary to uncover causal relationships and enough theoretical knowledge is available to formulate testable hypotheses (Saunders, Lewis, & Thornhill, 2009; Aaker, et al., 2010).
This dissertation aims at segmenting users based on relationships and testing whether the obtained segments react differently to targeting activities. Consequently, the first part undertook a descriptive approach where SNS users are characterised, in order to find possible segments based on relationship behaviour. This segmentation study was based on secondary and primary quantitative data. Meanwhile, the targeting study undertook an explanatory approach where hypotheses regarding targeting effectiveness across segments were tested. In order to do so, quantitative primary data was gathered through the performance of a targeting experiment on Instagram.
3.2 Research Design
Since the foundation for the segmentation approach requires a set of brands that are strongly related to the focal brands core attributes, the segmentation study is divided into three phases:
pre-test survey, segmentation process and profiling.
The focal brand aims to be associated with the attributes “vintage” and “surfing” by its current and potential Instagram audiences (personal communication, 2017). Other attributes, like “cool”, “trendy” and “young” are also relevant but less prioritised. In order to find other “vintage” and “surfing” brands, the first step was to identify brands the followers of “BS” are following. This was done through the analysis of secondary data on Instagram. Given that no program was available to automatically extract these data, this was done manually into an Excel sheet, for the period between the 10th and the 14th of April 2017. However, only data
relationship3 with the focal brand could be extracted. This analysis resulted in a set of 50
brands which were identified as closely related to both “surfing” and “vintage” attributes, according to the author’s judgements or brand-generated content on Instagram. The set also comprises brands of unrelated product categories, as they may still convey the same image (Chernev et al., 2011; Atay & Kodaz, 2016). The obtained set was subsequently reduced into a sub-set of 20 brands that also fulfil the criteria of being Portuguese and having more than 30 common followers with the focal brand (Appendix 1).
The sub-set was further refined and validated through the collection of primary data by conducting a pre-test survey. It was conducted through Qualtrics and distributed online mainly among students currently living in Portugal from the 14th until the 25th of April, 2017
(Appendix 2 a, b). In the survey, participants were asked to evaluate the brands on attributes “surfing”, “vintage”, “cool”, “trendy”, and “young”, using an attribute rating method on a numeric scale (Dolan, 2001). Participants were exposed to firm-generated posts from each brand’s Instagram account and asked to rate them in respect to the identified attributes on a scale from 0 (doesn’t describe it at all) to 10 (describes it completely). In order to avoid decreasing attention in the answers, three blocks were designed to which the 20 pre-selected brands were randomly assigned. Consequently, each participant was randomly exposed to only one block consisting of 7-8 questions, in which they rated the focal brand plus 6-7 sub-set brands. Participants also provided their gender, nationality and age.
For the segmentation process, the follower networks of the 5 exemplars finally obtained, “DCK”, “Fora Sunglasses”, Surfin Portugal“, “Ericeira Surf & Skate” and “Vintage Bazaar” and the focal brand were extracted from Instagram. This was done automatically by adapting a program called picodash. This is an advanced tool designed for social media manager to, among others, search photos by hashtags, search locations with tagged posts or sort users by like counts (Picodash 2017). The dataset was provided in an Excel file and consisted of <username> and <ID> and further information about all followers such as <biography notes>, <media content> (amount of photos they posted), <amount of followers> and <amount of following>. The datasets from all brands were extracted on the 25th of April.
To profile the obtained segments, the number of other users and brands a user follows <amount of following> and gender (female/ male or neutral4) were tailed, as wells as the keywords and
emojis, used in the (<biography>) to display personal interests in Instagram. The former was obtained from the dataset extracted by picodash whereas genders were identified by checking
3 The brand follows the fan as well 4 If gender was not identifiable
the <fullnames> that were provided by picodash, or reviewing the profile manually in doubtful cases. Within the latter, only 5 categories were taken into account in view of the attributes under study: “Surfing”, “Portugal”, “Fashion” and “Summer”. An extraction of how the categories were created is provided in Appendix 3. Number of users’ followers and posting activity information was not taken into account as it seemed less related to research aims.
In order to test hypothesis 1 and 2 within the targeting study, users within the secondary layer (i.e. A* and B*) were targeted. To test hypothesis 3, users from segment C and D were targeted directly. Users were targeted by sending them a friend invitation. The users were targeted on the 9th of May by receiving a friend invitation from the focal brand on Instagram. Since most
users are online on Instagram on a daily base, one week seemed appropriate to let them react (Smith, 2016). To execute a pre- and after-network analysis, the network of the focal brand was extracted once more with the program picodash after the targeting experiment was finished on the 16th of May 2017. Since the “following back” of a user is an indicator for interest, the
mechanism to measure a user’s interest is defined as the action of targeted users to become a follower of the brand. Therefore, the increase of brand page followers operates as the variable to measure effectiveness.
3.3 Population and Sample
For the pre-test survey, the population was defined as Catolica-Lisbon MSc students, as these are part of the focal brand’s target audiences and mostly have an Instagram account. The survey was administrated through Qualtrics. Over 109 participants were recorded, of which 22 did not provide complete surveys (n=87). Each exemplar was assessed by 29 participants while the focal brand was assessed by the complete sample. Over 87% of participants were aged between 18 and 35, ca. 53% were female and ca. 45% were Portuguese nationals.
For the segmentation process, the population was defined as all followers of the focal and exemplar brands at the 25th of April (N=61944 users) (Appendix 4).
Due to practical limitations, to profile the segments only randomly selected sub-samples of 60 users from each segment were identified. Random selection was performed in a random number generator.
Profiled sub-samples of C and D were targeted by sending them a friend invitation on Instagram directly. To target A* and B*, new samples of 60 followers from profiled
sub-users without any connection to the focal brand and exemplars was manually complied, that functions as the control group (i.e. CG). This was done manually, using hashtags unrelated to the focal brand’s attributes or products were used, such was #luxury, #rock, #fado.
3.4 Data Analysis
Since the pre-test survey was split into three blocks it was determined if there were no significant differences in socio-demographic variables across the independent groups of survey participants evaluating the brands attributes. Chi-Square tests were used for the variables gender and nationality using Crosstabss. A one-way ANOVA was conducted to determine significances in age since data were normally distributed, as assessed by Q-Q Plot. There were no outliers in the data, as assessed by inspection of a bloxplot for values greater than 1,5 box-lengths from the edge of the box. Next, descriptive statistics of attribute ratings for each brand were calculated. Only the attributes “surfing” and “vintage” were analysed and compared. On one hand these two attributes performed the highest mean and lowest dispersion compared to the other three attributes: “cool”, “trendy” and “young”. On the other hand, they were not core of the brands image and more difficult to identify. Brands with mean ratings similar to the focal brand and small rating dispersion were selected for the further segmentation process.
In order to segment the followers based on their relationship to the selected brands, they were allocated to the pre-defined segments by adapting several VLOOKUP and SUM formula in Excel. To make connections visible, data per user was structured by creating dummy variables (0= not connected to the brand, 1= connected to the brand) for each brand. In order to do so, common users were detected by calculating intersections between two sets of each brand Fi (all
followers of brand i) and Fj (all followers of brand j). This was done between all brands; FBS,
FsurfinPortugal, FDCK, Fvintagebazaar, FericeiraSurf&Skate and Ffora by adapting the “VLOOKUP formula” to detect
overlapping followers between the brand networks. Consequently, segments were created by allocating the followers to A, B, C, D, by adapting several SUM formula in Excel (Figure 4) (Appendix 5).
To validate and profile the segments obtained, Chi-Square or Fisher’s exact tests of the distributions of gender and biography across the four segments identified were conducted. Since observation for the <amount of following> were not normally distributed, as assessed by Q-Q Plot, non-parametric Kruskal-Wallis H-Test were conducted for this variable.
The number of users targeted in A*, B*, C, D and CG that reacted positively to the Instagram invite and started following the focal brand was tailed in Excel using a VLOOKUP formula by comparing the post and pre extracted network. Statistical inference tests for proportions of new followers across segments were done in SPSS. With 9 expected cells counted less than 5, Fishers’s exact test (2x5) using Crosstabs procedure was conducted. In order to answer the proposed hypotheses, a post-hoc test was used by conducting multiple Fisher’s exact test (2x2) with Bonferroni adjustments for pairwise comparisons.
CHAPTER 4: RESULTS & DISCUSSION
This chapter represents and discusses the results from the analysis of the segmenting study and the targeting study.
4.1 Segmentation
There were no significant differences in socio-demographic variables across groups of the
pre-test survey participants who evaluated attributes from a sub-set of exemplars and the focal
brands (Appendix 6).
Table 1 presents the results from of the brands’ ratings on attributes.
Table 1: Mean and standard deviations of survey participants’ ratings for each attribute and exemplar (n=29) or focal brand (n=87).
In view of these results, “Surfin Portugal”, “Vintage Bazaar”, “DCK Boardshorts”, and “Ericeira Surf & Skate” were selected for further analysis. However, from a strategically perspective “Fora Sunglasses”, as a direct competitor of the focal brand, has been included in the set despite a higher spread in data (SD= 3.6).
Out of 61944 followers from all brands that were allocated to the pre-defined segments, ca 2% (n=1300) belonged to segment A, 0.6% (n=428) to segment B, 17% (n=11774) to segment C and 80% (n=55619) to segment D.
Brand Attribute Mean ± SD
“BS” „surfing“ 7.7 ± 2.8
„vintage“ 8.5 ± 1.8
Vintage Bazaar „surfing“ 8.0 ± 2.0
„vintage“ 8.5 ± 2.0
DCK Boardshorts „surfing“ 8.3 ± 1.7
„vintage“ 8.3 ± 2.2
Ericeira Surf & Skate „surfing“ 9.0 ± 1.6
„vintage“ 8.3 ± 2.4
Surfin Portugal „surfing“ 9.3 ± 1.6
„vintage“ 8.8 ± 1.6
Fora Sunglasses „surfing“ 7.2 ± 3.6
Resulting from the analysis to profile the sub-sample of segments, there was statistically significantly difference in proportions in gender between the segments, as assessed by Chi-Square test with p < .05. The results from the Chi-Chi-Square tests for the different biography categories showed different results. There were only statistically significantly differences between the groups for “Surfing” and “Fashion” and “Vintage”, compared to other two categories “Portugal” (p = .410) and “Summer” (p = .383). Therefore, the last two were not considered in the later discussion. Between the segments there were statistically significantly differences for “Surfing” and “Fashion” with p < .001, as assessed by Chi-Square tests and for “Vintage” p < .05, as assessed by Fisher’s exact test. Table 2 depicts the proportion of users in the segment sub-samples profiled per gender and biography category. Note that the biography values do not add up to the total sub-sample size 60, since not all of them make use of the biography section.
Table 2: Chi Square test results for gender and biography differences between segments (p < .05; n= 60 in each segment)
Segment A B C D χ2 p
Gender (in amount of user)
Female 36 29 19 32 15.035 < .05 Male Neutral 17 7 19 12 31 10 24 4 Biography (in amount of users who used category related words)
“Surfing” 19 4 31 21 28.916 < .001
“Fashion” 2 23 4 5 39.063 < .001
“Vintage” 0 0 6 4 < .05
The distribution of the third descriptor <amount of following> were statistically significantly different between the segments, χ2 (3 )= 22.744, p < .001, as assessed by Kruskal-Wallis
H-Test. The median scores for each segment are provided in Table 3:
Table 3: Median scores from Kruksal-Wallis H-test for differences in <amount of following> between segment (n=60 in each segment)
Segment A B C D
Based on that, segment A was named the True-Image-Lovers, as users in it, follow a
relatively low number of other users or brands compared to B and D. Since it can be assumed that the fewer the amount of following relationships a user has, the stronger the source of evidence that they are truly interested in those they are following. They seem to be rather selective and only follow brands they truly like its image (Culotta & Cutler, 2016). This was also supported by analysing their biography content in which most of the users express affinity to the brand related attribute “surfing”. Compared to segment B, most users expressed their affinity to the brand related attribute “surfing” with words like “surferboy” or wave emojis. Users within A differ to C in terms of gender, since they are mainly female.
Segment B users were named the Fashion-Seekers, as they followed a relatively high number
of entities in Instagram compared to segment A and C. Referring to the assumption mentioned above, it seemed that they are rather generalists in their interests. According to the information in their biographies, they seemed to have the lowest (relatively speaking) affinity with the core focal brand attributes “surfing” and “vintage”. As many users within the segment represent their selves with attributes such as “fashion” or “moda”, they seem to be more interested in the product itself (sunglasses) and want to be always updated about the fashion trends. Other than segment C, most of them are female.
Segment C was named Hidden Treasures since its users showed relatively high affinity with
core focal brand attributes. They consisted of people describing themselves as “surferboys” “surfteachers” and “surfinglovers”, and often used words “vintage” to express other interests. Above, they followed the lowest number of other users or brands on Instagram. Interestingly, compared to segment A and B, users in this segment were mainly male with 51% compared to 31% female users.
Lately, segment D consisted of users following only following one of the selected brands, being the largest one and having the largest amount of following relationships. Next to surfing related activities, they also used words and emojis from different categories to the same extent. However, in terms of gender, they differ to segment C with more females than males. Due to the high variety and diversity in the users’ interest this segments was called Intangibles.
According to Wedel and Kamakura (2012), segmentation can only bring strategically value to a brand if the segments are identifiable, sustainable, accessible, stable, responsive and actionable. Results show that segments of users could be identified based on Instagram connections and profiled by informative descriptors, such as <amount of following>, <biography> and <gender>. Importantly, all of them differed from each other in at least one descriptor. Moreover, all segments represent a large enough audience for brand managers to potentially
invest in. Above, since the users differ fairly in interests and gender, it is possible to formulate implications that help brands to implement a distinctive marketing mix for each of them. Since the segments were stable enough for the period of testing, also the last criteria can be fulfilled.
4.2 Targeting
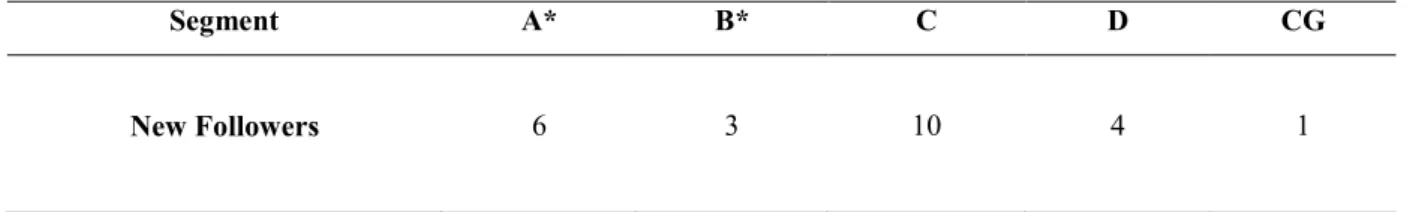
Six users from A* followed the focal brand back, compared to three users from B*, ten users from C, four users from D and one user from CG. Proportions of new followers were significantly different at p < .05, as assessed by Fisher’s exact. An overview is provided in Table 4.
Table 4: Fisher’s exact test results for differences of new followers between targeted samples (n = 60 in each sample)
Segment A* B* C D CG
New Followers 6 3 10 4 1
However, to test the provided hypotheses, each relevant pairs were compared.
Results from testing hypothesis 1, (comparison of proportions between new followers from B* and CG), demonstrated that there was no statistically significantly difference with p =.619. Post hoc analysis involved pairwise comparisons using multiple Fishers exact tests (2x2) with a Bonferroni correction. Statistical significance was accepted at p < .016667 (Appendix 7). Therefore, H1 was rejected. Targeting users in the secondary network without considering existing users’ connections to other brands, didn’t show statistically significant results.
Also, results from testing hypothesis 2, (comparison of proportions between new followers from A* and B*), have shown that there was no statistically significantly difference with p=
.491. Post hoc analysis involved pairwise comparisons using multiple Fishers exact test (2x2)
with a Bonferroni correction. Statistical significance was accepted at p < .016667. Therefore, H2 was rejected. However, in order to detect whether it was more successful than targeting B*, responses from A* where also compared to CG. There was no significantly difference, with p =
.114 as assessed by Fisher’s exact test. However, with a value closer to significance p = .114 < p = .619 it is noticeable that there are tendencies of more success when targeting A* than B*
(Appendix 8).
At the conclusions of testing hypothesis 3, (comparison of proportions between new followers from C and CG), there was a statistically significantly difference with p < .01667. Post hoc
analysis involved pairwise comparisons using multiple Fishers exact tests (2x2) with a Bonferroni correction. Statistical significance was accepted at p < 0.016667. Therefore, H3 was confirmed (Appendix 9).
Identifying users within the secondary layer without any further consideration, such as their connections to other brands, brings the lowest return in terms of increase in page followers on a brand’s Instagram account. Taking users affinity to brands with a similar image into account turned out, on the other hand, to be a reasonable approach when making targeting decisions. There were tendencies apparent that targeting friends from existing users that seem to be interested in the brand’s image is more effective than targeting users with no connection at all. Earlier studies have also reported, that users that are most likely to be interested in the focal brand can best identified when detecting overlapping communities from brands that are closely related to the focal brand (Zhang, et al., 2016). It is reasonable to assume that results would be more powerful with a higher overall response rate with a larger sample size.
Besides the main results, there were some side findings worth mentioning. Despite the subordinated role of segment D, since users in it only follow one of the selected brands, it was discovered that the amount of users who reacted to the friends invitation was more than double the amount from users that were connected to at least two exemplars (10 users) compared to users that were only connected to one exemplar (4 users). Therefore, one could assume that with an increase of exemplars a user follows, also the probability to find highly interested people increases. However, due to the small sample size there was no statistically significance resulted (p = .153).
In addition, it was observed that from 14 total reactions of users within segment C and D, five were already connected to the direct competitor “Fora Sunglasses”. Therefore, it can be interpreted that although users are connected to a competitor already, not all seem to be loyal and might be willing to turn into the focal brand’s customer.