M
ASTER OF
S
CIENCE IN
F
INANCE
M
ASTER
’
S
F
INAL
W
ORK
D
ISSERTATION
S
TART
-
UP
’
S
F
INANCIAL
C
APITAL AND THE
P
ROBABILITY OF
B
EING
A
CCEPTED INTO AN
A
CCELERATOR
P
ROGRAM
J
OÃO
M
ARIA
A
POLINÁRIO
J
ORGE
M
ASTER OF
S
CIENCE IN
F
INANCE
M
ASTER
’
S
F
INAL
W
ORK
D
ISSERTATION
S
TART
-
UP
’
S
F
INANCIAL
C
APITAL AND THE
P
ROBABILITY OF
B
EING
A
CCEPTED INTO AN
A
CCELERATOR
P
ROGRAM
J
OÃO
M
ARIA
A
POLINÁRIO
J
ORGE
S
UPERVISION:
P
ROFESSORAD
OUTORAA
NAI
SABELO
RTEGAV
ENÂNCIOi ABSTRACT
The aim of this dissertation is to evaluate the impact of the capital structure of a start-up on the probability of being accepted into an accelerator program. Due the fact that it is a recent topic, there is a lack of research on the preferences of accelerator’s directors in terms of the financing structure of start-ups. After building a sample of firms which applied to accelerators between 2016 and 2017, from a novel database provided by the Emory University in Atlanta, United States of America, we conducted Tobit and Probit analyses to assess the relationship between the capital structure of a start-up and the probability of being accepted in an accelerator program. Our results suggest that start-ups with higher levels of own equity, external equity and debt have higher chances of being accepted in accelerators. In terms of sources of funding, accelerator’s directors prefer start-ups with higher proportion of external equity in their capital structure.
KEYWORDS: Accelerators; Start-ups; Entrepreneurial Finance; Capital Structure; Accelerators’ Selection Process.
ii RESUMO
O objetivo desta dissertação é avaliar o impacto da estrutura de capital de uma start-up na probabilidade de esta ser aceite em programas de aceleração de empresas. Em virtude de se tratar de um tema recente, não existe literatura anterior sobre as preferências dos responsáveis pelos programas de aceleração relativamente à estrutura de financiamento das start-ups. Depois de selecionada uma amostra de empresas que se candidataram a aceleradoras entre 2016 e 2017, de uma base de dados fornecida pela Universidade Emory em Atlanta, Estados Unidos da América, utilizamos modelos de Tobit e Probit para avaliar a relação existente entre a estrutura de capital de uma empresa e a probabilidade de esta ser aceite em aceleradoras. Os resultados sugerem que start-ups com níveis mais altos de capitais dos fundadores, capitais próprios externos e dívida, têm maior probabilidade ser aceites em aceleradoras. Analisando as proporções relativas de cada fonte de financiamento, as aceleradoras preferem start-ups cuja maioria do capital seja proveniente de capitais próprios externos.
Palavras-chave: Acceleradoras; Start-ups; Empreendedorismo Financeiro; Estrutura de Capitais; Processo de Seleção de Acceleradoras.
iii
TABLE OF CONTENTS
1. Introduction ... 1
2. Literature Review ... 3
2.1. Main Characteristics of Accelerators ... 3
2.2. Benefits and Disadvantage of Accelerators ... 4
3. Theory and Hypotheses ... 7
4. Data and Descriptive Statistics ... 11
4.1. Data ... 11
4.2. Sample ... 11
4.3. Variables and Descriptive Statistics ... 11
5. Empirical Methodology and Results ... 13
6. Conclusion ... 18
References ... 20
Tables... 26
iv LIST OF TABLES
Table 1: Signalling effects of capital structure: Theoretical approaches……….26
Table 2: Signalling effects of capital structure: Empirical evidence………...…27
Table 3: Description of the variables………..28
Table 4: Descriptive statistics at the start-up’s level………...30
Table 5: Descriptive statistics at founders’ level………32
Table 6: Impact of the total amount of own equity, external equity and debt on the probability of the start-up being accepted in accelerators……….33
Table 7: Impact of a start-up’s capital structure on the probability of the start-up being accepted in accelerators: Logit model………..34
Table 8: Impact of a start-up’s capital structure on the probability of the start-up being accepted in accelerators: Probit model……….35
v
LIST OF ABBREVIATIONS
LPM: Linear Probability Model NPV: Net Present Value
ROI: Return on Investment OLS: Ordinary Least Squares
vi LIST OF APPENDIXES
Appendix 1: Impact of the total amount of own equity, external equity and debt on the probability of the start-up being accepted in accelerators: LPM …………..………..37
Appendix 2: Impact of a start-up’s capital structure on the probability of the start-up being accepted in accelerators: LPM ………...…38
vii ACKNOWLEDGMENTS
To my family, particularly, my parents, my sister and my brother, who have always supported me, stand by my side and have been my source of inspiration. During the elaboration of this dissertation, their encouragement and motivation have been crucial for me to overcome my struggles. I will be forever grateful.
I would like to express my gratitude to my supervisor, professor Ana Venâncio, from whom I have learned so much, during the master’s in finance but, in particular, this last semester that I had the privilege to have her contributions and enrichments to my work. Without her dedication, advice and guidance, this dissertation would not be possible.
I would also like to thank all my friends, for their friendship, patience, support and helping me growing every day.
I would like to make a final thanks to the Emory University in Atlanta, United States of America, for helpfully providing me all the data essential for this research. All errors remain my own.
1 1.INTRODUCTION
The importance of start-up’s initial financial capital is well established in the previous literature. Financial support has an important role in the entrepreneurial activities (Pan and Yang, 2018). In fact, the financial capital determines start-up’s size (Brüderl et al., 1992), growth (Cooper et al., 1994; Colombo and Grilli, 2005), and survival.1 Ventures with greater financial resources can overcome temporary hardships or managerial mistakes more easily. Financial capital allows firms to increase their legitimacy among stockholders, acquire better resources and technology, and start operation at a larger scale. The choice of funding (e.g. own equity, outside equity or debt) may also signal its value to investors and other external entities, reducing information asymmetries and agency problems (Ross, 1977; Tomboc, 2013). The capital structure not only signals the real value of a start-up, but also the growing perspectives, new profitable projects, the level of commitment of the entrepreneurs with the start-up and financial distress costs (Brealey, Leland and Pyle, 1977; Cassar, 2004; Greenwald, Stiglitz and Weiss, 1984; Myers, 2001). But, does the amount of financial capital also influence the probability of being accepted into start-up accelerators?
Start-up accelerators, also known as seed accelerator programs, are educational programs of limited duration created to support start-ups2 in their early stages of life. In these programs, established firms and experienced entrepreneurs assist new entrepreneurs by providing funding, business advice, mentorship and networking connections (Cohen, 2013). Although they share some characteristics of business incubators, accelerators differ in terms of duration, business model, start-up’s selection process and education provided (Isabelle, 2013).3 Their exhaustive selection process implies that only a few start-ups are accepted (Caley and Kula, 2013). Previous studies find that the selection decision is determined by entrepreneur’s motivations, objectives, academic background, previous entrepreneurial and working experience and start-up’s growth potential,
1 Bates (1990); Brüderl et al., (1992); Cooper et al., (1994); Astebro and Bernhardt (2003); Headd
(2003); Hvide and Moen (2008).
2 In this study, we define start-ups as nascent firms aimed to develop new opportunities to the market
and launch innovative products and services, in an environment of uncertainty (Hoffman and Radojevich-Kelley, 2012).
2
intellectual property and size (Yin and Luo, 2018). Until now, to the best of our knowledge, little is known about start-up’s financial capital and accelerator’s selection process.
In our study, we contribute to this literature by assessing the importance of the capital structure of a start-up in the selection process of an accelerator. More specifically, we examine the relationship between the proportion of entrepreneurs’ own capital, outside equity and debt in the capital structure of start-ups and their acceptance rate into an accelerator. Our research questions are the following: Does the amount of financial capital raised by a start-up affect the probability of being accepted into an accelerator program? Which source of funding will increase their chances of being accepted?
To address these questions, we use a novel database, the Entrepreneurship Database
Program, from Emory University in Atlanta. From this database, we select all for-profit
start-ups that applied to accelerator programs between 2016 and 2017, in which we have information about the start-up’s capital structure and characteristics of the founding team.
We find that the amount of financial capital positively affects the probability of a start-up being accepted into an accelerator. However, when comparing the sources of funding, we find that accelerators prefer start-ups with higher proportion of external capital, in detriment of own equity and debt.
This study has important practical implications. For entrepreneurs who intend to apply for such programs, this study suggest that their chances of being accepted increase when they raise external equity. For public policy, this study suggests that the governments should create mechanisms to support those applying start-ups, such as credit lines for new entrepreneurs, subsidies and fiscal incentives for accelerator’s founders.
This dissertation is structured as follows: section II reviews the relevant literature on accelerators and entrepreneurial finance; section III presents our theory and hypotheses to be tested; section IV describes the data, sample and the relevant variables; in section V we describe the empirical methodology and present the results; finally, section VI concludes.
3
2.LITERATURE REVIEW
Since accelerators are a relatively recent phenomenon, only a few studies have analysed the role of accelerators and their main characteristics (Cohen and Hochberg, 2014). In this section, we review the most relevant studies, concerning accelerators by differentiating them from business incubators and by defining its main benefits and disadvantages.
2.1. Main Characteristics of Accelerators
As previously mentioned, accelerators are educational programs of limited duration with the objective of assisting early stage firms establishing successfully in the market (Cohen, 2013) (Shankar and Shepherd, 2018)4. These programs are created by private investors, who intend to profit while helping start-ups to develop their new business ideas (Malek, Maine and McCarthy, 2013). The duration of program varies between three to six months, since most of the accepted start-ups are technology based. Hoffman and Radojevich-kelley (2012) finds that accelerators usually invest in technology-based start-ups with cut edge technology and products with international appeal. The programs operate in cohorts of start-ups, which allows the entrepreneurs to share knowledge and previous business experiences with other founders.
To apply to accelerators, start-ups must go through a very competitive selection process, in which the accelerator’s directors interview the entrepreneurs to evaluate the business idea, the background of the start-ups and of their founders, as well as founder’s motivations and start-up’s growth potential (Miller and Bound, 2011). At the firm level, they also assess if the product or service is innovative, the market in which the firm will operate, the existence of patents and trademarks, the willingness of the customers to acquire the product or service and the growth potential of the firm and its sustainability (Yin and Luo, 2018). Once the start-ups are accepted, the accelerator’s directors invest capital in each start-up, also known as pre-seed investment. Accelerators prefer to invest in start-ups formed by teams instead of a single entrepreneur, nevertheless, each team
4 Accelerators help start-ups in the stage, where they most frequently fail (Battistella, Toni and Pessot,
4
usually does not have more than four elements (Miller and Bound, 2011). At the end of the program, there is a demo-day, for entrepreneurs to introduce their start-up and present their business idea to potential investors (Miller and Bound, 2011; Clarysse, Wright and Hove, 2015).
Some studies compare accelerators with business incubators, in the sense that they help new ventures in their early stage and allow the program participants to connect with a network of investors (Malek, Maine and McCarthy, 2013). However, there are some differences between them. First, they differ in terms of duration. Accelerators usually last between three to six months while incubators vary from one to five years. The business model of accelerators consists on an investment provided by the accelerator’s director, which expect to profit from it, while the business model of incubators is based on office renting paid by the entrepreneurs. The selection process of accelerators is very competitive, unlike the selection process of incubators (Cohen and Hochberg, 2014). The type of education offered is also different. In accelerators, there are regular seminars where entrepreneurs learn core concepts about business such as finance, management and marketing. In contrast, incubators only provide some legal information punctually (Isabelle, 2013; Cohen and Hochberg, 2014).
2.2. Benefits and Disadvantages of Accelerators
Accelerators create a propitious environment for the entrepreneurs to develop their business ideas and to focus on innovation, while accelerators manage business related issues, such as financing, management and networking (Sharma, Joshi, Shukla, 2014). The main advantages of accelerators are funding, business advice, mentorship and networking connections and credibility (Cohen, 2013).
Accelerators first appeared to overcome the financial capital’s needs of start-ups (Hoffman and Radojevich-Kelley, 2012). In fact, Christiansen (2009) and Miller and Bound (2011) consider that access to financial capital is the most appealing benefit of accelerators, since the capital provided in these programs is fundamental for the development of the start-ups. In fact, following the financial crisis, accelerators became an important source of funding for new entrepreneurs. In contrast, bank’s regulation became stronger and credit concession for new start-ups became more restricted (Block,
JOÃO MARIA A.JORGE FINANCIAL CAPITAL AND ACCELERATORS
5
Colombo, Cumming and Vismara, 2017). Accelerator’s unique networks also positively contribute for subsequent funding after the boot-camp ends (Christiansen, 2009; Miller and Bound, 2011).
The mentorship that entrepreneurs receive in accelerators allows them to learn from past experiences of the mentors, avoid making the same mistakes and focus on the main issues of the project (Clarysse and Yusubova, 2014; Mejia and Gopal, 2015). The mentor’s experience allows them to find the strengths and weaknesses of the participating start-ups, to advise them about the most accurate strategies, opportunities and business plans to follow (Wise, Valliere, 2014).
Accelerators have an important role on reducing the asymmetric information problem since accelerator’s directors evaluate the participating start-ups during the selection process and have an accurate perception about the potential and fair value of the firms accelerated (Kim and Wagman, 2011). Thus, participating in an accelerator gives a signal to the market that the start-up is worth investing, reducing the gap of information about the true value and potential of the entrepreneurial firm between investors and entrepreneurs.
Accelerators bring advantages not only for start-ups and entrepreneurs, but also for accelerator’s directors (Hoffman and Radojevich-Kelley, 2012). Accelerator’s directors have interest in the success of the start-ups that participate in the programs, since they receive equity in exchange for capital (Christiansen, 2009). In the case of technology accelerators, participating start-ups may also use the technology provided by the accelerators (Miller and Bound, 2011). Accelerator’s directors have also strategic objectives when they host accelerators (Kanbach and Stubner, 2016). The directors might integrate the start-ups, which get improved after participating in their programs. Supporting start-ups is a good vehicle for large and already established firms to get involved in innovation projects and have access to the ultimate market trends, technologies and innovation (Christiansen, 2009; Kanbach and Stubner, 2016).
Despite their benefits, accelerators also present a few problems (Miller and Bound, 2011). Accelerators usually target entrepreneurs who aim to sell their start-ups. Therefore, accelerators become restricted to a number of start-ups and exclude entrepreneurs who desire to develop their start-ups on an ongoing basis. The limited duration of accelerators
6
is also an issue. The period of the program may be insufficient for the entrepreneurs to develop their business idea and to build their business (Chang, 2013). At the end of the program, start-ups are relatively recent and may not be sufficiently mature and the entrepreneurs might not be prepared to run the business (Miller and Bound, 2011). Moreover, Miller and Bound (2011) add that the amount of equity received by the accelerator’s directors may not be fair according to their contribution and effectiveness of accelerators program. Entrepreneurs must compare the costs of forgoing equity, such as, dispersion of the shareholders’ structure and loss of control in the firm, with the advantages and benefits inherent to accelerators (Chang, 2013). This is particularly relevant, for accelerators with weaker reputation (Wright, 2017). In terms of mentoring, accelerators usually copy what other accelerators do and consequently, fail to understand the needs and singularities of each participating start-up and entrepreneur (Hathaway, 2016).
JOÃO MARIA A.JORGE FINANCIAL CAPITAL AND ACCELERATORS
7
3.THEORY AND HYPOTHESES
In this section, we develop the hypotheses on the impact of the start-up’s financing structure in the accelerator’s selection process. We are interested in studying the influence that founders’ own equity, outside equity and debt have on the acceptance rate of accelerator programs.
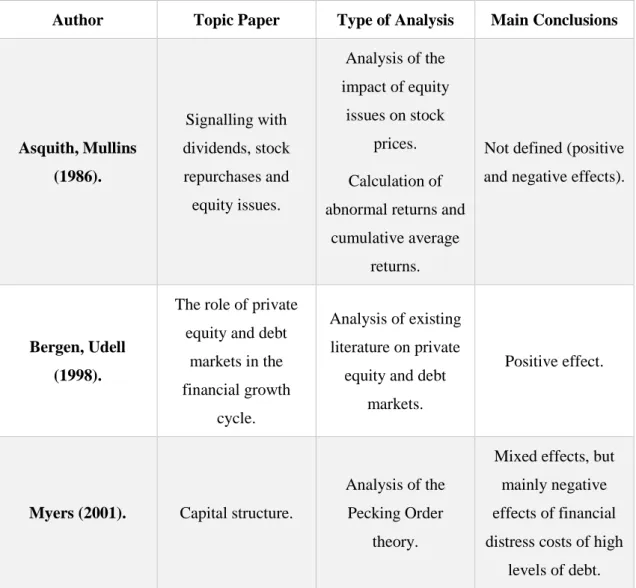
Tables 1 and 2 present the most relevant theories about the signalling effects of the financing structure. The financing sources available to a start-up are debt and equity (Berk and DeMarzo, 2010). While equity is a permanent source of capital, which represent the investment made by the owners, debt is the capital loaned by other parties and eventually it will be repaid (Coleman and Robb, 2012). Initially, founders fund their start-ups with equity financing, investing their own savings and their relatives’ capital and subsequently seek for outside investors such as angel investors and venture capitalists. In terms of external capital, start-ups raise, firstly, funds from angel investors and only in a subsequent stage obtain funds from venture capitalists, which, usually, provide larger amounts of capital (Wong et al., 2009). As the start-up evolves to a greater dimension, with a more complex structure of shareholders and a higher level of reputation, it will search for debt financing (Cosh, Cumming and Hughes, 2009). The capital structure of the start-ups includes the combination of these several sources of funding (Myers, 2010) and, it depends on start-up’s size, asset structure, legal organization, owners’ characteristics and growth perspectives (Cassar, 2004; Kurshev and Strebulaev, 2007; Fraser, Bhaumik and Wright, 2015).5
The lack of assets that can be used as collateral, the scarce years of operations and uncertainty about future profitability prevent start-ups from raising debt, therefore, they often prefer to raise equity financing (Denis, 2004). Start-ups face the agency and information asymmetries problems. The information asymmetries problem arises because start-up’s founders possess a wider knowledge about the potential of their business and a better understanding of its quality than outside investors. In fact, investors are unable to make an accurate assessment of the firm and reach an agreement with the entrepreneurs
5 The pecking order and the life cycle theory contributes to explain the financing decision (Fraser,
Bhaumik and Wright, 2015). The pecking order theory suggest that start-ups choose internal funds first, once it is less expensive, and then seek external sources such as equity and debt. It also says that profitable firms tend to use more internal funds because their owners shall be interested in investing in the firm (Myers and Majluf, 1984).
8
about the firm’s value (Tomboc, 2013). When firms incur in external financing, a conflict of interests arise, in the sense that the founder may use such funds on his own benefit, contrary to the investor’s objectives. This is known in the literature as the agency problem (Denis, 2004).
Founder’s choice for the capital structure of a start-up may mitigate these problems (Ross, 1977). The founders have better information about the true value of the start-up, and when they invest their own capital in the start-up, they are expecting higher future cash flows than the current firm value. This information signals that the start-up is worth investing, reducing the problem of information asymmetries (Brealey, Leland and Pyle, 1977). When entrepreneurs own a high share of the start-up, they are more committed to make the firm grow and prosper (Ahlers, Cumming, Gunther and Schweizer, 2015). On the other hand, founder’s own capital may serve as a signal to the market, reflecting the commitment of the founding team and the quality of the business idea. In fact, higher proportion of founder’s own capital indicates that the firm is more profitable and is expected to generate higher cash flows (Vermaelen, 1981). We apply the same argument to the accelerator director’s selection decision. When they are evaluating start-ups, they may look at the share of own equity as a signal information about the business quality. Entrepreneurs of higher quality will usually invest more of their own money (Brealey, Leland and Pyle, 1977). Moreover, ventures with larger own capital will have larger resources to use as collateral to secure external funding (Berger and Udell, 1998). Therefore, we assume:
Hypothesis 1: Start-ups with higher share of own equity in the capital structure will have higher chances of being accepted into an accelerator.
Previous literature is not unanimous relatively to the signalling effect of outside equity. In one hand, issuing outside financing indicates that the firm is growing and needs more capital to finance its projects (Cassar, Holmes, 2003; Asquith Mullins, 1986). More dynamic start-ups, with higher growth potential, more credibility and in more advanced stages of their life-cycle, tend to incur in more external financing (Fraser, Bhaumik and Wright, 2015). Larger start-ups are less likely to fail, since they generate more cash flows
JOÃO MARIA A.JORGE FINANCIAL CAPITAL AND ACCELERATORS
9
than smaller firms. Also, the size of a start-up affects its financing structure due the economies of scale in lowering asymmetric information, transaction costs, market access and risk exposure (Cassar, 2004). Furthermore, firms that raised external capital had to go already through a selection and monitoring process from outside investors. Due to their competitive and highly selective process, only few firms raise external equity (Fluck, 1998).
On the other hand, outside equity may represent a negative signal due the loss of incentives from the management team (the initial owners of the start-up) to maximize the activities, operations and profits of the firm. When managers do not own the full capital of the firm, they have less incentive to maximize the interests of the company. However, external capital entities implement several mechanisms to align founder’s and venture’s interest (Jensen and Meckling, 1976). Moreover, it may also indicate the firm is overpriced (Asquith Mullins, 1986), which implies that the founder intends to sell the start-up at a higher price than its net present value (NPV) (Jensen and Meckling, 1976; Greenwald, Stiglitz and Weiss, 1984). Nevertheless, considering the reputation and monitoring process of external equity entities, accelerator’s director will probably take more into consideration the positive signals. Therefore, we expect:
Hypothesis 2: Start-ups with higher share of external equity in the capital structure will have higher chances of being accepted into an accelerator.
When start-ups raise debt, they are already in a later stage of their firm’s life cycle and the accelerator program are fitted to early stage ventures, when they are still testing their business models. When start-ups incur in debt funding, they must go through a process of risk analysis and regular scrutiny to ensure that firm’s activities are regularly supervised (Ross, 1977). Besides, growing start-ups need more leverage to finance its operations, which is positive and means that the firm has growing perspectives (Berger and Udell, 1998). Another benefit inherent to debt financing is the tax shields firms obtain, since the interest expenses paid, reduce the amount of profits subject to taxes, decreasing the tax value the firms owe (Myers, 2001). However, debt is also associated to higher financial distress costs (Myers, 2001). The author argues that the higher the
10
value of debt in the financing structure of a firm, the higher the costs of bankruptcy, and consequently the higher the agency costs. All of this may have a negative impact when accelerators directors are evaluating the applying start-ups.
Hypothesis 3: Start-ups with higher share of debt in their capital structure have lower probability of being accepted into an accelerator.
JOÃO MARIA A.JORGE FINANCIAL CAPITAL AND ACCELERATORS
11
4.DATA AND DESCRIPTIVE STATISTICS
4.1. Data
Our data comes from a novel database, the Entrepreneurship Database Program from Emory University in Atlanta, United States of America. The Entrepreneurship Database Program records information on the entrepreneurs who applied to several accelerator programs. These entrepreneurs respond every six months to a questionnaire to update their information. The database includes information on start-up applicants between 2013 and 2017, surveying more than 13,495 early-stage ventures and 175 accelerator programs. This dataset surveys accepted and rejected start-ups from 150 countries worldwide and it has information at the firm and founders’ level.
At the firm level, the survey includes information on the start-up’s country of headquarters, number of founders, number of employees, presence in social media and webpage, year of foundation, legal status, innovation (copyrights, patents and trademarks), revenues, if the start-up was previously accelerated and the sources of financing (own capital, equity, debt and philanthropic). At the entrepreneurs’ level, the survey includes age, gender, education degree, entrepreneurial experience and job experience.
4.2. Sample
From Entrepreneurship Database Program database, we select all for-profit start-ups which applied to an accelerator program between 2016 and 2017. The database only disclosures information on the acceptance of the firm in the accelerator program since 2016. Then, we exclude start-ups with missing information on start-up’s and founder’s characteristics and we restricted our sample to the start-ups established by founders aged between 20 and 70 years old. We end up with a sample of 3,649 start-up observations, with information of 8,228 founders.
4.3. Variables and Descriptive Statistics
Table 3 describes the variables used in this study and Tables 4 and 5 present the descriptive statistics of our sample.
12
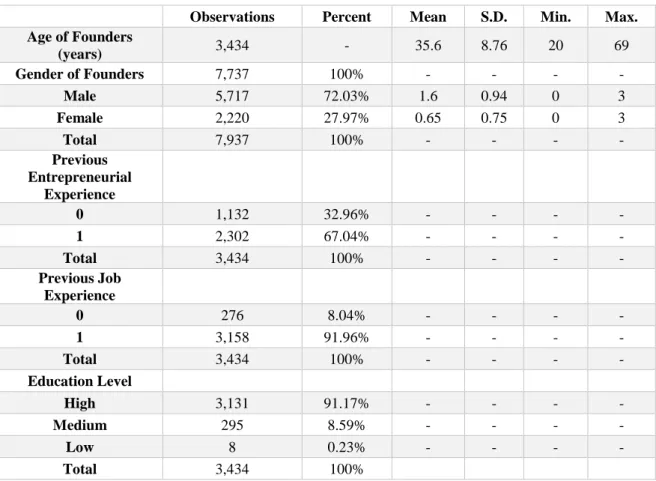
The majority of the start-ups in our sample are accepted into an accelerator program. Approximately 80 percent of the start-ups are accepted. Relatively to start-up’s characteristics, each start-up has, on average, 3 founders, 33 employees and a value of revenues of approximately 292,913$. In terms of capital structure, own equity, external equity and a debt account for 23 percent, 55 percent and 22 percent, respectively. Furthermore, 89 percent have a website and/or social media, 53 percent possess intellectual property and 37 percent were previously accelerated. In terms of founder’s characteristics, entrepreneurs, on average, are male (72 percent) and have 35.6 years of age. In terms of experience, 67 percent of the start-ups in our sample have, at least, one founder with entrepreneurial experience and 92 percent with working experience. Relatively to education degree, 91 percent have, at least, one founder with a Bachelor, Master or Doctoral degree and only 9 percent of the start-ups have founders with the high school or vocational degree.
JOÃO MARIA A.JORGE FINANCIAL CAPITAL AND ACCELERATORS
13
5.EMPIRICAL METHODOLOGY AND RESULTS
In this section, we evaluate the impact of the levels of capital and the financing structure on the accelerator’s selection process. In order to test the effect of the amount of own equity, outside equity and debt in the probability of a start-up being accepted into an accelerator, we conduct a Logit and a Probit model by estimating equation (1). To assess which source of funding increases the chance of start-up being accepted we estimate equations (2) and (3): 𝐴𝑐𝑐𝑒𝑝𝑡𝑒𝑑𝑠,𝑓 = 𝛼 + 𝛽𝑋𝑠´+ 𝜃𝑍𝑓´ + 𝛿1ln(𝑜𝑤𝑛𝑒𝑞𝑢𝑖𝑡𝑦) + 𝛿2ln(𝑒𝑥𝑡𝑒𝑞𝑢𝑖𝑡𝑦) + 𝛿3ln(𝑑𝑒𝑏𝑡) + 𝜀𝑠,𝑓 𝐴𝑐𝑐𝑒𝑝𝑡𝑒𝑑𝑠,𝑓 = 𝛼 + 𝛽𝑋𝑠´ + 𝜃𝑍𝑓´ + 𝛿1𝑒𝑥𝑡𝑒𝑟𝑛𝑎𝑙𝑒𝑞𝑢𝑖𝑡𝑦𝑝𝑒𝑟𝑐𝑒𝑛𝑡 + 𝛿2𝑑𝑒𝑏𝑡𝑝𝑒𝑟𝑐𝑒𝑛𝑡 + 𝜀𝑠,𝑓 𝐴𝑐𝑐𝑒𝑝𝑡𝑒𝑑𝑠,𝑓 = 𝛼 + 𝛽𝑋𝑠´ + 𝜃𝑍 𝑓´ + 𝛿1𝑒𝑥𝑡𝑒𝑟𝑛𝑎𝑙𝑒𝑞𝑢𝑖𝑡𝑦𝑝𝑒𝑟𝑐𝑒𝑛𝑡 + 𝛿2𝑜𝑤𝑛𝑒𝑞𝑢𝑖𝑡𝑦𝑝𝑒𝑟𝑐𝑒𝑛𝑡 + 𝜀𝑠,𝑓
Where s is the applying start-up and f refers to the founder.
Our dependent variable is accepted, a dummy variable, equalling one if a start-up is accepted in an accelerator program and zero otherwise.
The variables of interest in our model are lntotalownequity, calculated as the natural logarithm of the total own equity; lntotalexternalequity, computed as the natural logarithm of the total external equity; lntotaldebt, calculated as the natural logarithm of the total debt; ownequitypercent, computed as the ratio between the total value of own equity and the total assets; externalequitypercent, calculated as the ratio between the total amount of external equity and the total assets; and debtpercent, computed as the ratio of total debt over total assets.
(1)
(2)
14
As suggested by the previous literature, we include the most relevant factors that influence the acceptance rate of the accelerator’s directors. The vector of firm’s characteristics, 𝑋𝑠´ includes: size measured by the natural logarithm of the number of employees; lnrev measured by the logarithm of the total revenues of the previous year; the number of founders; intproperty (dummy variable equalling one if the firm has patents, trademarks and/or copyrights and zero otherwise); websitesocialmedia (dummy variable equalling one if the start-up has facebook/tweeter/linkedin and/or website, and zero otherwise); lnnrfounders measured as the natural logarithm of the total number of founders of each start-up; lnagestartup computed as the natural logarithm of the number of years of activity of the start-up; prevaccelerated (dummy variable equalling one if the start-up has been accelerated before and zero otherwise) and four categorical variables for profitability: profitability_dum1 (dummy variable equalling one if the profitability is between 0 percent and 5 percent and zero otherwise), profitability_dum2 (dummy variable equalling one if the profitability is between 6 percent and 10percent and zero otherwise), profitability_dum3 (dummy variable equalling one if the profitability is between 11 percent and 15 percent and zero otherwise), profitability_dum4 (dummy variable equalling one if the profitability is between 16 percent and 20 percent and zero otherwise), profitability_dum5 (dummy variable equalling one if the profitability is higher than 20 percent and zero otherwise); profitability_dum6 (taking the value one if the start-up had a negative ROI and zero otherwise).
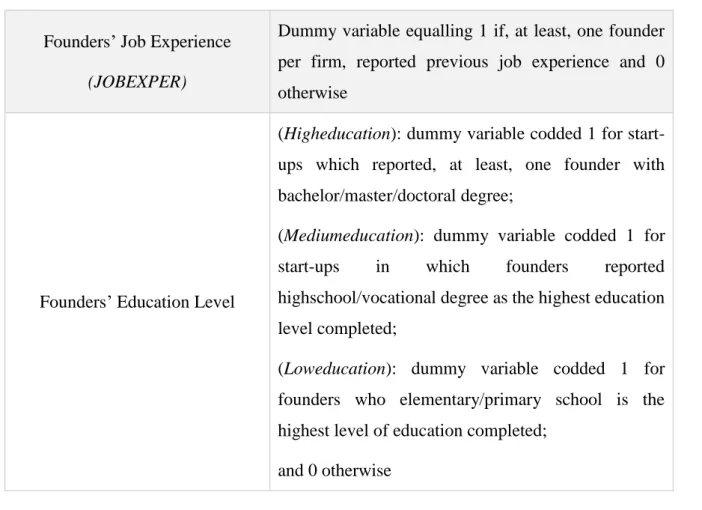
The founder characteristics vector, 𝑍𝑓´, includes the following variables: lnmale (natural logarithm of the number of male founders); entrepexper (dummy variable equalling 1 if, at least, one founder per start-up has entrepreneurial experience and 0 otherwise); jobexper (dummy variable equalling one if, at least, one founder has working experience and zero otherwise); and education level measured with three categorical variables: higheducation (dummy variable equalling one when start-ups reported, at least one founder with bachelor, master or doctoral degree and zero otherwise),
mediumeducation (dummy variable assuming the value one for start-ups which reported
that the highest education level completed by their founders is high school or vocational degree and zero otherwise) and loweducation (dummy variable equalling one for start-ups in which founders have not completed a degree higher than elementary, middle or primary school and zero otherwise).
JOÃO MARIA A.JORGE FINANCIAL CAPITAL AND ACCELERATORS
15
We include fixed effects at the accelerator program, country, and sector of activity. Standard errors are clustered at the accelerator program level.
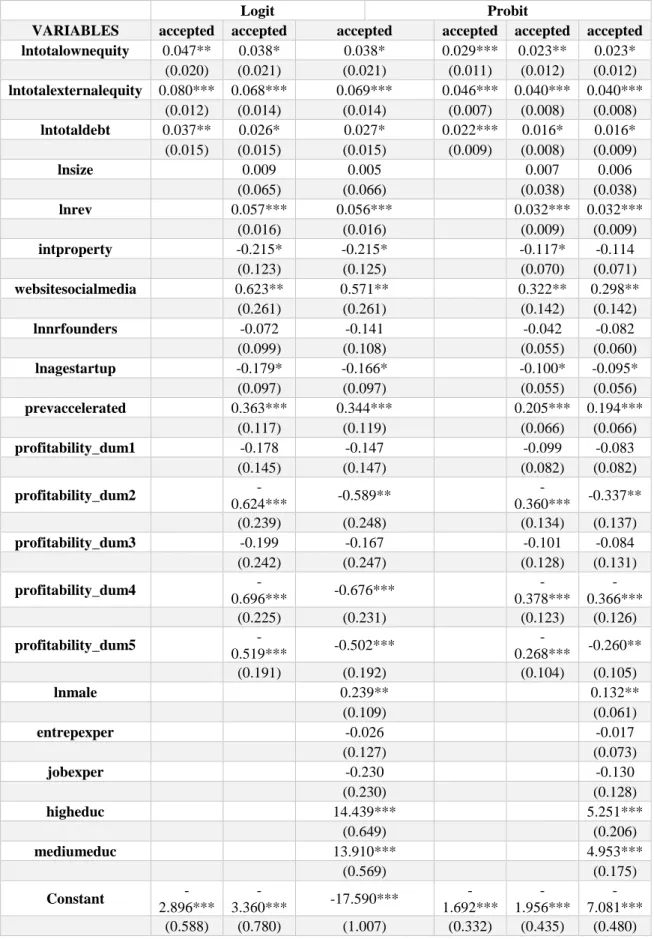
Table 6 presents the results of the estimated regression (1) using the Logit and Probit models.
The Logit estimates suggest a positive effect of the total amount of own equity of a start-up and its acceptance rate in an accelerator program. An increase of the amount of own equity leads to an increase, ceteris paribus, in the probability of the start-up being accepted in an accelerator. This result confirms the arguments that in firms with higher levels of own equity, entrepreneurs are more committed with the start-up (Ahlers, Cummings, Gunther and Schweizer, 2015), own equity is a positive signal about the quality of the firm (Leland and Pyle, 1977) and firms with more own equity possess more resources to use as collateral (Berger and Udell, 1998). Relatively to the amount of outside equity, there seems to have, as well, a positive relationship with the probability of the start-up being accepted into accelerators. According to our results, an increase in the amount of total outside equity corresponds to an increase, ceteris paribus, in the probability of being accepted. This is according to the theory that start-ups with higher amounts of external equity correspond to growing start-ups needing more capital to develop their projects (Cassar and Holmes, 2003) and more outside equity is associated to larger start-ups, benefiting from economies of scale, less asymmetric information, lower transaction costs and easier access to markets (Cassar, 2004). The total amount of debt has a positive impact in the probability of a start-up being accepted into an accelerator program. An increase in the total amount of debt leads to an increase, ceteris
paribus, in the chances of the start-up to be accepted. These results corroborate that firms
which incur in debt financing are subject to a process of risk analysis and regular scrutiny (Ross, 1977), firms which need to be leveraged have growing perspectives (Berger and Udell, 1998) and benefits of tax shields associated to higher levels of debt (Myers, 2001).
The results we obtained with the Probit model confirm the results we described previously. The total amount of own equity, external equity and debt have a positive effect in the probability of a start-up being accepted in an accelerator program.
Table 7 presents the results of the estimated regressions (2) and (3), using the Logit model.
16
The estimates from equation (2) suggest a positive relationship between the share of external equity and the chances of a start-up being accepted into an accelerator program. An increase of the share of external equity is associated to an increase, ceteris paribus, in the probability of the start-up being accepted. This result is according with the theory that firms which raised outside equity have already passed through a monitoring and assessment process from outside investors (Fluck, 1998), and for that reason are more appealing for accelerators’ directors. On the other hand, higher amounts of debt have a negative impact on the acceptance rate of start-ups, but it is not statistically significant. An increase of the share of debt in the capital structure corresponds to a decrease, ceteris
paribus, in the probability of the start-up to be accepted into accelerators. This confirms
that higher levels of debt are associated to financial distress costs and firms with more debt are subject to higher bankruptcy costs and agency costs (Myers, 2001).
The results from regression (3), confirm the positive relationship between the share of outside equity and the chances of a start-up to be accepted in accelerators that we achieved with regression (2). According to the results obtained in regression (3) an increase of the share of outside equity leads to an increase, ceteris paribus, in the probability of the start-up to be accepted into an accelerator program. Relatively to the effect of the share of own equity in acceptance rate of a start-up in accelerators, the results from equation (3) suggest that start-ups with higher share of own equity in their capital structure tend to have lower acceptance rates in accelerator programs. A start-up with more own equity share has less probability, ceteris paribus, of being accepted in an accelerator program. These results indicate that despite the positive signals associated to higher levels of own equity, described above, the assessment process that start-ups are subject when issue outside equity and the reputation of external entities have a greater impact in the selection process.
Table 8 presents the results of the estimated regressions (2) and (3), using the Probit model.
The results we obtained using the Probit model confirm the results we described previously. Start-ups with higher share of outside equity tend to have higher chances of being accepted into accelerator programs than start-ups with higher share of own equity or debt.
JOÃO MARIA A.JORGE FINANCIAL CAPITAL AND ACCELERATORS
17
Considering the results described above, we tend to reject our hypothesis 1, since start-ups with higher share of own capital seem to have lower chances of being accepted into accelerator programs. We do not reject our hypothesis 2, since start-ups with higher share of external equity tend to have higher rates of acceptance in accelerators. Start-ups with higher share of debt seem to have lower probabilities of being accepted into an accelerator program, thus we tend to reject our hypothesis 3.
We are able then to answer to our research questions. In the first place, the amount of financial capital raised by a start-up affects the probability of being accepted into an accelerator program, confirmed by our results from regression (1). Moreover, external equity is the source of financing which increases the chances of a start-up to be accepted into an accelerator, according to the results we achieved in regressions (2) and (3).
18
The aim of this research is to study the relationship between the financing structure of a start-up and the probability of being accepted in an accelerator program. Thus, we selected a sample based on novel database provided by the Emory University in Atlanta, United States of America, containing information of start-ups which have applied to accelerator programs between 2016 and 2017.
Then we performed a multiple regression analysis, using Logit and Probit models, in order to estimate, firstly, the impact of the total amount of own equity, external equity and debt on the probability of a start-up being accepted in accelerators, and then to assess which source of funding increases its chance of being accepted.
The results we achieved lead us to conclude that there is a positive relationship between the total amount of own equity, external equity and debt and the probability of a start-up being accepted into accelerators, which means that the amount of financial capital raised by a start-up affects the probability of being accepted. However, when we studied the impact of the proportion of own equity, external equity and debt, we conclude that start-ups with higher share of external capital tend to be preferred by accelerators’ directors, comparing to start-ups with higher share of own equity or debt. With these results we also conclude that accelerators’ directors prefer start-ups with higher levels of capital, and firms with larger share of external equity in their capital structure, in detriment of start-ups with higher share of own equity or debt.
This study intends to fulfil a gap in the existent literature and is a contribute to the literature about entrepreneurial finance and is particularly relevant for start-ups which intend to apply to accelerator programs. Our research indicates that entrepreneurs should raise external equity before applying to accelerators in terms of economic policy. It is also relevant in terms of economic policy, in the sense that it suggests that Governments should create mechanisms to assist applying start-ups, such as fiscal benefits and subsidies for accelerators’ founders and credit lines for new entrepreneurs.
This study has, however, some limitations that is important to take in consideration. Our research is based on a sample of start-ups that may not be fully representative in
JOÃO MARIA A.JORGE FINANCIAL CAPITAL AND ACCELERATORS
19
terms of the characteristics we want to study, which may compromise the statistical significance of our results, as well as the fact that accelerators are a quite recent phenomenon, with few records of information about start-ups and entrepreneurs that applied to accelerators which lead us to exclude a few start-ups, and only considering start-ups which applied form 2016 onwards.
For future research, it would be interesting to have a depth study about other factors that influence the selection process of start-ups in accelerator programs, as well as more studies on the relationship between the capital structure of a start-up and the accelerator selection process, upgrading the available information about start-ups and entrepreneurs that applied to accelerator programs.
20 REFERENCES
Ahlers, G. K. C., Cumming, D., Gunther, C. and Schweiser, D. (2015). “Signaling in Equity Crowdfunding”, Entrepreneurship Theory and Practice, vol. 39(4), pp. 955-980;
Asquith, P. and Mullins, D. W. (1986). “Signalling with Dividends, Stock Repurchases, and Equity Issues”, Financial Management, vol. 15(3), pp. 27-44;
Âstebro, T. and Bernhardt, I. (2003). “Start-up financing, owner characteristics, and survival”, Journal of Economics and Business, vol. 55(4), pp. 303-319;
Bates, T. (1990). “Entrepreneur Human Capital Inputs and Small Business Longevity”,
The Review of Economics and Statistics, vol. 72(4), pp. 551-559;
Battistela, C., Toni, A. F. and Pessot, E. (2016). “Open accelerators for start-ups success: a case study”, European Journal of Innovation Management, vol. 20(1), pp. 80-111;
Berger, A. N. and Udell, G. F. (1998). “The economics of small business finance: The roles of private equity and debt markets in the financial growth cycle”, Journal of
Banking and Finance, vol. 22(6-8), pp. 613-673;
Berk, J. and DeMarzo, P. (2014). Corporate Finance, 4th Ed. Pearson;
Block, J. H., Colombo, M. G., Cumming, D. J. and Vismara, S. (2017). “New players in entrepreneurial finance and why they are there”, Small Business Economics, vol. 50(2), pp. 239-250;
Brealey, R., Leland, H. E. and Pyle, D. H. (1977). “Informational asymmetries, financial structure and financial intermediation”, The Journal of Finance, vol. 32(2), pp. 371-387;
Bruderl, J., Preisendorfer, P. and Ziegler, R. (1992). “Survival Chances of Newly Founded Business Organizations”, American Sociological Review, vol. 57, pp. 227-242;
JOÃO MARIA A.JORGE FINANCIAL CAPITAL AND ACCELERATORS
21
Caley, E. and Kula, H. (2013). “Seeding Success: Canada´s Startup Accelerators”, MaRS
Data Catalyst;
Cassar, G. (2004). “The financing of business start-ups”, Journal of Business Venturing, vol. 19(2), pp. 261-283;
Cassar, G. and Holmes, S. (2003). “Capital structure and financing of SMEs: Australian evidence”, Accounting and Finance, vol. 43 (2), pp. 123-147;
Chang, C. (2013). “Portfolio Company Selection Criteria: Accelerators vs Venture
Capitalists”, CMC Senior Theses, 566, available at:
http://scholarship.claremont.edu/cmc_theses/566;
Christiansen, J. D. (2009). “Copying Y Combinator: A framework for developing Seed Accelerator Programs”, MBA Dissertation/Individual Project, Judge Business School & Jesus College, Cambridge, University of Cambridge, available at https://businessmanagementphd.files.wordpress.com/2014/11/christiansen-2009-copying-y-combinator-university-of-cambridge-mba-thesis.pdf;
Clarysse, B. and Yusubova, A. (2014). “Success factors of business accelerators”,
Technology Business Incubation Mechanisms and Sustainable Regional Development, Proceedings, presented at the Technology Business Incubation
Mechanisms and Sustainable Regional Development, available at: https://biblio.ugent.be/publication/6842877/file/6843687.pdf;
Clarysse, B., Wright, M. and Hove, J. V. (2015). “A Look inside Accelerators”, Building
Business – NESTA, available at: https://media.nesta.org.uk/documents/a_look_inside_accelerators.pdf;
Cohen, S. (2013). “What Do Accelerators Do? Insights from Incubators and Angels”,
MIT Press, vol. 8(3/4), pp. 19-25;
Cohen, S. and Hockberg, Y. V. (2014). “Accelerating Start-ups: The Seed Accelerator
Phenomenon”, available at SSNR:
22
Coleman, S. and Robb, A. (2012). “Capital structure theory and new technology firms: is there a match?” Management Research Review, vol. 35(2), pp. 106-120;
Colombo, M. G. and Grilli, L. (2005). “Founders’ human capital and the growth of new technology-based firms: A competence-based view”, Research Policy, vol. 34(6), pp.795-816;
Cooper, A. C., Gimeno-Gascon, F. J. and Woo, C. Y. (1994). “Initial human and financial capital as predictors of new venture performance”, Journal of Business Venturing, vol. 9(5), pp. 371-395;
Cosh, A., Cumming, D. and Hughes, A. (2009). “Outside Entrepreneurial Capital”, The
Economic Journal, vol. 119(540), pp. 1494-1533;
Denis, D. J. (2004). “Entrepreneurial finance: an overview of the issues and evidence”,
Journal of Corporate Finance, vol. 10(2), pp. 301-326;
Denis, D. K. and Shome, D. K. (2005). “An empirical investigation of corporate asset downsizing”, Journal of Corporate Finance, vol. 11(3), pp. 427-448;
Fraser, S., Bhaumik, S. K. and Wright, M. (2015). “What do we know about entrepreneurial finance and its relationship with growth?”, International Small
Business Journal, vol. 33(1), pp. 70-88;
Fluck, Z. (1998). “Opyimal Financing Contracting: Debt versus Outside Equity”, The
Review of Financial Studies, vol. 11(2), pp. 383-418;
Greenwald, B., Stiglitz, J. E., Weiss, A. (1984). “Informational imperfections on the capital market and macro-economic fluctuations”, National Bureau of Economic
Research, working paper no. 1335;
Grimaldi, R. and Grandi, A. (2005). “Business incubators and new venture creation: an assessment of incubating models”, Technovation, vol. 25(2), pp. 11-121;
Hathaway, I. (2016). “Accelerating growth: Start-up accelerator programs in the United States”, Advanced Industries Series, Number 81/81;
JOÃO MARIA A.JORGE FINANCIAL CAPITAL AND ACCELERATORS
23
Headd, B. (2003). “Redefining Business Success: Distinguishing Between Closure and Failure” Small Business Economics, vol. 21(1), pp. 51-61;
Hoffman, D. L. and Radojevich-Kelley, N. (2012). “Analysis of Accelerator Companies: An Explanatory Case Study of Their Programs, Processes and Early Results”,
Small Business Institute Journal, vol. 8(2), pp. 54-70;
Hvide, H. K. and Moen, J. (2008). “Liquidity Constraints and Entrepreneurial Performance”, CEPR Discussion Paper no. DP6495. Available at SSRN: https://ssrn.com/abstract=1138959;
Isabelle, D. A. (2013). “Key Factors Affecting a Technology Entrepreneur´s choice of Incubator or Accelerator, Technology Innovation Management Review, pp. 16-22;
Jensen, M. C. and Meckling, W. H. (1976). “Theory of the firm: Managerial behavior, agency costs and ownership structure”, Journal of Financial Economics, vol. 3(4), pp. 305-360;
Kim, J. and Wagman, L. (2011). “Early-Stage Financing and Information Gathering: An Analysis of Start-up Accelerators”, Working paper available at:
https://editorialexpress.com/cgi-bin/conference/download.cgi?db_name=IIOC2013&paper_id=48;
Kanbach, D. K. and Stubner, S. (2016). “Corporate Accelerators as Recent Form of Startup Engagement: The What, The Why and The How”, The Journal of Applied
Business Research, vol. 32(6), pp. 1761- 1776;
Kurshev, A. and Strebulaev, I. A. (2006). “Firm Size and Capital Structure”, EFA 2005
Moscow Meetings Paper, Available at: Strebulaev, Ilya A. and Kurshev,
Alexander, Firm Size and Capital Structure (March 1, 2006). EFA 2005 Moscow Meetings Paper. Available at SSRN: https://ssrn.com/abstract=676106;
Malek, K., Maine E. and McCarthy, I. P. (2013), “A typology of clean technology commercialization accelerators”, Journal of Engineering and Technology
24
Mejia, J. and Gopal, A. (2015). “Now and Later? Mentorship, Investor Ties and Performance in Seed-Accelerators”, Working paper available at: http://conference.druid.dk/acc_papers/kvkoblkf64j28g3eqccmfsko2q5m.pdf;
Miller, P. and Bound, K. (2011). “The Startup Factories: The rise of accelerator programmes to support new technology ventures”, NESTA, Discussion paper available at: https://media.nesta.org.uk/documents/the_startup_factories_0.pdf;
Myers, S. C. (2001). “Capital Structure”, Journal of Economic Perspectives, vol. 15(2), pp. 81-102;
Myers, S. C. and Majluf, N. S. (1984). “Corporate financing and investment decisions when firms have information that investors do not have”, Journal of Financial
Economics, vol. 13(2), pp.187-221;
Pan, F. and Yang, B. (2018). “Financial development and the geographies of startups cities: evidence from China”, Small Business Economics, pp. 1-16;
Ross, S. A. (1977). “The Determination of Financial Structure: The incentive-signalling Approach”, The Bell Journal of Economics, vol. 8(1), pp. 23-40;
Shankar, R., K. and Shepherd, D., A. (2018). “Accelerating strategic fit or venture emergence: Different paths adopted by corporate accelerators”, Journal of
Business Venturing, available at: https://doi.org/10.1016/j.jbusvent.2018.06.004
Sharma, A., Joshi, M. and Shukla, B. (2014). “Is Accelerator an Option? Impact of
Accelerator in Start-up Eco-System!”, available at SSRN:
https://papers.ssrn.com/sol3/papers.cfm?abstract_id=2438846;
Tomboc, G. F. (2013). “The Lemons Problem in Crowdfunding”, The John Marshal
Journal of Information Technology & Privacy Law, vol. 30(2), pp. 253-280;
Vermaelen, T. (1981). “Common stock repurchases and market signaling: an empirical study”, Journal of Financial Economics, vol. 9(2), pp. 139-183;
JOÃO MARIA A.JORGE FINANCIAL CAPITAL AND ACCELERATORS
25
Wise, S. and Valliere, D. (2014). “The Impact on Management Experience on the Performance of Start-ups within Accelerators”, The Journal of Private Equity, vol. 18(1), pp. 9-19;
Wong et. al (2009). “Angel finance: the other venture capital”, Briefings in
Entrepreneurial Finance, vol. 18(7-8), pp. 221-230;
Wright, F. (2017). “How do entrepreneurs obtain financing? An evaluation of available options and how they fit into the current entrepreneurial ecosystem”, Journal of
Business & Finance Librarianship, vol. 22(3-4), pp. 190-200;
Yin, B. and Luo, J. (2018). “How Do Accelerators select Startups? Shifting Criteria Across Stages”, IEEE Transactions on Engineering Management, vol. 65(4), pp. 1-16.
26 TABLES
Table 1- Signalling Effects of Capital Structure: Theoretical Approaches
Author Topic Paper Type of Analysis Main Conclusions
Asquith, Mullins (1986). Signalling with dividends, stock repurchases and equity issues. Analysis of the impact of equity issues on stock prices. Calculation of abnormal returns and
cumulative average returns.
Not defined (positive and negative effects).
Bergen, Udell (1998).
The role of private equity and debt
markets in the financial growth
cycle.
Analysis of existing literature on private
equity and debt markets.
Positive effect.
Myers (2001). Capital structure.
Analysis of the Pecking Order
theory.
Mixed effects, but mainly negative effects of financial distress costs of high
JOÃO MARIA A.JORGE FINANCIAL CAPITAL AND ACCELERATORS
27
Table 2- Signalling Effects of Capital Structure: Empirical Evidence
Name (Paper)
Region /
country Period Methodology
Dependent Variable Independent Variable Conclusions Ahlers, Cumming, Gunther, Schweizer (2015) Australia 2006 - 2011 Univariate: mean differences Multivariate: OLS Fully funded; Nr. Investors; Funding amount; Speed of investment.
Equity share Positive impact Vermaelen (1981) E.U.A. 1962 - 1977 Computation of abnormal returns ASFE; CASFE; (standardized earnings per share forecasted errors) Repurchased shares Positive impact Cassar (2004) Australia 1996 - 1998 Multivariate: OLS, Tobit Leverage; Long-term leverage; Outside financing Bank financing Assets Noncurrent assets Positive Impact
28
Table 3: Description of the variables
Dependent Variable Description
Accepted Start-up
(ACCEPTED)
Dummy variable equalling 1 if the start-up is accepted in the accelerator and 0 otherwise
Independent Variables
Start-up´s Total Own Equity
(LNTOTALOWNEQUITY) Natural logarithm of the total own equity
Start-up´s Total External Equity
(LNTOTALEXTERNALQUITY) Natural logarithm of the total external equity
Start-up´s Total Debt
(LNTOTALDEBT)
Natural logarithm of the total debt
Start-up´s Proportion of Own Equity
(OWNEQUITYPERCENT)
Ratio between the total own equity and the total assets
Start-up´s Proportion of External Equity
(EXTEQUITYPERCENT)
Ratio between the total external equity and the total assets
Start-up´s Proportion of Debt
(DEBTPERCENT)
Ratio between the total debt and the total assets
Firm Size
(LNSIZE)
Natural logarithm of the number of employees in the start-up
Revenues
(LNREV)
Natural logarithm of the total revenues of the previous year
Intellectual Property
(INTPROPERTY)
Dummy variable equalling 1 if the firm has copyrights, patents and/or trademarks and 0 otherwise
JOÃO MARIA A.JORGE FINANCIAL CAPITAL AND ACCELERATORS
29 Social Media and Website
(WEBSITESOCIALMEDIA)
Dummy variable equalling 1 if the firm has website and/or Facebook/Twitter/LinkedIn and 0 otherwise
Number of Founders
(LNNRFOUNDERS)
Natural logarithm of the number of founders of the start-up
Start-up’s Age
(LNAGESTARTUP)
Natural logarithm of the start-up’s age
Previous Accelerators
(PREVACCELERATED)
Dummy variable equalling 1 if the start-up has been accelerated before and 0 otherwise
Profitability
(profitability_dum1): dummy variable codded 1 for profitability between 0% and 5%;
(profitability_dum2): dummy variable codded 1 for profitability between 6% and 10%;
(profitability_dum3): dummy variable codded 1 for profitability between 11% and 15%;
(profitability_dum4): dummy variable codded 1 for profitability between 16% and 20%;
(profitability_dum5): dummy variable codded 1 for profitability higher than 20%;
(profitability_dum6): dummy variable codded 1 for negative ROI);
and 0 otherwise.
Founders’ Gender
(LNMALE)
Natural logarithm of the number of male founders
Founders’ Entrepreneurial Experience
(ENTREPEXPER)
Dummy variable equalling 1 if, at least, one founder per firm reported entrepreneurial experience and 0 otherwise
30
Table 4: Descriptive statistics at the start-up’s level
Observations Percent Mean S.D. Min. Max. Accepted 0 2,729 79.47% - - - - 1 705 20.53% - - - - Total 3,434 100% - - - - Own Equity ($) 3,434 - 144,884.2 1,761,877 0 70,000,000 Outside Equity ($) 3,434 - 337,975.9 10,700,000 0 517,000,000 Debt ($) 3,434 - 137,045 2,907,184 0 122,000,000 Own Equity (%) 3,434 - 62.90 48.31 0 1 External Equity (%) 3,434 - 3.35 17.99 0 1 Debt (%) 3,434 - 1.71 13 0 1 Size 3,434 - 33 1,055.26 0 56,500 Revenues ($) 3,434 - 292,913.3 4,885,584 0 203,000,000 Intellectual Property 0 1,615 47.03% - - - - 1 1,819 52.97% - - - - Total 3,434 100% - - - - Website/Social Media 0 359 10.45% - - - - 1 3,075 89.55% - - - -
Founders’ Job Experience
(JOBEXPER)
Dummy variable equalling 1 if, at least, one founder per firm, reported previous job experience and 0 otherwise
Founders’ Education Level
(Higheducation): dummy variable codded 1 for start-ups which reported, at least, one founder with bachelor/master/doctoral degree;
(Mediumeducation): dummy variable codded 1 for
start-ups in which founders reported
highschool/vocational degree as the highest education level completed;
(Loweducation): dummy variable codded 1 for founders who elementary/primary school is the highest level of education completed;
JOÃO MARIA A.JORGE FINANCIAL CAPITAL AND ACCELERATORS 31 Total 3,434 100% - - - - Number of Founders 3,434 - 3 2.95 1 103 Start-up´s Age 3,434 - 2.67 3.2 0 37 Prior Accelerators 0 2,169 63.16% - - - - 1 1,265 36.84% - - - - Total 3,434 100% - - - - Sector of Activity Agriculture 586 17.06% - - - - Artisanal 77 2.24% - - - - Culture 36 1.05% - - - - Education 528 15.38% - - - - Energy 202 5.88% - - - - Environment 149 4.34% - - - - Financial Services 408 11.88% - - - - Health 370 10.77% - - - - Housing Development 47 1.37% - - - - Information and Communication Technologies 292 8.50% - - - - Infrastructure/facilities development 32 0.93% - - - - Other 488 14.21% - - - -
Supply Chain Services 67 1.95% - - - -
Technical Assistance Services 34 0.99% - - - - Tourism 66 1.92% - - - - Water 52 1.51% - - - - Total 3,434 100% - - - - Profitability 0%-5% 922 26.85% - - - - 6%-10% 279 8.12% - - - - 11%-15% 211 6.14% - - - - 16%-20% 261 7.60% - - - - >20% 451 13.13% - - - - Negative ROI 1,310 38.15% - - - -
32
Table 5: Descriptive statistics at founders’ level
Observations Percent Mean S.D. Min. Max. Age of Founders (years) 3,434 - 35.6 8.76 20 69 Gender of Founders 7,737 100% - - - - Male 5,717 72.03% 1.6 0.94 0 3 Female 2,220 27.97% 0.65 0.75 0 3 Total 7,937 100% - - - - Previous Entrepreneurial Experience 0 1,132 32.96% - - - - 1 2,302 67.04% - - - - Total 3,434 100% - - - - Previous Job Experience 0 276 8.04% - - - - 1 3,158 91.96% - - - - Total 3,434 100% - - - - Education Level High 3,131 91.17% - - - - Medium 295 8.59% - - - - Low 8 0.23% - - - - Total 3,434 100%
JOÃO MARIA A.JORGE FINANCIAL CAPITAL AND ACCELERATORS
33
Table 6- Impact of the total amount of own equity, external equity and debt on the probability of the start-up being accepted in accelerators
Logit Probit
VARIABLES accepted accepted accepted accepted accepted accepted lntotalownequity 0.047** 0.038* 0.038* 0.029*** 0.023** 0.023* (0.020) (0.021) (0.021) (0.011) (0.012) (0.012) lntotalexternalequity 0.080*** 0.068*** 0.069*** 0.046*** 0.040*** 0.040*** (0.012) (0.014) (0.014) (0.007) (0.008) (0.008) lntotaldebt 0.037** 0.026* 0.027* 0.022*** 0.016* 0.016* (0.015) (0.015) (0.015) (0.009) (0.008) (0.009) lnsize 0.009 0.005 0.007 0.006 (0.065) (0.066) (0.038) (0.038) lnrev 0.057*** 0.056*** 0.032*** 0.032*** (0.016) (0.016) (0.009) (0.009) intproperty -0.215* -0.215* -0.117* -0.114 (0.123) (0.125) (0.070) (0.071) websitesocialmedia 0.623** 0.571** 0.322** 0.298** (0.261) (0.261) (0.142) (0.142) lnnrfounders -0.072 -0.141 -0.042 -0.082 (0.099) (0.108) (0.055) (0.060) lnagestartup -0.179* -0.166* -0.100* -0.095* (0.097) (0.097) (0.055) (0.056) prevaccelerated 0.363*** 0.344*** 0.205*** 0.194*** (0.117) (0.119) (0.066) (0.066) profitability_dum1 -0.178 -0.147 -0.099 -0.083 (0.145) (0.147) (0.082) (0.082) profitability_dum2 -0.624*** -0.589** -0.360*** -0.337** (0.239) (0.248) (0.134) (0.137) profitability_dum3 -0.199 -0.167 -0.101 -0.084 (0.242) (0.247) (0.128) (0.131) profitability_dum4 -0.696*** -0.676*** -0.378*** -0.366*** (0.225) (0.231) (0.123) (0.126) profitability_dum5 -0.519*** -0.502*** -0.268*** -0.260** (0.191) (0.192) (0.104) (0.105) lnmale 0.239** 0.132** (0.109) (0.061) entrepexper -0.026 -0.017 (0.127) (0.073) jobexper -0.230 -0.130 (0.230) (0.128) higheduc 14.439*** 5.251*** (0.649) (0.206) mediumeduc 13.910*** 4.953*** (0.569) (0.175) Constant -2.896*** -3.360*** -17.590*** -1.692*** -1.956*** -7.081*** (0.588) (0.780) (1.007) (0.332) (0.435) (0.480)
34
Observations 3,019 3,019 3,019 3,019 3,019 3,019
r2_p 0.180 0.197 0.202 0.181 0.197 0.202
Note: The table evaluates the impact of the start-up’s level of capital (own equity, external equity and debt), the impact of several start-up’s characteristics (country of headquarters, social media and website, intellectual property, previous accelerators, number of founders, revenues, and size) and founders’ characteristics (age of founders, gender, previous entrepreneurial experience, previous job experience and education level) on the probability of the start-up being accepted in accelerators. All regressions include controls for fixed effects at program accelerator and country headquarters. Robust standard errors with clusters for accelerator program, for the Logit and Probit estimates, are in parentheses. ***Statistical significance at 1%, **statistical significance at 5%, *statistical significance at 10%.
Table 7- Impact of a start-up´s capital structure on the probability of the start-up being accepted in accelerators: Logit model
VARIABLES accepted accepted accepted accepted accepted accepted externalequitypercent 0.431* 0.358 0.350 0.134 0.158 0.148 (0.238) (0.222) (0.226) (0.245) (0.231) (0.236) ownequitypercent -0.576*** -0.410*** -0.416*** (0.120) (0.129) (0.132) debtpercentage -0.366 -0.390 -0.442 (0.419) (0.420) (0.434) lnsize 0.068 0.063 0.041 0.035 (0.063) (0.064) (0.064) (0.065) lnrev 0.070*** 0.069*** 0.065*** 0.063*** (0.016) (0.016) (0.016) (0.016) intpropert -0.142 -0.144 -0.177 -0.179 (0.124) (0.126) (0.121) (0.123) websitesocialmedia 0.681** 0.624** 0.670** 0.608** (0.264) (0.262) (0.267) (0.264) lnnrfounders -0.016 -0.107 -0.041 -0.124 (0.093) (0.103) (0.097) (0.106) lnagestartup -0.125 -0.108 -0.142 -0.126 (0.092) (0.092) (0.092) (0.093) prevaccelerated 0.395*** 0.379*** 0.375*** 0.356*** (0.115) (0.116) (0.115) (0.117) profitability_dum1 -0.281** -0.250* -0.232* -0.199 (0.133) (0.135) (0.139) (0.141) profitability_dum2 -0.767*** -0.722*** -0.730*** -0.689*** (0.241) (0.248) (0.241) (0.249) profitability_dum3 -0.345 -0.305 -0.295 -0.258 (0.235) (0.240) (0.238) (0.244) profitability_dum4 -0.844*** -0.822*** -0.788*** -0.763*** (0.207) (0.212) (0.216) (0.222) profitability_dum5 -0.685*** -0.665*** -0.604*** -0.585*** (0.184) (0.186) (0.185) (0.186) lnmale 0.279** 0.260**