i
Exploring market designs for local energy markets:
Core functionalities and value proposition in the context of
blockchain, IoT and prosumers
Guilherme Fael de Oliveira Tavares
Dissertation written under the supervision of Professor René Bohnsack.
Dissertation submitted in partial fulfilment of requirements for the MSc in
Management, at Universidade Católica Portuguesa
1
Abstract
This dissertation aimed to assess the impact of innovative smart market solutions and Blockchain technology on achieving efficient localized energy markets. Trends suggest the future of renewable energy generation will involve a move away from centralized power plants, and towards a large number of smaller generation units, such as PV cells. There are clear synergies between the market dynamics of photovoltaic systems and Blockchain-enabled smart markets, which can be harnessed towards integrating new consumption patterns and energy sources, as well as connecting consumers. Successful business strategy to integrate these technologies can lead to market leadership in this new industry. Captivating consumers is a key determinant of success, and offering lower electricity prices a necessary condition. For such offering to be feasible, markets need to be more efficient, as smart microgrids are proving to be.
Consequently, there came the interest to see how new local electricity markets could be set up, while taking advantage of decentralization. A peer-to-peer, auction-based, local energy market was idealized and various simulations of were ran with differing levels of participants and structure, to understand the impact on the price of electricity achieved by the market. Market size and structure were both shown to affect price at different magnitudes, suggesting an ideal setup of 25-40 participants with generation capabilities over 60% of demand. Further analysis was undertaken to understand the impact of smart meters and Blockchain integration in such a market. Afterwards, conclusions were compiled and recommendations provided for how to approach new practical implementations.
Esta dissertação teve como objetivo avaliar o impacto de inovadoras soluções de mercados inteligentes e tecnologia Blockchain em mercados locais de energia. Tendencias apontam para que o futuro das energias renovaveis passe por uma maior prevalencia de paineis fotovoltaicos domesticos. As sinergias entre as atuais dinamicas em mercados eletricos e o uso da Blockchain em mercados inteligentes parecem claras, podendo ser aproveitaveis para integrar novos perfis de consumo e conectar consumidores. Sendo um novo segmento, estratégias de mercado bem conseguidas serão essencias para ganhar posição, e a capacidade de angariar consumidores será um indicador crucial de sucesso. Para tal, os mercados têm que ser mais eficientes, algo que se tem revelado factual em casos de micro sistemas.
Assim, criou-se o interesse de perceber como desenhar e implementar mercados localizados de energia que beneficiem desta tendencia de desintermediação. Para tal, um mercado interativo à base de leilões de eletricidade entre consumidores foi idealizado. Posteriormente, este foi simulado repetidamente, com diferentes dimensões e estruturas, a fim de perceber o seu impacto nos preços médios alcançados. Foi mostrado que tamanho e composição afetam os preços em magnitudes diferentes, sugerindo uma dimensão ideal de 25-40 participantes, com capacidades de autogeração superiores a 60%. Análises posteriors foram desenvolvidas de modo substantive, para avaliar o impacto de contadores eletricos inteligentes e integração da Blockchain neste tipo de mercado. Finalmente, conclusões foram reunidas e transformadas em recomendações para futuras implementações práticas.
2
Table of Contents
ABSTRACT ...1 TABLE OF CONTENTS ...2 ACKNOWLEDGEMENTS ...3 LIST OF TABLES ...4 LIST OF FIGURES ...4 1: INTRODUCTION...5 1.1 MOTIVATION ... 5 1.2 RESEARCHGOAL ... 71.3 ACADEMICANDPRACTICALRELEVANCE ... 8
2: LITERATURE REVIEW ... 10
2.1RENEWABLEENERGYANDMARKETDESIGN ... 10
2.1.1 Current Trends in Photovoltaic Systems ... 10
2.1.2 Prosumers and Market Management ... 11
2.1.3 Smart Microgrids ... 12
2.1.4 Market Design ... 13
2.1.5 Platform Strategies ... 14
2.2BLOCKCHAIN ... 16
2.2.1 Blockchain Value Proposition... 16
2.2.2 Blockchain Architecture ... 17
2.2.3 Smart Devices and the Internet of Things ... 18
2.3LOCALENERGYMARKETMANAGEMENT ... 20
2.3.1 Local Energy Markets ... 20
2.3.2 Blockchain-Powered Energy Markets ... 21
2.3.3 LEM and Reductions in Equilibrium Price ... 22
2.3.4 Peer-to-Peer Market Model ... 23
2.3.5 Market Structure and Impact on Price Fluctuations ... 24
2.3.6 Blockchain and IoT Affect Market Effectiveness ... 25
3. METHODOLOGY ... 26 3.1DATASETDESCRIPTION ... 26 3.1.1 Sample ... 26 3.1.2 Variables of study ... 26 3.1.3 Univariate Analysis... 28 3.2SIMULATIONSETUP ... 31 3.2.1 Auction mechanism ... 31 3.2.2 Optimization problem ... 32 3.2.3 Agent behavior ... 33
3.2.4 Data Preparation and Implementation ... 34
4. RESULTS AND DISCUSSION ... 36
4.1MAINRESULTS ... 36
4.2GRIDSIZEIMPACTONMARKETEFFICIENCY ... 38
4.3GRIDSTRUCTUREIMPACTONMARKETEFFICIENCY ... 39
4.4HETEROGENEOUSMARKETSTRUCTURESPERFORMBEST ... 41
4.5TECHNOLOGYINLOCALENERGYMARKETS ... 43
5. CONCLUSIONS ... 46
5.1GENERALCONCLUSIONS ... 46
5.2LIMITATIONS ... 47
5.3CONTRIBUTIONSANDFURTHERRESEARCH... 48
3
Acknowledgements
As I conclude this dissertation and approach the end of my Master program, I reflect back on my experience and those who had a large impact in it. I realize I could not have overcome the challenges faced during this journey alone, without the help of friends, mentors and role-models I had the luck of having by my side.
Firstly, I would like to thank my parents for their unwavering support and motivation. Their positivity and all the opportunities they have provided me with have helped shape the person I am today and for that I will be eternally grateful.
Moreover, I would like to thank my advisor, Professor René Bohnsack for all his contributions. Through his guidance, creativity and availability, as well as his extensive knowledge on the topic, he challenged me to continuously improve my work.
Furthermore, a big thank you to my colleagues at the Smart City Innovation Lab (SCIL) who supported me with their advice, expertise and large pool of knowledge.
Last but not least, to my friend their all their encouragement and support throughout. You were an integral part this journey and I hope I can one day be there for you as you were for me.
4
List of Tables
Table 1 – Market Coring Analysis…….………..13
Table 2 – Proposed Platform Functionality and Features………13
Table 3 – Comparison of Projects………....18
Table 4 – Descriptive Statistics for Average Monthly Electricity Data………...26
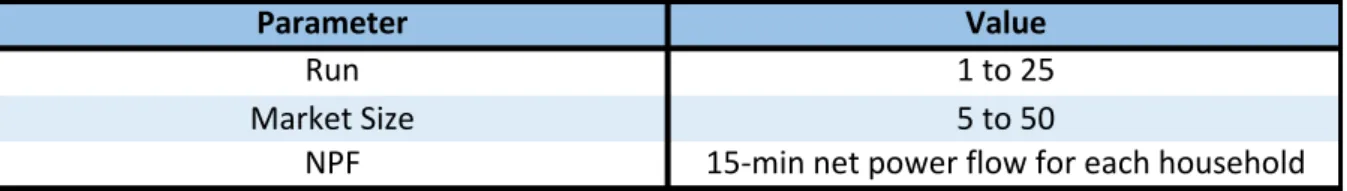
Table 5 – Inputs Used for Simulation………..31
Table 6 – Week to Weekend Price Comparison……….……….35
Table 7 – Price Comparison of Different Levels of Generation Capacity………...37
Table 8 – Advantages and Disadvantages of Blockchain Implementation in LEM…………42
List of Figures
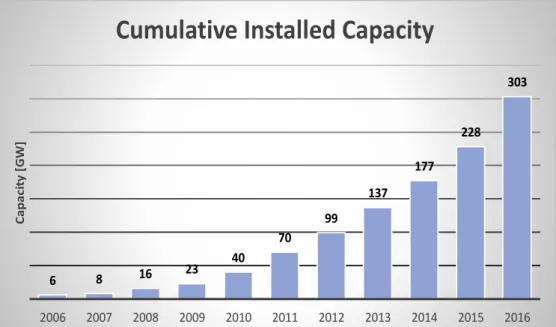
Figure 1 – Cumulative Worldwide Installed Generation Capacity (source: adapted from Ren21 GSR 2017) ……….………2Figure 2 – Summarized Research Flow……….………….………...4
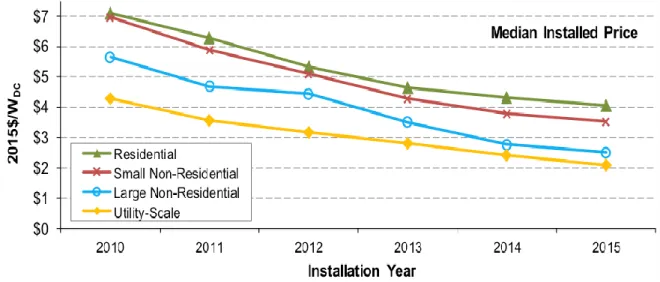
Figure 3 – Installed PV Price per Watt with 2015 base (source: BerkeleyLab, 2016)…..……8
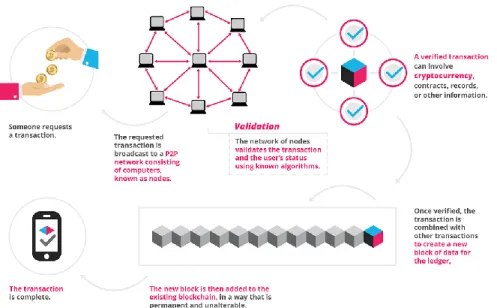
Figure 4 – Blockchain Transaction Process (source: Blockgeeks, 2016)...…………15
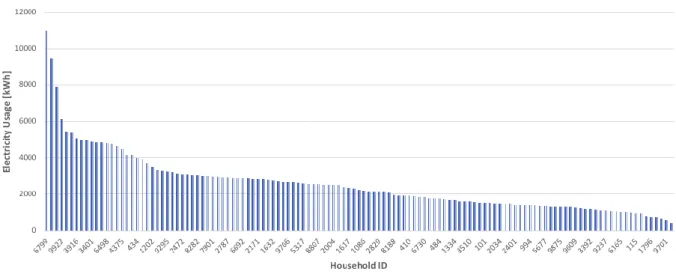
Figure 5 – Consumer Monthly Electricity Use………...25
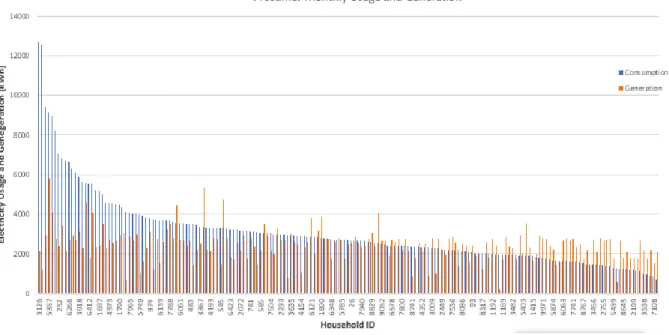
Figure 6 – Prosumer Monthly Electricity Use and Generation………26
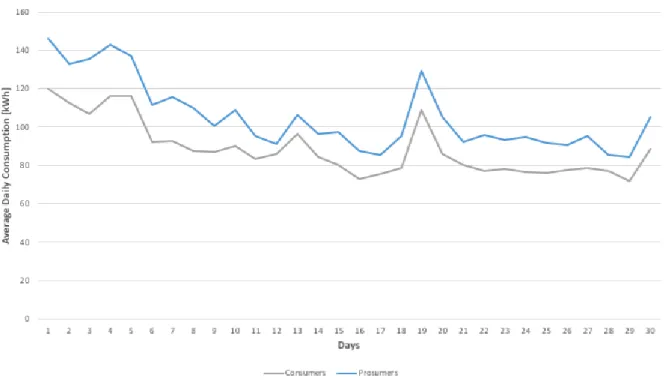
Figure 7 – Average Daily Electricity Usage for April 2016………27
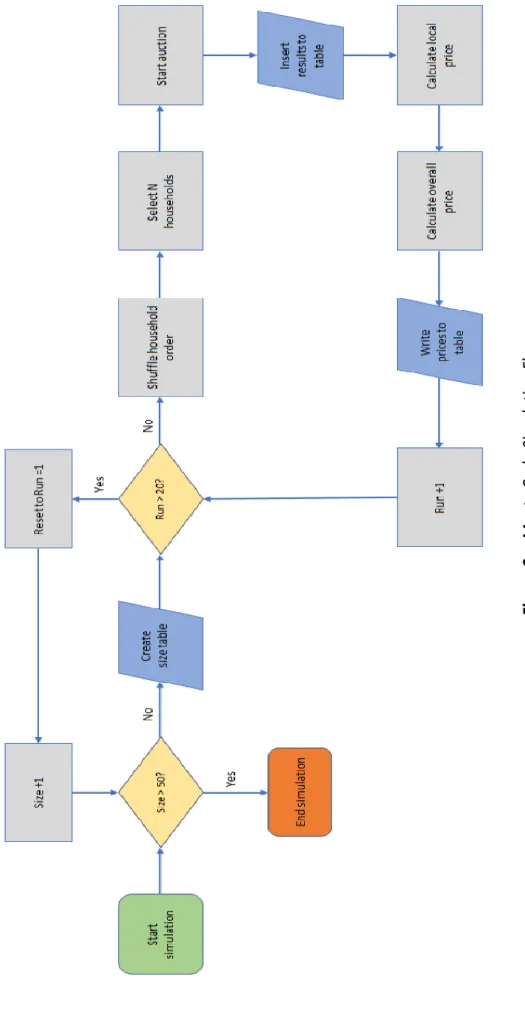
Figure 8 – Monte Carlo Simulation Flow………32
Figure 9 – Relative Frequency of Observed Equilibrium Prices……….33
Figure 10 – Average Daily Prices Resulting from Simulation………....34
Figure 11 – Average Electricity Prices per Unit of Market Size……….36
Figure 12 – Average Equilibrium Price Comparison, by Generation Percentage…………...38
5
1: INTRODUCTION
The following section offers a brief introductory contextualization of the topic and formulates the case study to be posteriorly analyzed. Additionally, the research goal and process are described, culminating with insights into how such research is significant and contributes to the overall body of literature on the topic.
1.1 MOTIVATION
“Climate change is destroying our path to sustainability. Ours is a world of looming challenges and increasingly limited resources. Sustainable development offers the best chance to adjust our course.” (Ban Ki-moon, 2012).
Development of new sustainable approaches to business management in a way that generates economic and social progress has become a crucial point of focus around the world. However, while the importance of environmental conditions and mitigation of climate change have also gained increased notoriety, infrastructural change is often slow. Fossil energy, including coal, oil and natural gas still accounts for over 80% of global energy consumption (WorldBank, 2015a). Large environmental impacts have also become more notorious in recent years, contributing to higher levels of awareness towards the need for wider use of renewable energy sources(RES).
Countries and organizations have defined targets for low carbon growth, notably the 2015 Paris agreement whereby members of the United Nations Framework Convention on Climate Change set the goal of keeping average global warming below 2 degrees Celsius, or a legally binding EU target according to which 20% of the total energy consumption of the EU must come from renewable sources (Tampakis et al., 2013). Another encouraging indicator is that various developing countries are currently setting the standard in terms of production and installation of RES.
The U.S Energy Information Administration (EIA) identifies renewables as the world’s fastest-growing energy source, with consumption predicted to increase, on average, 2.3% each year between 2015 and 2040. This catch-all definition of renewables includes solar, maritime, hydro, wind, geothermal and bioenergy sources. Worldwide, these sources currently account for approximately 19% of total final energy consumption (WorldBank, 2015b). Solar energy generation systems have received a greater deal of attention lately, with total installed solar generation capacity exponentially increasing from 38.4 gigawatts in 2010 to a projected 306.3
6
gigawatts in 2017 (U.S. EIA, 2017). Figure 1 highlights the evolution of worldwide PV installed capacity. As for electricity generation from solar energy, 315.5 billion kWh are predicted to be generated in 2017, up from 32.9 billion kWh in 2010.
However, various problems have begun to become, as handicaps in the systems become more serious as the number of users increases. In that sense, expectations are increasingly placed on Blockchain as a driver of this energy revolution and enabler of various new systems of grid interaction. By acting as a secure and tamper-proof digital record of transactions through a decentralized system of Peer-to-Peer (P2P) interactions, it results in an immutable decentralized ledger that increases transparency and enables various automation mechanisms through the use of smart meters and contracts, which can be coded for virtually any goal.
The energy sector has been innovative in its experimentation of Blockchain integration and creation of diverse pilot projects. Trading platforms for agents in wholesale markets have been gaining steam lately (PONTON, 2017). Platforms focused on setting up the infrastructure to allow machine to machine communication and control through the development of smart homes have also gained notoriety (Jarvenpaa et al., 2016). Perhaps the most futuristic concept, the P2P trading concept (Mengelkamp et al., 2017) gives prosumers the power to allocate their resources and energy usage according to market mechanisms. These systems enable automatic trading of electricity not only between individual prosumers but also with the grid. The current
6 8 16 23 40 70 99 137 177 228 303 2006 2007 2008 2009 2010 2011 2012 2013 2014 2015 2016 C a p a ci ty [ G W ]
Cumulative Installed Capacity
7
promise of Blockchain, the widespread possibility of applications and uses it offers, is also its current main barrier to development, as more questions are created than answered. There is a wide scope of proposed and implemented solutions and business models, however most are tailored to individual needs and specific use cases and rarely scalable. The energy sector appears poised to suffer radical changes and therefore emerges as a very interesting case study.
1.2 RESEARCH GOAL
As Blockchain technology matures and further real-world applications are tested, it is expected that more in-depth research will be conducted on the transition towards decentralized energy markets and its enabling factors. This study seeks to assist the interconnection of smart homes, electricity markets and Blockchain-solutions in the context of local electricity markets. A Monte Carlo simulation of an idealized market mechanism will be assessed in differing settings of size and household profiles with the objective of measuring the impact of different setups on overall equilibrium price of electricity within the market. As such, there will be an analysis of methods to increase local energy market efficiency and foster quicker widespread adoption of such mechanisms by boosting the incentives for new adopters through lower electricity prices.
Research conducted throughout also aims to help address some gaps in the literature regarding Blockchain technology, focusing on its usage as a tool to automate smart markets. A conceptual use case in the shape of a P2P local energy market will be proposed as a starting point. While the technological development of average households through installation of smart meters and connection to Blockchain-enabled markets presents a great deal of advantages, there are also various types of costs, which will be evaluated. As such, the central research question of this study will be:
Which opportunities arise for the energy industry through the rise of Blockchain technology, IOT and prosumersand what is the impact on the business case for local energy markets?
Several findings will stem from this research. Firstly, an optimal market dimension will be evaluated based on the electricity prices resulting from simulations with different households and market sizes. Moreover, an optimal market structure will be suggested, based on the simulation setups that achieve higher levels of market efficiency. Subsequently, Blockchain tools will be evaluated on their ability to automate market function and enable automatic supply and demand matching. Given the high degree of complexity of energy
8
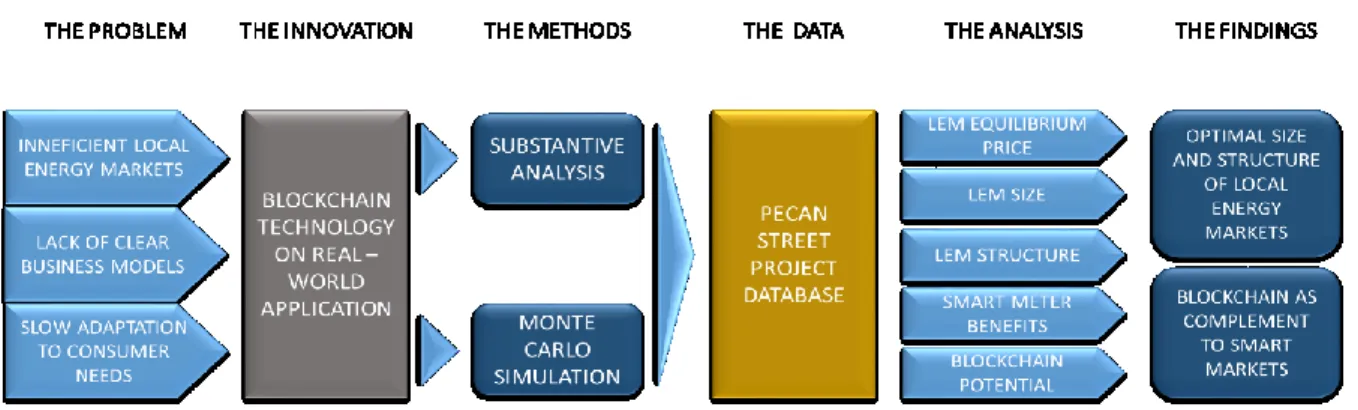
networks and grids, associated with high variance of emission factors, this study will be focused on final energy demands, rather than their environmental impacts. Figure 2, below, summarizes the research flow.
1.3 ACADEMIC AND PRACTICAL RELEVANCE
The methodological use of a Monte Carlo simulation leads to results which can be generalized to larger segments of population, outside of the ones considered in this study. That benefit is two-fold, as the achieved results will be of significance to various stakeholders in the sector and can therefore be used as a starting point for more in-depth studies into the topic.
On a second level, the analysis of decentralized market mechanisms involves a critical look into the current roles of various players in the sector and posterior discussion of their relevance and contributions. The need for intermediaries is greatly reduced in the proposed market setup, which helps combat excessive management costs, reduce inefficiencies and save time. Therefore, it is of the utmost importance to understand the impact of technological advances on household management and market functioning, analyzing them not only from a theoretical basis but also in terms of utility and associated efficiency gains. It is expected that as prevalence of these management tools proliferates, decentralized markets will become increasingly more efficient and cost-effective. As such, the disruptive potential of said decentralization should become clear, as it is predicted to lead to vastly altered service offerings and value propositions. These insights result therefore in various contributions to academia and further research developed in the future. Current literature on Blockchain technology is still vague and the reader is faced with a multitude of different analyses and points of focus. Therefore, this thesis
9
has the first focus of adding context and facilitating the comprehension of what a Blockchain actually is. As for Blockchain uses in the RE sector, literature on the topic is predictably even more scarce and focused on a limited number of scenarios. As such, this paper also intends to help bridge the gap between basic understanding of Blockchain technology and practical implementations in the sector. Lastly, the elaboration of a comprehensive use case in the shape of an idealized market mechanism should offer added insights into various possible setups and associated strategical trade-offs.
10
2: LITERATURE REVIEW
This chapter reviews the existing literature on the changing dynamics of RE markets and the possibilities created through the incorporation of Blockchain technology. Since this specific topic is relatively new and under-researched, a comprehensive literature review took place as a starting point to address the research question. It has been divided into 3 major topics, which ultimately have an overarching impact on the challenges faced in the field.
Firstly, it will examine the changing consumption patterns of average consumers, looking at enabling factors, current management mechanisms and barriers to be overcome. Such insights will help understand the motives and processes through which grid interactions are changing, arriving at the concept of microgrids and local energy markets (LEM). A strategic analysis of market design and platform development are also included. A second level of analysis will be focused on Blockchain technology, going from simple analysis into the concept and function of this innovation to a more in-depth look into how its potential can be harnessed in the scope of local renewable energy markets. Lastly, the previous two points will be allied with new technological breakthroughs, enabling further research into the efficiency and price constraints of localized electricity exchanges. Such research will then allow for a clearer picture of strong and weak points of existing projects and setups in the field and help derive general conclusions for how new local markets should be set up and variables to account for. Simultaneously, a comprehensive set of hypotheses to be tested will be presented throughout the section, culminating with a conceptual model of market organization and functioning.
2.1 RENEWABLE ENERGY AND MARKET DESIGN
Firstly, there came the need to understand the RE market at a global level and the shifts in preferences displayed by consumers. Building upon this knowledge, a brief overview into market design and platform strategies will be used as the starting point for platform ideation.
2.1.1 Current Trends in Photovoltaic Systems
Solar energy generation involves the use of the sun’s energy to provide hot water via solar thermal systems or electricity via photovoltaic (PV) and concentrating solar power (CSP) systems (Ellabban et al., 2014). The cost of producing solar energy through PV systems has been decreasing in the past few years, as knowledge increases and economies of scale and
11
scope come into play. Currently, domestic PV systems can achieve costs of 10 cents per kWh, with large scale infrastructures going as low as 4 cents per kWh (Jones-Albertus et al., 2016). This represents a massive improvement from the average costs of 20 cents per kWh just ten years ago (Breu et al., 2008), enabling PV systems to rival and even outperform the consumer costs of utility power around parts of the developed world. Figure 3 details the trends for installed production in terms of price per Watt.
Households are a key part of this progression towards renewables, representing 25% of final energy consumption (Eurostat, 2017a). The increasingly similar prices between domestic PV and utilities (Timilsina et al., 2012), due to rising electricity costs (Eurostat, 2017b), appear to drive transformations in the energy system. The scalability of PV technology and installations, consequent cost reductions (Delucchi & Jacobson, 2011), increased citizen awareness and interest in the sector(Rai & Robinson, 2015) also play a significant role.
2.1.2 Prosumers and Market Management
As domestic generation prices decrease (Karakaya et al., 2015), the concept of the prosumer becomes a central point when analyzing how consumers interact with the grid and traditional stakeholders. Alvin Toffler (1980) is considered to be the creator of the term “prosumer”, dedicating extensive attention to it in The Third Wave. While there is not a single catch-all definition, prosumers are considered to be “those who are simultaneously involved in
12
both production and consumption” (Ritzer, 2010). In the context of RE markets and in the interest of clarity, a prosumer will be considered a consumer who also produces some of his electricity (Masson et al., 2014), resulting in different socio-economic incentives and a systemically different relationship to the grid.
Various approaches regarding grid interactions have been tested, as a method for aggregating prosumers and guiding their relationships to each other and the grid. By design, these models also attempt to encourage the installation of domestic PV systems by offering favorable pricing schemes. The most common mechanisms are net metering, net purchase and
sale and feed-in-tariffs (FiTs). All three have some particularities that influence the overall
levels of welfare created and prices achieved (Yamamoto, 2012) and there is no single, clear-cut best mechanism.
Recent studies (Eid et al., 2014) highlighted that high renewables penetration can create uncertainty regarding savings from the installation of residential PV. Darghouth, Barbose & Wiser (2014) identified 3 main sources for such uncertainty:
Electricity market development can lead to changes in retail electricity pricing (Bohne, 2011);
Retail rate structures available to prosumers are generally benefic (Ossenbrink, 2017) as a way to boost adoption, but that could change as market penetration increases; Shift away from net-metering and towards other compensation mechanisms.
This line of reasoning leads to what is currently the biggest barrier to wider adoption, the individual nature of energy management (Karnouskos, 2011), as each node is disconnected and lacks the capabilities to cooperate with other nodes. This issue arises from the difficulty of load-matching, since periods when energy generation is highest rarely coincide with those of major energy usage. This results in inefficiencies in energy systems (Widén et al., 2009), as production is usually too high during base-load and insufficient during peak-load.
2.1.3 Smart Microgrids
Microgrids have been developed as an economically viable alternative (Mahmoud et al., 2014) to reliably supply energy to end-consumers (Watson et al., 2006). One of their main advantages is additional flexibility resulting from two possible operational modes (Asmus, 2010), a grid-connected one and an autonomous mode that is decoupled from the grid (Su & Wang, 2012). Further research (Huang et al., 2011; Olivares et al., 2014) lead to the analysis
13
of 5 deployment modes, with this study focusing on “household” and “community” modes, which are characterized by smaller network sizes and arise from a general desire for cost-savings, self-reliance (Walker & Cass, 2007) and reduced dependence on utilities.
Further technological advances enabled the creation of smartgrids, highly complex ecosystems of heterogeneous entities which interact to achieve a certain functionality (Bichler et al., 2010). More in-depth, they are essentially optimization-based mechanisms which make use of computational power to follow constraints and optimize outcomes (MacKie-Mason & Wellman, 2006, ch. 18). Ideally, smart grids are in automated in some form, to decrease decision times and ensure immediate availability of resources. In that sense, they are expected to limit human interaction by automatically analyzing and responding to network changes (Wang et al., 2011) in short time frames. This feature appears to be key, as creation of markets where users interact based on their self-interest raises the issues of trust and accuracy (Vytelingum et al., 2010), be it in meter data reporting or electricity transactions.
However, due to their design, current iterations of smartgrids require a minimum number of consumers to be economically viable (Kriett & Salani, 2012), meaning that scalability concerns are still present. This last condition has prompted a variety of different research approaches into how to make microgrids more appealing to prosumers, through a combination of financial, legal and social measures. In that sense, ensuring that microgrids provide lower levels of electricity costs than those offered by the grid seems to be the first required step.
2.1.4 Market Design
In such an innovative and fast-evolving industry segment, market design will become a crucial determinant of success. Use of market design principles is broadly defined as examining “the reasons why markets institutions fail and considers the properties of alternative mechanisms, in terms of efficiency, fairness, incentives, and complexity” (National Bureau of Economic Research, 2013). This concept has been studied and applied across a multitude of markets, notably in the case of electricity auctions (Wilson, 2002), (Liu et al., 2010).
In more practical, management-applicable terms, the focus on market design brought about three key dimensions to consider when developing effective markets and allocation systems (Agrawal et al., 2015). The first consideration is market thickness, that is, whether there are sufficient participants willing to take part in market functioning at a given time and
14
complete transactions between each other. The second point of focus is market congestion, or a lack thereof. In essence, this means guaranteeing that participants are allowed to consider enough alternatives before choosing the one that is ideal for them. This process is mainly ensured through structuring of auction and transaction processes (Akbarpour et al., 2014). Lastly, market participation should be safe and simple when compared to the alternative of transacting outside the marketplace or engaging in strategic behavior that reduces the overall utility attainable inside the market. To appropriately fulfill these requirements, another concept of relevance is the creation of platform strategies.
2.1.5 Platform Strategies
Platform strategies are focused on establishing network effects, in that they revolve around allowing platform participants to benefit from the presence of others (Pisano, 2015). Naturally, such a distinct structure requires the use of alternate tools and frameworks to understand how to create and capture value. Ideation of a platform strategy is generally composed of three distinct steps. The first is identifying the distinct sources of platform value and developing a plan for value creation and capture. After such a process, the emphasis is on creation of the actual platform in a market where none existed, defined throughout literature as “coring the platform”. Lastly, there is the tipping step, where the focus is on growing the platform by levering the advantages provided by early market entrance.
Only when all three of these steps have been undertaken and jointly considered, can a platform leadership strategy appear (Van Alstyne et al., 2016). When applying this strategy, a firm intends to position its product offering as the foundation upon which other products and processes are designed around, leading to an institutional evolution (Bohnsack et al., 2015) This creation of an ecosystem around a product offering is not simple, but most successful companies have followed some common principles:
- Development of technology that is somewhat open, meaning that others can adapt the current offering and independently develop additional applications.
- Modular-built technology, where specific parts can be modified independently. This allows for development to go in a direction not planned in original usage.
- Mechanisms to bring parties together to achieve a common goal or solve a generalized problem.
15
When successful, companies are able to exert influence over the direction of innovation inside their industry, further increasing their importance relative to competitors and providers of complementary services. But becoming a platform leader is not possible to all and nor can all industries create platform leaders. The value proposition is maximized under specific conditions, the fundamental one being that the offered product has limited value when used alone but gains value when used along with other complements. When combined with complementary innovation, platform leadership makes it possible to create scenarios that present a win-win situation for the platform leader, complementary manufacturers and customers.
As such, models and trading systems should be built in a way that ensure all users benefit from added utility resultant from lower net spending in electricity. Development and use of an auction mechanism for electricity transactions appears to be a viable choice towards increasing overall market efficiency. This stems from the fact that competitive bidding between users with a profit-maximizing behavior invariably leads the market towards long-run efficiency (Cramton, 2004). To quantify such an impact, there came the need to test the added overall utility enabled by the creation of a local energy market, by looking at possible price targets. A look into existing literature provided an answer, in the shape of predictive simulations (Mengelkamp et al., 2017) and posterior comparison of achieved equilibrium prices.
A more complete look into this condition and resulting conclusions will be undertaken in later sections, but the main consideration for now is the direct implied relation between lower achieved equilibrium price and business case feasibility. Such a condition will be the focal point of this study, and the business case will be evaluated on the likelihood of achieving equilibrium prices in the LEM that are lower than those provided by the applicable central distribution agent.
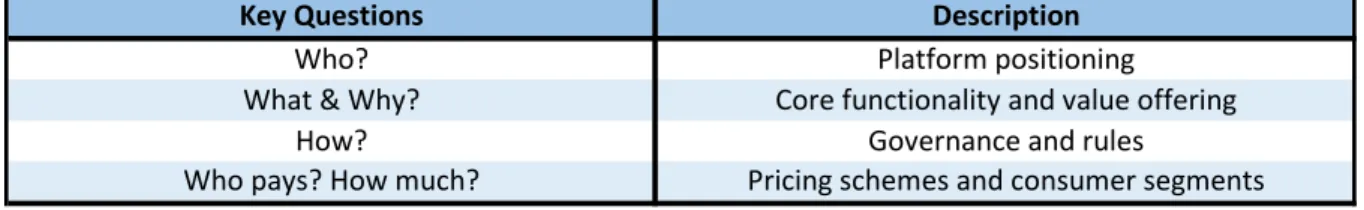
For now, the proposed mechanism will be looked at through a market coring perspective. This framework intends to firmly place the platform at the center of an ecosystem, where consumers and prosumers meet, make connections and transactions (Toppenberg et al., 2016). Given the present context, the posterior focus will be the creation of value through the offering of lower electricity prices than current systems and grid interactions allow. A further narrowing of scope will be undertaken subsequently. As such, the key questions to answer are identified in Table 1.
16
While all the previous points are of the utmost importance, an in-depth analysis into all of them would stretch beyond the scope of this study. Therefore, the focus will be the on the What and
Why portions. Naturally, the remaining questions were considered in a more general
perspective as the basis for the ideation of an effective and efficient platform. Table 2, below, highlights the main features and functionality of the proposed platform.
2.2 BLOCKCHAIN
Arguably the biggest technological advancement of the past decade, the Blockchain was created by a person or group of people only known by the pseudonym Satoshi Nakamoto,
a “purely peer-to-peer version of electronic cash”, as he put it in a paper published in 2008.
2.2.1 Blockchain Value Proposition
Ideated by Namakoto to be the public ledger for bitcoin transactions, it is the technology that enables moving Bitcoin from one person to another, essentially allowing digital information to be distributed but not copied or tampered with. A multitude of use cases and
Key Questions Description
Who? Platform positioning
What & Why? Core functionality and value offering
How? Governance and rules
Who pays? How much? Pricing schemes and consumer segments Table 1 - Market Coring Analysis
Functionality and Features
Local electricity transactions Access to electricity at lower rates Connection to other consumers and prosumers
Smart meter integration Grid-backed stability and reliability
Payment platform Promotion of sustainability
Instant Secure
Simple online interface Individual forecasting
17
potential applications for this technology are currently being developed, ranging from cryptocurrency trading to smart contracts and store of records. Blockchain offers a cheap and reliable method to record financial and operational transactions, making it a plausible alternative to eventually replace part of the utilities’ business by removing the need for a middle man.
In the context of renewables and microgrids, it has the potential to enable a fully integrated trading system that enables participants to trade excess production and load-match more efficiently. However, in the short term, the expected impact is lower, with Blockchain being incorporated as part of the system, rather than as a disruptive innovation. Significant barriers are still prevalent, as Blockchain is largely untested in the RE markets. Gradual development and success cases will be crucial for the establishment of Blockchain models as an integrating part of any smart city grid planning model. On one hand, applications are still somewhat niche-based and localized, leaving the average consumer still uninformed about the possible applications of Blockchain in this industry. Furthermore, government-backed initiatives and incentive models, as well as regulators and current incumbents, will demand clearer applications and well-designed use-cases, to ensure that the benefits outweigh potential costs and the inevitable uncertainty that will need to be navigated. Lastly, industry standards will have to be developed, facilitating the integration between various utilities and geographical locations, which currently act as somewhat isolated nodes in the scenarios where prosumer movements are more evolved. Nevertheless, if Blockchain proves itself capable of scaling to meet market demands, it will usher in an era of a “distributed world”, where large and small power-generation systems coexist and interact efficiently (Basden & Cottrell, 2017).
2.2.2 Blockchain Architecture
“The Blockchain is an incorruptible digital ledger of economic transactions that can be programmed to record not just financial transactions but virtually everything of value.” (Blockgeeks, 2016).
Information present on the Blockchain exists as a shared, decentralized, continuously updated database. Data is not stored in any single physical location, the records are public and easily verifiable, being hosted by millions of computers worldwide, so anyone with an internet connection can check this database and any transaction at will. The main technological breakthrough of such a system is that it circumvents the current need for a bank or any other central entity to act as a trusted middleman and moderate transactions. This shared record book,
18
or distributed ledger, is copied thousands of times and stored across the globe, making it truly decentralized. Additionally, it is immutable, meaning that it is irreversible, so that each data entry exists in perpetuity and can be checked by everyone, but altered by no one. To do so, it relies on public consensus, meaning that if any entity tries to dishonestly change it, the many computers involved in the verification process would reject such a change.
When two parties intend to complete a transaction, it needs to be validated, which is done by miners, people who hold the ledger in their computers. To add the validated transaction to the ledger, the miners compete to find a key through the use of computational power and time where the first one to guess the correct answer is the winning a financial reward, in this case a percentage of a digital coin. Figure 4 presents a simplified visual representation of how a transaction is processed through Blockchain.
2.2.3 Smart Devices and the Internet of Things
In this chapter, the focus will be on analyzing the necessary technologies to bring these projects to life and allow them to scale, as well as understanding how they all work together.
Smart Meters: Although smart meters themselves are not exactly new technology, with the first iterations having been first proposed in the 1970s, they are an integral part of any microgrid managing system. In essence, such a device records consumption of electric energy
19
in pre-set intervals and communicates this data to utilities, having been proved to help reduce electricity expenses by, on average, 3% to 5% (McKerracher & Torriti, 2013). The real innovation comes from the added ability for these meters to handle fluctuations in electricity supply and demand automatically and in real-time, by actively monitoring consumption (Muralitharan et al., 2016), which massively helps with the issue of load-matching and opens the door for the creation of P2P markets. This combination of features essentially enables microgrids to constantly adapt to outside conditions and the number of participants in the system.
Smart Contracts: Smart contracts on the Blockchain help bring this dis-intermediate system to life by avoiding issues in communication and flow of energy (Omohundro, 2014) thanks to the accurate, transparent and automatic system it is based on. The difference between such a technology and a traditional contract is that while both define the rules and penalties around an agreement, the smart contract automatically enforces these obligations for all involved parties.
The Internet of Things (IoT) is also a central concept to this analysis, as connecting a multitude of devices over the internet has proven to be a challenging concept (Spanò et al., 2015), with various barriers. In essence, it aims to develop a system where “physical items are enriched with embedded electronics…and connected to the Internet” (Shrouf et al., 2014). It is, however, essential to create a such a grid of connections to ensure proper management and operation of smart meters. The Ethereum Blockchain can be used to manage IoT devices (Huh et al., 2017), by using smart contracts to define their behavior and coordinate their interactions, allowing them to actively participate in business processes.
Integration of Multiple Microgrids: By relying on such an automated and standardized system, the use of the same Blockchain protocol across various microgrids opens the possibility for features such as demand response mechanisms and capacity reserve markets to be incorporated on a larger scale, effectively integrating smaller microgrids into a larger ecosystem of similarly-minded prosumers.
20
2.3 LOCAL ENERGY MARKET MANAGEMENT
The following section will be focused on the changing dynamics of LEM, which has been boosted by rapidly evolving technological advances. In discussing these concepts, the scope of this study will be narrowed further by incorporating previously discussed topics into the analysis of localized markets and prosumer interactions. A comprehensive set of hypotheses will be created and posteriorly tested analytically.
2.3.1 Local Energy Markets
Local energy markets are a decentralized approach that allow both consumers and prosumers to locally trade renewable-generated electricity. In essence, LEM help maintain a closer balance of supply and demand of electricity in the community, by offering real-time pricing. The European Commission (EC, 2016) defined LEM as “decentralized, smart and interconnected markets”, as they assist domestic energy consumers and prosumers in benefiting from additional flexibility when choosing their energy supply. The creation of such a market mechanism allows connected agents to trade energy with their community, virtually (Lamparter, Becher, & Fischer, 2010). One of the main aims of the establishment of such a marketplace is the reduction of electricity costs for all participants. By having a limited participant base, data-driven processes should become more efficient over time (Wolske et al., 2017), as increasing levels of automation should lead to optimal allocation of electricity. In ideal cases, a cycle of positive reinforcement (Mengelkamp et al., 2017) is created, with the resulting savings in electricity funneled into additional investment in RES, which will once again lead to lower energy prices for the entire community.
In this sense, it becomes necessary to consider two separate theories: Firstly, the Theory of Disintermediation for electronic markets (Chaffey, 2009), which argues that decentralization movements lead to a wide array of cost decreases. The second theory to consider is the Technology Acceptance mode (Surendran, 2012), which defends that perceived ease of use has a strong influence on perceived usefulness. As such, it seems important to consider this model when analyzing software utilization and its link to user performance (Dishaw & Strong, 1999). Therefore, smart meter usage and overall LEM functioning should require a lower level of human input than currently verifiable while, at the same time, providing easy to use interfaces and result-tracking mechanisms.
21 2.3.2 Blockchain-Powered Energy Markets
The first implementation of energy markets making use of Blockchain technology was proposed in 2014. Ever since, extensive amounts of research have gone into energy markets and its various interdependent systems but the current lack of scaled implementations of microgrids across the globe shows that cost-effective models are still rare or inexistent. Nevertheless, the combination of several new technologies presented above can be used to derive new models, using distributed microgrids that enable peer-to-peer (P2P) energy trading through a Blockchain ledger. In that sense, an analysis of current business models, however localized, may provide significant inputs to help understand how to surpass the challenges of creating a standardized mechanism, selling the system and overcoming financing woes. Based on the review set out by Zhang, Wu, Long and Cheng (2017), the most significant projects in the field were identified and briefly compared. A summarized comparison of the different projects can be found on Table 3.
Most projects share common characteristics and can be organized into structured clusters. Piclo, Vandenbron and SonnenCommunity are all regional or national-level platforms that enable P2P energy trading among members and take user of a central entity acting as a supplier. However, these are focused on the strict development of business models and appear incompatible with smaller scale markets. On another hand, projects such as SmartWatts and
Project Country Start year Goals Scale Layers Results
Ulink US 2014 Provide electricity access through microgrids Microgrids Energy Network Standardized development of microgrids Transactive Grid US 2015 Microgrid energy trading using Blockchain Microgrids Energy Network, ICT, Business Automatic energy trading platform PeerEnergyCloud Germany 2012 Cloud-based P2P energy
trading platform Microgrids
Energy Network, ICT
Cloud-based P2P energy trading platform Piclo UK 2014 P2P energy trading
platform National level Business
P2P energy trading platform Electron UK 2016 Blockchain-enabled consumer energy services TBA Energy Network, ICT, Business Under development Vandebron Netherlands 2014 P2P energy trading
platform National Business
P2P energy trading platform SmartWatts Germany 2011 Optimize energy supply
through ICT Regional
Energy Network, ICT
Smart meter control interface SonnenCommunity Germany 2015 P2P energy trading with
battery storage National
P2P energy trading platform
P2P energy trading platform
22
PeerEnergyCloud focus on identifying key ICT technologies for use in P2P LEM. As such, research was focused on technological development, along with the proposal for various market scenarios. Finally, Transactive Grid and Electron pioneer the integration of Blockchain technology to simplify and optimize consumer energy services.
Based on previously discussed insights, it then becomes necessary to address how LEMs can contribute to the quick development of the sector. The advantages enabled by smart markets have been analyzed in the previous section. Localized energy markets manage to conciliate these advantages with the benefits provided by disintermediation and market dynamics. Essentially, the use case for such markets is pretty clear (Parag & Sovacool, 2016), as they enable larger local production and the rise of new prosumers, while also having a key role in addressing climate change concerns. In doing so, they effectively manage to fulfill the rising need for more decentralized and liberal markets, while also harnessing the benefits of smart markets.
Investment in smart technology related to better management of RES has shown a clear upward trend, boasting a 15% year-on-year increase in 2016 (Bloomberg New Energy Finance, 2017). On that same note, $1.4 Billion were invested into Blockchain-related projects in 2016 alone (Cryptocoinsnews, 2016), a clear sign of the added importance being placed on this interaction between technology and energy management. The increasing importance attributed to this interaction leads to a secondary research goal, understanding how Blockchain technology can be used to boost the efficiency of local energy markets. Since the concept of efficiency is hard to quantify directly, a set of hypothesis related to market performance in various scenarios will be presented and posteriorly analyzed.
2.3.3 LEM and Reductions in Equilibrium Price
Going by the points presented throughout the previous section, it becomes clear that one of the major expected impacts of the establishment of local energy exchanges is the reduction of grid variability. A higher degree of grid variability leads to more frequent power outages as peak consumption periods require the adjustment of production capacity, which is still difficult to do accurately and quickly. Aggregation of users has been shown to help reduce said risks of grid variability (American Physical Society, 2011). In that sense, LEMs help smooth out household consumption profiles and therefore reduce the risks of service failures and inadequate or insufficient supply.
23
Coupled with this, another significant consumer-centric movement is taking place. As smartgrids and LEM become more prevalent, the untapped economic potentials of market creation and management become more apparent. While the previous section attempted to provide a general overview of both pre-established and upcoming business models in the sector, most current iterations are still highly location-dependent or focused on pilot studies rather than direct market implementations. However, if market trends are maintained or intensified, and as the novelty wears off, a directly competing determinant of user choice will be the expected cost savings resulting from participation in the LEM and trade with other users (Aguirre & Ibikunle, 2014).
The first approach will be the study of how an increase of market size, in number of participants, contributes to a more efficient market operation due to the added volume of energy transacted and therefore lower equilibrium price. While extreme profit-seeking behavior can impact the overall utility created, added competition should lead to more efficient markets (Haruvy & Popkowski, 2016). Such logic leads to the first hypothesis to be tested:
H1a: An increased size of LEM leads to a reduction in the equilibrium price.
However, an added consideration is important, namely the fact that there is likely an ideal size, after which the marginal gains in market efficiency become smaller as size is further increased. The goal is therefore to find optimal market size that leads to a larger reduction in price and therefore cheaper consumption profiles. In that sense, a subset of the previous hypothesis will need to be analyzed:
H1b: Size increases of LEM will, after a certain point, provide diminishing marginal improvements in the equilibrium price.
2.3.4 Peer-to-Peer Market Model
Before establishing the next set of assumptions, it is important to clarify the concrete market set-up and preexisting conditions which govern the interactions of users among each other and with the grid. P2P energy markets have emerged as another step towards decentralized energy markets. In essence, each individual participant is free to choose where to direct his excess energy and also where to purchase additional energy should his demand be
24
larger than his production. Management questions regarding the interaction between micro and macro grids need to be analyzed in-depth, as the central entity in charge of ensuring supply and offsetting intermittency would be target of scrutiny (Olivares et al., 2014) and require well-defined frameworks. To get around the issue of load matching and network stability, Brusco et al. (2014) defend the aggregation of prosumers into energy districts, each with a coalition manager who is in charge of the optimal operation of the district. Other research (Bernardon et al., 2014) suggests that reconfiguring the distribution network to account for these new types of users is an optimization problem, which can be solved through the development of smart grids. Such developments are enabled by the quick increase in computing power, easier access to information and better automation tools (Bernardon et al., 2014; Karnouskos, 2011). The idealization of a LEM will be based on previous studies (Block et al., 2008) (Lamparter et al., 2010) (Mengelkamp et al., 2017) and centered around the local exchange of electricity produced by PV systems based on a double auction via a closed order book.
2.3.5 Market Structure and Impact on Price Fluctuations
While significant literature has been developed on the efficiency of energy markets, such studies have generally been based off of aggregation at a larger scale, not at a local level. Given this study’s focus on local electricity exchange, it becomes important to assess how smaller aggregations are effected by the volatility of RES and household profiles. As the market mechanism is based on an auction, such an evaluation is particularly crucial. To maximize profit, different household profiles will adopt different bidding strategies to maximize their profit (Prabavathi & Gnanadass, 2015), and therefore affect the equilibrium price in different ways. The general hypothesis to be tested is:
H2a: The structure of a local energy market impacts the degree of equilibrium price reduction.
However, such a hypothesis seems to provide insufficient information regarding how the structure of a market impacts its effectiveness at achieving lower prices. As such, further hypotheses have to be tested:
25
In a logical sense, this hypothesis appears to be straightforward, as markets made up of only prosumers, all with electricity generation capabilities leads to lower external energy needs and therefore lower likelihood of unfulfilled market orders. The incentives for each household also become more closely tied together, which should lead to similar utility functions. The final step was understanding how structure and size interacted and identifying the key conditions to ensure below-average market prices
H2c: Heterogeneous structures in LEM achieve larger price reductions per unitary increase in market size.
2.3.6 Blockchain and IoT Affect Market Effectiveness
To further complete this study, it felt necessary to study the effects of technological advances on smart markets and overall grid equilibrium price. While a great part of this evaluation will be mainly based on an exploratory analysis, a few keys benefits can be somewhat quantified. One of the key innovations in the development of local markets is the rise of smart meters, that enable instantaneous metering and net power flow evaluation, as well as a facilitation of further electricity exchanges throughout. In that sense, the hypothesis to test will be related to how the presence of smart meters in a local market helps decrease price:
H3: LEM where users own smart meters benefit from larger decreases in equilibrium price.
As for the impact of Blockchain, the main benefits are complete automation and replacement of manually performing-aggregators with a fully decentralized decision system. This helps reduce socioeconomic and research costs linked to intelligence systems, as well as eliminate the coordination costs between generator and retailer (Bosco et al., 2016). In the case of a local market, this enables bundle-formation and prediction algorithms to be updated in real-time and more accurately reflect power flow fluctuations. Furthermore, the possibility of setting up smart contracts allows for better monitoring and reporting tools, which are useful to consumers in reducing expenditure and ensuring a simpler access to information. Lastly, one has to consider the benefits provided by the Blockchain in easily connecting a larger number of market participants, functioning as a market coupling mechanism (Keppler et al., 2017). Such a premise will be studied through a purely exploratory hypothesis:
26
3. METHODOLOGY
3.1 DATASET DESCRIPTIONData used throughout this study is made up of recorded household electricity production and consumption data in 15-minute intervals, measured in kilowatt hours (kWh). It originates from the ‘Pecan Street’ project, which aims to advance and facilitate research and innovation in the energy field. Formed in 2010, it consists of a large source of disaggregated consumer energy data, provided by a network of volunteer households mainly based in Austin, Texas. The significance for this study is the facilitation of analysis of real-time energy consumption and production, which will be posteriorly used to simulate a market auction and ultimately predict the equilibrium price.
3.1.1 Sample
In keeping within the scope of this study, the aggregation of households in LEM, the focus will be on residential buildings. Pecan Street further divides these buildings into “Single-Family Home”, “Town Home” and “Apartment” segments, however the different typologies will not be looked at individually. The database provided by Pecan Street is currently comprised of around 550 individual houses which were merged with data descriptives collected from Metadata, describing the profile of each household. Posteriorly, conditions such as coincident time periods of study participation, location and entireness of information were used as basic criteria for selection, resulting in a drawn sample of 310 households (Source: Pecan Street Inc. Dataport 2017). Such a sample size ensures that conclusions can be drawn with acceptable levels of confidence and error margins (Schulz & Grimes, 2005).
3.1.2 Variables of study
This section presents and briefly explains the variables of interest to be studied.
Input variables: use, gen, grid.
These three variables are directly drawn from the Pecan Street database and will be the basis for setting up agent utility functions. Use presents electricity demand of a certain time interval, including both self-production and grid purchases. Gen details the electricity generated by a PV system over a certain time interval. Finally, grid identifies energy drawn from the grid over a time interval. It will be used measure the electrical deficit or surplus faced
27
at each period), quantifying the electricity available to be transacted by each agent at every auction round (grid=gen-use).
Market size
An independent variable, market size will be the first variable analyzed to understand how different market sizes affect equilibrium price. Market size will be manipulated at pre-determined intervals, with range being limited between 5 and 50 participant households. Dimensions below 5 were not considered, as results are too dependent on the individual households selected.
Market structure
Three separate profiles (consumer, prosumer and heterogeneous) will be controlled for, to better understand the importance of heterogeneity in such a market. Consumer and Prosumer profiles will be fully made up of households that fall into said characteristics, while Heterogeneous will have a mixture of consumers and prosumers at different levels of representativeness. In running simulations, market structure was quantified in terms of overall electricity generated during the month as a percentage of total monthly electricity demand for all agents participating in that specific simulation. This variable allows for the elimination of some exogenous factors like weather conditions and consumption behavior.
Equilibrium price
The main dependent variable of this study, a brief insight into equilibrium price has been developed in the preceding sections. The equilibrium price will be calculated as the weighted average of all transactions completed in the LEM simulation. Since grid interaction is still present, two different offsets of price results will be achieved: the local price will reflect the average cost of electricity resulting from P2P trades in the market, while the overall price (denomination used interchangeably with equilibrium price) will also be weighted with a percentage of transactions completed with the grid.
28 3.1.3 Univariate Analysis
This section focuses on the analysis of variables selected for simulation at an univariate level. At its core, the goal is to examine aggregate household electricity consumption and production data to create a basis for simulation. Looking into the 125 consumer households present in this sample, the first step was ranking them in descending order of overall usage, as represented in Figure 5.
It is clear that 3 households consume a disproportionate amount of electricity compared to the rest and, furthermore, the top 20% of households account for nearly 40% of total electricity usage. As such, monthly consumer usage data is clearly not uniformly distributed, with a positive skew. The consideration of all households in the sample leads to an average monthly consumption of 2,565 kWh, greatly superior to the average for households in Austin, Texas (Residential Monthly kWh and Bills, data.austintexas.gov). Focusing on the 185 sample prosumers, a similar analysis was conducted. Figure 6 shows the monthly usage and generation of electricity from each household, ranked in descending order of overall usage.
29
In terms of electricity usage, skewness is maintained in the case of prosumers, with the top 20% households accounting for 38% of total monthly consumption. The average consumption is also superior to that of consumers, with a value of 3,051 kWh. Generation appears to be more evenly distributed, with values more concentrated towards the mean of 2,436 kWh generated each month. An interesting point of analysis is the fact that the average monthly electricity consumption of prosumers is superior to that of consumers by 491 kWh.
Table 4 presents descriptive statistics, with another particularity being the differences in
standard deviation. Prosumers exhibit a greater spread of consumption data, which also leads to larger differences between mean and median.
Consumers
Consumption [kWh] Consumption [kWh] Generation [kWh]
Minimum 409 696 189 Mean 2565 3052 2436 Median 2259 2699 2524 Maximum 10999 12687 5814 Standard Deviation 1644.8 1825.8 785.1 Prosumers
Table 4 - Descriptive Statistics for Average Monthly Electricity Data
30
Figure 7 presents the average consumption during the month of April 2016,
discriminating between consumers and prosumers. Generally, it is clear that trends are closely comparable for consumers and prosumers, with fluctuations in consumption occurring in the same periods and with similar scaling.
Noteworthy is the consistent decrease in consumption as the month progresses, which might be due to general weather changes throughout the month. In fact, a deeper look into temperatures recorded in Austin, Texas (Past Weather in Austin, Texas; www.timeanddate.com/weather/) appears to confirm this hypothesis and ascertain an inverse correlation between recorded temperature and electricity consumption. Upward fluctuations recorded at certain days also match those of weekends, for the most part. Such behavior is quite predictable, as weekends usually elicit higher consumptions as members of the household spend larger periods of time at home.
The final point relates to the larger values of consumption recorded in the days between 18 and 20 of April. This spike appears to also have a localized cause, the ‘April 2016 North American storm complex’ (Winter Storm Vexo; weather.com). This event, a storm system
31
originated in the Rocky Mountains near Austin, caused a large snowstorm and heavy rain in the area, resulting in severe flooding across Texas (Iowa Environmental Mesonet;
mesonet.agron.iastate.edu). Such a natural event had a more profound impact in prosumer
households, as unexpected decreases in PV generation force higher levels of grid reliance. While outside the scope of the research conducted throughout, market behavior when facing unpredictable shocks should be a key consideration when designing LEMs.
3.2 SIMULATION SETUP
Simulation assists in understanding a real need, in this case the analysis of how to set up LEMs to reduce equilibrium price and effectively achieve a higher level of overall utility. Since all households are unique and therefore get dissimilar benefits from market changes, there is no unique solution. Repeated simulations allow us to obtain generalizability meaning that the results from this study can be applied to different participants and settings. Analysis is made possible through Monte Carlo Simulations, which rely on repeated random sampling to normalize results (Sawilowsky, 2009). This approach is particularly important in the context of this study, as household profiles vary greatly, therefore obtaining a single result would be far from representative. Research was designed to account for 25 iterations of the simulation process, to ensure accuracy and allow comparison between different outputs.
3.2.1 Auction mechanism
The proposed market functions through a double auction with a single clearing price, determined at discrete market close times, which were set-up in 15-minute time intervals lasting a month. Trading is done inside each time slot, with agents limited to a single bid per period. Number of participants will be scaled between 5 and 50, N = [1, 2,…, 50]
Bids are placed at period t to satisfy demand applicable in t+1. Each participant is considered a buyer or seller depending on his gridi t for a specific interval and the market clearing price (pe
t) is determined as the lowest bid that can still be filled given aggregate market
demand. Extra electricity to balance demand and supply mismatches is provided by an energy provider via the grid, whose behavior is simulated by an agent with unlimited bids and asks. This agent can purchase or sell as much electricity as demanded at the prices offered by traditional utilities, which will henceforth serve as the lower and upper bounds of market price.
32
At the end of each simulation, all market clearing prices are averaged resulting in a single monthly local price.
In practice, the market functioning mechanism would be implemented through a smart contract on a permissioned Blockchain, as described previously. Such a setup removes the need for a central entity and streamlines much of the process, mainly by incorporating an immediate payment method and having the Blockchain act as an escrow. In the interest of simplicity, fees and taxes are considered scalable and currency exchange rates assumed to be negligible. This market set-up matches all but one of the LEM market requirements (Block et al., 2008) as it is made up of an online system that uses price signals to match supply and demand and reflect market allocation of electricity. The connection to the traditional grid ensures stability and reliability of the system as there is a method to balance the market whenever necessary. Finally, generation and consumption data is forecasted at the individual level and posteriorly used to match market constraints.
3.2.2 Optimization problem
The market outcome is measured as the weighted average of electricity costs for the total pool of participating agents. Market lower and upper limits match grid prices when purchasing or selling electricity. Since the Pecan Street database is based on a specific city, Austin, such limits will be defined at specific prices offered by utilities at the time of data collection. Since most of Texas benefits from an open competition market with various electricity providers, there is no single price that is verifiable across the city. Data comes from the Public Utility Commission of Texas and, for the considered period, the lowest possible rate offered that matched the average consumption of households was the one used for comparison (Retail Electricity Price Comparisons, April 2016). Using the most affordable option enables analysis into whether LEMs are always superior, price-wise, compared to utilities. In that sense, the market upper limit will coincide with the retail price, pu= $0.1474 per kWh. As for
the lower limit, it will be equal to the most beneficial feed-in tariff available to customers, in this case pl= $0.0763 as offered by Austin Energy (Tax Credits, Rebates and Savings; energy.gov). The model is designed in such a way to minimize overall electricity costs and therefore limit grid interaction (g) by maximizing market self-consumption. Market outcome is represented the sum of electricity amounts, qe
ij t, sold between agents i and j at price pe at
33
For each timeslot, the optimization problem will be defined by four constraints, following the framework suggested by (Mengelkamp et al., 2017). Constraint (2) forces each agent to satisfy his demand and sell his excess generation, while constraints (3) and (4) allow the grid to balance supply and demand. Constraint (5) ensures that only positive amounts of electricity are traded.
3.2.3 Agent behavior
For each trading period, every agent determines the maximum price he is willing to pay for electricity or the minimum price he is willing to sell his own electricity at. In testing market functioning processes, bidding strategies mirror those used by zero-intelligence(ZI) agents, an approach firstly suggested by Gode & Sunder (1993). These agents possess no inherent capacity to learn from previous actions and adapt their behavior strategically, meaning that this price limit is randomly assigned within the pre-determined ranges. Generally, these agents merely follow their budget constraints and avoid losing money. In this case, ZI agents used are considered to be constrained, in that they cannot bid higher than their valuation or ask below cost. Such constrained agents are considered more efficient (Anufriev et al., 2013) due to the added individual rationality caused by the presence of constraints.
For disregarding socio-economic reasons besides their inherent valuations, agents are typically classified as a lower-bound of market efficiency (Vytelingum et al., 2010). However, studies on isolated agent participation in a market show that ZI agents can very efficiently trade within a simulated market and prices typically converge to the equilibrium price predicted by