INSTITUTO DE INVESTIGAÇÃO E FORMAÇÃO AVANÇADA ÉVORA, MAIO 2015
ORIENTADORA:Elisa Maria Varela Bettencourt
Tese apresentada à Universidade de Évora para obtenção do Grau de Doutor em Ciências Veterinárias
Vanda Gonçalves dos Santos
CONTROL OF
LUTEOLYSIS IN THE MARE
INSTITUTO DE INVESTIGAÇÃO E FORMAÇÃO AVANÇADA ÉVORA, MAIO 2015
ORIENTADORA:Elisa Maria Varela Bettencourt
Tese apresentada à Universidade de Évora para obtenção do Grau de Doutor em Ciências Veterinárias
Vanda Gonçalves dos Santos
CONTROL OF
LUTEOLYSIS IN THE MARE
TABLE OF CONTENTS
Abstract ...v
Resumo ... vi
Acknowledgments ... ix
List of figures ... xi
List of tables... xvi
List of abbreviations ... xvii
Preamble ...19
1. Literature review ...20
1.1. Introduction ...20
1.2.1. Follicular phase ...20
a) The wave phenomenon ...20
b) Emergence ...21
c) Acquisition of dominance / Deviation ...22
d) Follicular growth, periovulatory period and ovulation ...27
1.2.2. Luteal phase ...30
a) Corpus luteum ...30
b) Corpus hemorragicum ...31
c) Luteolysis ...31
1.2.3. Abnormalities of the estrous cycle ...34
a) Hemorrhagic anovulatory follicles ...34
b) Idiopathic persistence of the corpus luteum ...35
2. Oxytocin induction of pulses of a prostaglandin metabolite and luteolysis in mares. .38 Abstract ...39
2.1. Introduction ...40
2.2.1. Mares and treatments ...42
2.2.2. Experiment 1. Effect of bolus treatment with OT on PGFM ...43
2.2.3. Experiment 2. Effect of 2-h infusion of OT on PGFM pulses ...43
2.2.4. Experiment 3. Effect of FM bolus treatment and OT infusion on P4. ...44
2.2.5. Experiment 4. Effect of FM bolus treatment and OT infusion on PGFM and P4. ...45
2.2.6. Hormone assays ...45
2.2.7. Statistical analyses ...46
2.3. Results ...47
2.3.1. Experiment 1. Effect of bolus treatment with OT on PGFM ...47
2.3.2. Experiment 2. Effect of 2-h infusion of OT on PGFM pulses ...48
2.3.3. Experiment 3. Effect of FM bolus treatment and OT infusion on P4 ...51
2.3.4. Experiment 4. Effect of FM bolus treatment and OT infusion on PGFM and P4 ...52
2.4. Discussion...54
2.5. Conclusions ...57
2.6. Acknowledgments ...58
2.7. References ...58
3. Role of PGF2α in luteolysis based on inhibition of PGF2α synthesis in the mare. ...64
Abstract ...65
3.2. Materials and methods ...68
3.2.1. Mares...68 3.2.2. Protocol ...69 3.2.3. Hormone assays ...71 3.2.4. Statistical analyses ...71 3.3. Results ...72 3.4. Discussion...82 3.4.1. Inhibition of PGFM...82
3.4.2. Progesterone response to inhibiting PGF2α...83
3.4.3. Prolonged luteal activity ...85
3.5. Conclusions ...87
3.6. Acknowledgments ...87
3.7. References ...88
4. Hormonal, luteal, and follicular changes during initiation of persistent corpus luteum in mares ...94
Abstract ...95
4.1. Introduction ...96
4.2. Materials and methods ...99
4.2.1. Mares...99 4.2.2. Protocol ...99 4.2.3. Hormone assays ...100 4.2.4. Statistical analyses ...101 4.3. Results ...101 4.4. Discussion...108 4.5. Conclusions ...113 4.6. Acknowledgments ...113 4.7. References ...114
5. Long-term characteristics of idiopathic persistent corpus luteum in the mare ...120
Abstract ...121
5.1. Introduction ...122
5.2. Materials and methods ...124
5.2.1. Mares...124
5.2.2. Protocol ...124
5.2.4. Statistical analyses ...127
5.2.5. Survey ...128
5.3. Results ...128
5.3.1. PCL characteristics ...128
5.3.2. Transient depressions in P4 ...132
5.3.3. Normalization to end of luteolysis and to ovulation ...135
5.3.4. Survey ...138
5.4. Discussion...141
5.4.1. PCL characteristics ...141
5.4.2. Transient depressions in P4 ...143
5.4.3. Normalization to end of luteolysis and ovulation ...144
5.4.4. Survey ...145
5.5. Conclusions ...146
5.6. Acknowledgments ...146
5.7. References ...147
6. Discussion and conclusion ...152
Abstract
Persistent corpus luteum (PCL) is one cause of infertility in mares. However, its nature is poorly understood. Furthermore, role of oxytocin during luteolysis is not clear. A series of experiments were conducted (1) to characterize PCL and to compare PCL with interovulatory-intervals (IOIs) and (2) to evaluate the role of oxytocin during luteolysis. The induction of PCL was also attempted using a PGF2α secretion inhibitor. Oxytocin was used to induce luteolysis. Progesterone (P4) concentration decreased in IOI and PCL until Day 14 postovulation and then diverged, whereas PGFM concentration did not differ between groups. Transient P4 depressions were observed during PCL. Before the end of luteolysis P4 concentration was less in PCL than IOI. Inhibition of PGF2α secretion caused a 1-day increase in the length of the luteal phase. Oxytocin caused a P4 decrease within 8-hours and a PGFM increase within 1-hour after infusion and induced partial luteolysis.
Controlo da luteólise na égua
Resumo
O corpo lúteo persistente (PCL) é uma causa de infertilidade em éguas, no entanto a sua origem não é conhecida. Além disso, o papel da oxitocina na luteólise na égua não está claro. Foram realizados estudos para (1) caracterizar o PCL e comparar o PCL com intervalos-entre-ovulações fisiológicos (IOI) e (2) determinar o papel da oxitocina na luteólise. A indução do PCL foi tentada através da inibição da secreção de PGF2α. A oxitocina foi utilizada para induzir a luteólise. A progesterona (P4) diminuiu em éguas com IOI e PCL até ao dia 14 pós-ovulação divergindo entre grupos posteriormente; a PGFM não diferiu entre grupos. Foram observadas diminuições transitórias de P4 na presença de PCL. Antes da luteólise a P4 era menor em éguas com PCL comparado com IOI. A inibição da secreção de PGF2α aumentou em 1 dia a duração da fase lútea. A oxitocina diminuiu a P4 em 8 horas e aumentou a PGFM em 1 hora após o início da infusão, causando luteólise parcial.
“Nature hides its secrets well.” O. J. Ginther
Dedication
To Paulo who fought hard to make this possible and makes me a better person.
Acknowledgments
First I would like to thank Dr. O.J. Ginther for the unique opportunity. His contribution made me grow as a scientist and as a person. Thank you for all the guidance and teaching. I consider myself lucky to have been able to work closely with you.
In second place I would like to thank Dr. Elisa Bettencourt for accepting to be my advisor. Thanks for all the guidance and the opportunity to work with you during this stage of my life.
I would like to thank Jane Ginther for being a good listener and for teaching me a lot of things outside the lab. Thank you for the life, cooking, and gardening lessons, among others. Thank you for being my “borrowed grandmother” in a place far away from home.
To my lab colleagues: Dr. Mohammed Beg for all the statistics lessons and lab lessons, and for checking up on everybody even after he left; Maria Hoffman, thank you for all the help with assays, data, and figures, and for all the trivial conversations that would make both our days easier. With no specific order: to Fabio, Thadeu, Julia, Jonathan, and Caroline a big thank you.
To Andy who was always available to help in every situation (car problems, animals stuck somewhere, with the things that mysteriously stopped working when I touched them and that suddenly started to work when he checked up on them…). Thank you for your friendship. To the friends I left back in Portugal that always showed support and managed not to forget me. Thank you for all the conversations by chat that would ease the loneliness of some days far away from home and that made me smile. For all the good news they shared with me. Sorry if I forget somebody, a thank you to Joana Elias, Joana Brás, Pedro Fonseca (specially for the pictures in warm beaches that made me turn green of envy while I was freezing in the low winter temperatures of Wisconsin), Rafael Fonseca, Patricia Rodrigues (for all the postcards that came all the way from France that I never got to answer… sorry about that…),
Cristina Bastos de Carvalho (for the timing with the heartwarming messages that always came at the right time when I most needed them), Miguel Quaresma (for your special friendship), and Rosa Carvalho who helped me through the final stage of this challenge.
To Paul Fricke and Alessio Valenza for their help during the last stages of this work, and for the opportunity they gave me which allowed me to finish my studies. Also, to Carolina Maia and Bruno Carneiro (Sem querer pressionar…mas estamos todos a tua espera!) for the support during the last stage of the thesis.
To my family, for all the love and unconditional support that made me go through this challenge. A special thank you for my grandmother who always supported me in all my decisions, to my parents who made me the person I am and to my brothers for all their love.
Finally, to the person responsible to make me get through this, my husband Paulo Carvalho. Thank you for endure all my breakdowns, my bad humor, and complaining all the time. Thank you for pushing me into wanting to learn more and into the end of this journey. I don’t know how you manage to keep strength to do your things and give me the energy to finish mine. Thank you for all your love.
List of figures
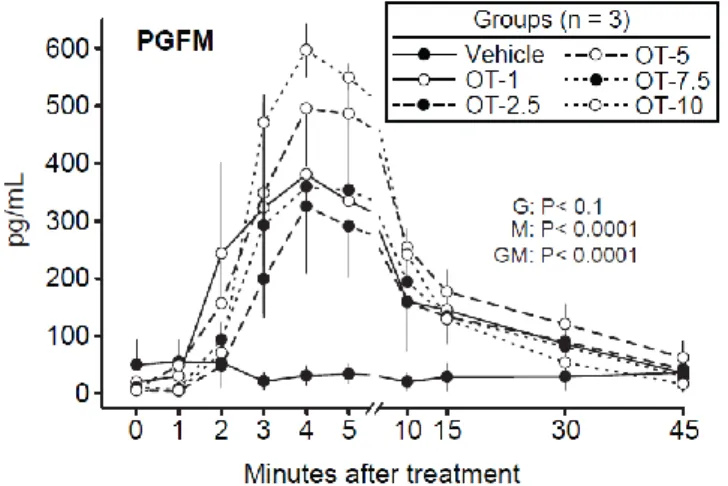
Figure 2.1. Mean ± SEM concentrations of PGF2α metabolite (PGFM) from Minutes 0 to 45
(Minute 0 = bolus treatment) in a vehicle and oxytocin-treated (OT) groups (e.g., OT-1 = OT at 1.0 IU/mare). Probabilities for main effects of group (G) and minute (M) and the interaction of group by minute (GM) are shown. Concentration was greater in each OT-treated group than in the vehicle group at Minutes 3 to 15, but the differences among OT groups were not significant. ... 47
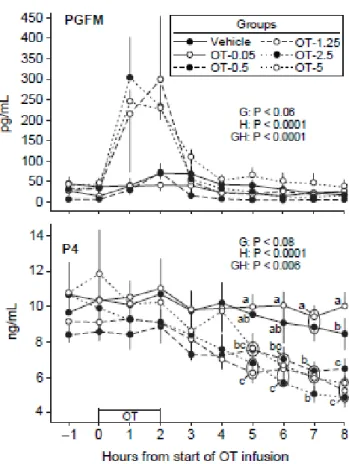
Figure 2.2. Mean ± SEM concentrations of PGF2α metabolite (PGFM) and progesterone (P4)
at hourly intervals in a vehicle (n = 8) and oxytocin-treated (OT) groups (n = 4/group) at the indicated dose (e.g., OT-0.5 = OT at 0.5 IU/100 kg). The vehicle and OT were infused for 2 h as indicated above the hour scale. Probabilities for main effects of group (G) and hour (H) and an interaction (GH) are shown. Within each hour, any two means without a common letter (abc) are different (P < 0.05); a ring is used to encompass two means that are too close for placement of separate letters. ... 48
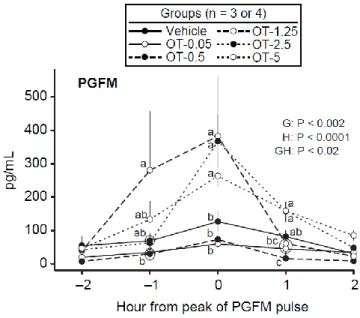
Figure 2.3. Mean ± SEM concentrations of PGF2α metabolite (PGFM) in identified pulses
centered on the pulse peak in a vehicle and oxytocin-treated (OT) groups at the indicated dose (e.g, OT-5 = OT at 5 IU/100 kg). Probabilities for main effects of group (G) and hour (H) and an interaction (GH) are shown. Within each hour, any two means without a common letter (abc) are different (P < 0.05); a ring is used to encompass two means that are too close for placement of separate letters. ... 49
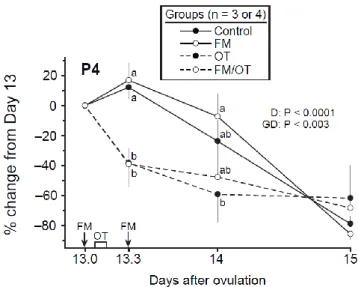
Figure 2.4. Mean ± SEM percentage of change from Day 13 in concentration of progesterone
(P4) in control, flunixin meglumine (FM), oxytocin (OT), and FM/OT groups. An FM treatment (1.0 mg/kg) was given on Days 13.0 and 13.3, and OT was infused (2.5 IU/100 kg) during 2 h beginning 2 h after the first FM treatment. Probabilities for main effect of day (D)
and an interaction (GD) are shown. Within each day, any two means without a common letter (ab) are different (P < 0.05). ... 52
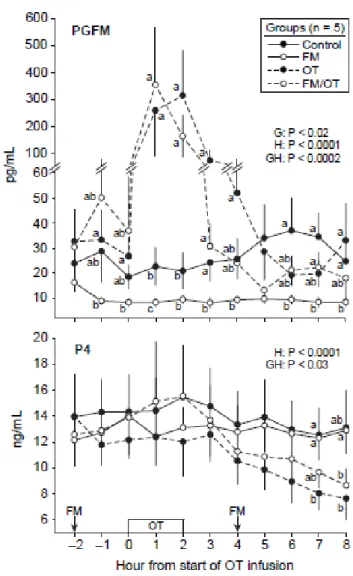
Figure 2.5. Mean ± SEM concentrations of PGF2α metabolite (PGFM) and progesterone (P4)
on Day 13 in control, flunixin meglumine (FM), oxytocin (OT), and FM/OT groups. The PGFM concentration is in two different scales. An FM treatment (1.0 mg/kg) was given at Hours –2 and 4 and OT was infused (2.5 IU/100 kg) during 2 h beginning at Hour 0. Probabilities for main effects of group (G) and hour (H) and an interaction (GH) are shown for PGFM and P4. Within each panel and hour, any two means without a common letter (abc) are different (P < 0.05). ...53
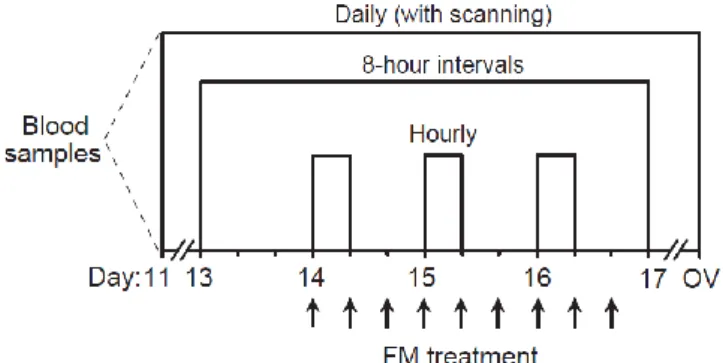
Figure 3.1. Diagram of experimental protocol. Flunixin meglumine (FM,1.0 mg/kg) was given
every 8 hours for a total of 9 treatments from Day 14 at 7:00 AM until Day 16 at 11:00 PM. Daily ultrasound examinations and blood sampling were done from Day 11 postovulation until ovulation. Blood samples were collected every 8 hours from Day 13 at 7:00 AM until Day 17 at 7:00 AM. Three sets of hourly samples for 8 hours were collected on Days 14, 15 and 16 from 7:00 AM until 3:00 PM. Ov, ovulation. ... 70
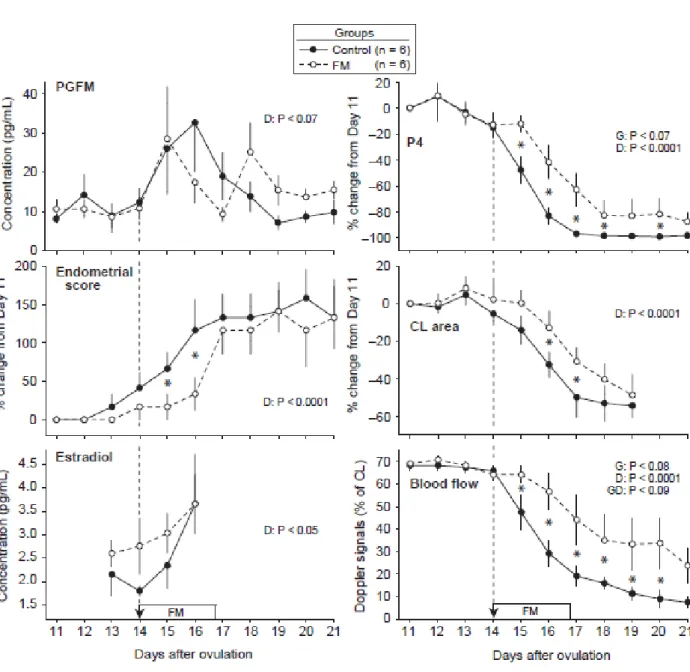
Figure 3.2. Mean ± SEM concentrations of PGFM; percentage change from Day 11 in
concentration of progesterone (P4), endometrial score (1 to 4 for increasing edema), and cross-sectional area of the CL; concentrations of estradiol; and percentage of CL with color-Doppler signals of blood flow from Days 11 to 21 in controls and flunixin meglumine (FM) treated mares (1.0 mg/kg). Arrow with broken line indicates first treatment and the rectangle indicates the period of treatment (every 8 hours). Probabilities for main effects of group (G) and day (D) and the interaction (GD) are shown. An asterisk (*) indicates a day with a difference between groups (P ≤ 0.05). ... 74
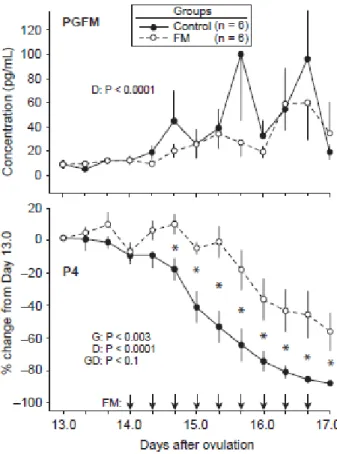
Figure 3.3. Mean ± SEM concentration of PGFM and percentage change from Day 13.0 in
progesterone (P4) every 8 hours from Days 13.0 to 17.0. The arrows indicate that flunixin meglumine (FM, 1.0 mg/kg) was given every 8 hours from Day 14.0 to 16.7. Probabilities for
main effects of group (G) and day (D) and the interaction (GD) are shown. An asterisk (*) indicates a day with a difference between groups (P ≤ 0.05). ... 75
Figure 3.4. Mean ± SEM concentrations of PGFM and progesterone (P4) at hourly intervals
for 8-hour sets at the beginning of each of 3 days for the controls and flunixin meglumine (FM) treated groups, using six combinations of day and group as shown. The PGFM concentrations are in two different scales on the y-axis. Probabilities for a main effect of combination (C) and hour (H) and the interaction (CH) are shown. Within each hour, means without a common letter (abcd) are different (P < 0.05)... 77
Figure 3.5. Mean ± SEM concentrations of PGFM in identified pulses centered on the pulse
peak for four combinations of day and group. Only one and zero pulses were detected in the FM group on Days 14 and 15, respectively, and were not included. Probabilities for a main effect of combination (C) and hour (H) and the interaction (CH) are shown. Within each hour, any two means without a common letter (abc) are different (P < 0.05). ... 79
Figure 3.6. Concentrations of progesterone (P4) and PGFM, cross-sectional area of the CL,
and percentage of CL with color-Doppler signals of blood flow for an individual mare in the flunixin meglumine group that had prolonged luteal activity and IOI. A transient decrease in P4 began on Day 15, did not decrease to < 1 ng/mL, and then increased beginning on Day 19. A maximal concentration of PGFM occurred near the beginning of the initial transient decrease and the final decrease in P4 near the end of the 41-day IOI. The profile for area of the CL (cm2) and percentage of the CL area with blood-flow signals approximated the profile for P4 concentrations. Study by ultrasonic imaging seemed to indicate that a single CL was involved. ...81
Figure 4.1. Mean ± SEM concentrations of progesterone (P4), PGFM, estradiol (E2), LH, and
prolactin in the IOI group and PCL group. Probabilities for main effects of group (G) and day (D) and the interaction (GD) are shown. An asterisk (*) indicates a day with a difference (P < 0.05) between groups. ... 104
Figure 4.2. Concentration of progesterone (P4) in 12 individual mares in the IOI group (A, C,
E, G I, K) and PCL group (B, D, F, H, J, L). Mares are paired between groups according to maximal concentration on Days 12 or 13. A pronounced 1-day decrease (a portion of luteolysis) is apparent in each IOI mare. A pronounced decrease (apparent initial portion of luteolysis) are shown for three mares (B, F, H) and a gradual decrease for three mares (D, J, L) in the PCL group; however, concentrations were irregular in one mare (B). Compared to the IOI mares, P4 in the PCL mares decreased only about 50%. ... 105
Figure 4.3. Mean ± SEM for area of CL, percentage of CL with blood-flow signals, diameter
of the largest follicle, and endometrial score in the IOI group and PCL group. Probabilities for main effects of group (G) and day (D) and the interaction (GD) are shown. An asterisk (*) indicates a day with a difference (P < 0.05) between groups. ...107
Figure 5.1. Mean ± SEM concentration of progesterone (P4), cross-sectional area of CL, and
percentage of CL with blood-flow signals from 64 to 2 days before the end of luteolysis in seven PCLs. Results of multiple regression analyzes for each end point are shown. Linear components for each end point are indicated by different symbols for the means. ... 130
Figure 5.2. Individual profiles of dominant follicles of major follicular waves for two mares
with PCL. The interval between ovulations was 93 and 121 days for the two mares, respectively, and the duration of the luteal phase was 89 and 113 days. DF = dominant follicle; OV = ovulation; POF = preovulatory follicle. ... 132
Figure 5.3. Profile of concentration of progesterone (P4) for a mare with PCL. The P4 linear
regression was used as an aid for locating P4 depressions. The location of the nadirs of two transient P4 depressions are indicated by the arrow heads on the day scale. ... 133
Figure 5.4. Mean ± SEM concentration of progesterone (P4; n = 16), diameter of the dominant
follicle (n = 16), and concentration of estradiol (E2; n = 7) normalized to the nadir of a transient depression in P4 concentration during a PCL. Probabilities for main effect of day (D) that were significant are shown. The day effect for E2 was not significant, but on a preliminary basis an
asterisk (*) indicates days with a difference (P < 0.05) between days, and a hash mark (#) indicates days with an approaching difference (P < 0.08). ... 134
Figure 5.5. Mean ± SEM concentration of progesterone (P4; n = 28 IOIs, 10 PCLs), LH (n =
9 IOIs, 6 PCLs), and FSH (n = 9 IOIs, 6 PCLs) from 4 days before to 5 days after the end of luteolysis. Probabilities for main effects of group (G) and day (D) and the interaction (GD) that were significant or approached significance are shown. An asterisk (*) indicates a day with a difference (P < 0.05) between groups and a hash mark (#) indicates a day with an approaching difference (P < 0.07). ... 136
Figure 5.6. Mean ± SEM concentration of LH (n = 9 IOIs, 6 PCLs) and diameter of the
preovulatory follicle (n = 28 IOIs, 6 PCLs) for 10 days before ovulation. Probabilities for main effects of group (G) and day (D) that were significant are shown. An asterisk (*) indicates a day with a difference (P < 0.05) between groups. ... 137
Figure 5.7. Profiles of concentration of progesterone (P4), cross-sectional area of CL,
blood-flow signals of CL, and diameter of dominant follicles for an individual mare with an ovulation during the PCL on Day 45. DF = dominant follicle; OV = ovulation; POF = preovulatory follicle. ... 140
List of tables
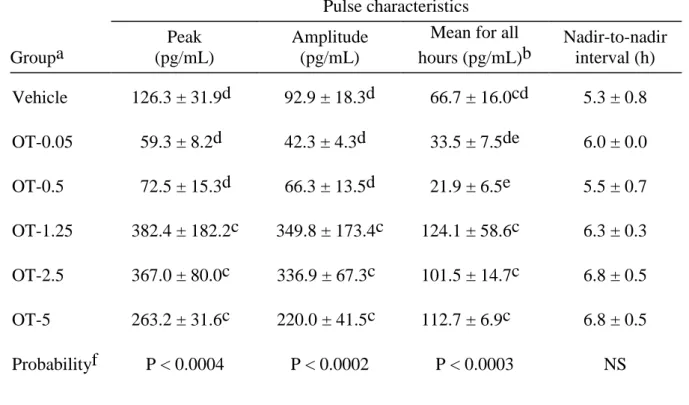
Table 2.1. Mean ± SEM for pulse characteristics of PGFM pulses during an 8 h period of
hourly sampling in mares in vehicle and OT-treated groupsa. ...50
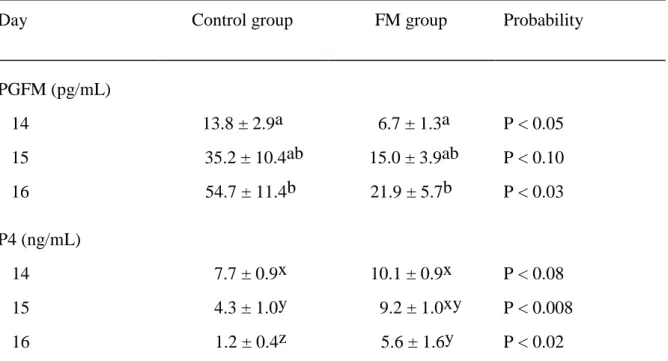
Table 3.1. Mean ± SEM for PGFM and P4 concentrations averaged over 8 hours of hourly
blood sampling on each of Days 14 to 16 for the control and FM groups. ... 76
Table 3.2. Mean ± SEM concentrations of PGFM in detected PGFM pulses during 8 hours of
hourly sampling on the indicated days postovulation in mares in the control and FM groups. ... 78
Table 3.3. Mean ± SEM length of intervals (days) between events in control and FM...80 Table 5.1. Mean ± SEM length of intervals from ovulation to ovulation, luteal phase, and
follicular phase for interovulatory intervals (IOI) and persistent CL (PCL). ... 130
Table 5.2. Mean ± SEM characteristics of major follicular waves during 10 PCLs from Day
20 to ovulation. ... 131
Table 5.3. Mean ± SEM for mare characteristics in IOI and PCLa. Survey. ... 139 Table 5.4. Reproductive events other than the ovulation at the beginning of a PCL in seven (A
List of abbreviations
Abbreviation Unabbreviated Abbreviation Unabbreviated
CL corpus luteum NS not significant
cm2 square centimeter OT oxytocin
CV coefficient of variation P probability
E2 estradiol P4 progesterone
FM flunixin meglumine PCL persistent corpus luteum
FSH follicle stimulating hormone pg picogram
h hour PGF2α prostaglandin F2α
HAF hemorrhagic anovulatory follicle PGFM Prostaglandin F2α metabolite
IGF-1 Insulin-like growth factor-1 reFSH recombinant FSH
IOI interovulatory interval reLH recombinant LH
ir-inhibin Immunoreactive-inhibin RIA Radioimmunoassay
IU international units SEM Standard error of mean
iv intravenous y year kg kilogram LH luteinizing hormone mg milligram MHz megahertz min minutes mL milliliter mm millimeter mo month
Preamble
The estrous cycle of the mare has been subject of study for almost half a century. The fact that mares are a seasonal specie represents a challenge for the study of the physiological estrous cycle because of its short ovulatory season. From mid-summer until fall the characteristics of the estrous cycle begin to change which can lead researchers into erroneous conclusions about the reproductive physiology of the mare. Although numerous reports can be found on different subjects of the estrous cycle of the mare, this specie still holds and insists in keeping its secrets from us.
The objectives of this thesis document were many fold. Firstly, we aimed to determine the role of oxytocin (OT) during luteolysis in mares, testing the hypothesis that luteolysis can be induced through the administration of OT. Of particular importance to this topic our objectives were (1) to determine a dose and method of administration of OT that will stimulate a PGFM pulse similar to a spontaneous pulse and (2) to study the role of OT in luteolysis.
In some reports [1], it has been hypothesized that the failure of secretion of prostaglandin-F2α (PGF2α) at the time of expected luteolysis may be the cause of idiopathic persistent corpus luteum (PCL). Therefore, our second objective was to attempt the induction of the formation of the PCL through the inhibition of PGF2α secretion using a cyclooxygenase inhibitor administered at the time of expected luteolysis. Our third and last objective, was the characterization and description of the hormonal and ovarian changes during the spontaneous development of an idiopathic PCL from Day 12 until Day 22 (during the time of expected luteolysis that failed to occur) and during the maintenance of the idiopathic PCL (normalized to the end of luteolysis and ovulation at the end of an IOI and PCL).
1. Literature review
1.1. Introduction
The estrous cycle, or more precisely the interovulatory interval, begins at ovulation usually associated with estrus and ends at the ensuing ovulation associated with the next estrus. The mean length of an interovulatory interval is typically 22 or 24 days in horses or ponies, respectively. The estrous cycle or interovulatory interval is characterized behaviorally by diestrus (12 to 16 days) and estrus (5 to 9 days) or, physiologically, by luteal phase and follicular phases, respectively [2,3]. In this thesis document, attention will only be given to physiological characteristics of the interovulatory interval and not to the behavioral characteristics, since the latter can be misleading and usually associated with a large variation among individuals. In addition, the literature review presented herein will focus on the physiological events of the estrous cycle of the mare (follicular and luteal phase).
1.2.1. Follicular phase
a) The wave phenomenon
In the domestic species the follicular development occurs in waves [2]. A major follicular wave in mares is defined as a number of several follicles that initially grow in synchrony but eventually dissociate or diverge in diameter [2,4]. Dissociation is characterized by preferential growth of one, occasionally two, members of the wave [2].
Waves are classified as major (divergence of follicles of a wave into dominant and subordinate follicles) and minor (no divergence) [4]. The largest follicle after divergence is named of dominant follicle, and those that regress after divergence are named of subordinate
follicles. The dominant follicle grows to a large diameter (e.g., > 30 mm), and this characteristic has also been used to define a major wave [2,4]. A minor follicular wave is characterized by the failure of the largest follicle to reach a large size and the apparent absence of dissociation and dominance. The terms secondary and primary waves have also been used for the equine estrous cycle. A secondary wave is a major wave that emerges during late estrus or early diestrus and its dominant follicle becomes anovulatory or terminates in a diestrous or secondary ovulation [4]. The development of a secondary follicular wave occurs in approximately 25% of the estrous cycles [5]. A primary wave is a major wave that originates during diestrus and gives origin to a dominant follicle that terminates in the primary ovulation (ovulation associated with estrus at the end of the interovulatory interval) [4].
b) Emergence
Emergence of follicular waves refers to the earliest ultrasonic detection of follicles compatible with retrospective tracking and is represented in mares by diameters of 6 mm [6]. Emergence of the primary wave occurs in mean on Day 7.4 (Day 0 = ovulation; range from Day 3 to Day 14) [4]. Length of the interovulatory interval is positively correlated with the day of emergence of the primary wave. That is, early or late emergence of a wave is associated with shorter or longer interovulatory intervals, respectively [4]. Emergence of each wave is temporally associated with an FSH surge for both the major and minor waves in mares. The FSH surge reaches a peak or a plateau when the largest follicle reaches about 13 mm [7]. The FSH concentrations then decline [6]. In mares, the future dominant follicle emerges 1 day earlier than the future largest subordinate follicle [7].
c) Acquisition of dominance / Deviation
After emergence, the follicles of a wave enter a common-growth phase involving reported means of 7 to 11 follicles [7]. Usually, in mares, only one of the available follicles develops into the dominant follicle, and this phenomenon is known as folliclular selection. Follicle selection or deviation occurs at the end of the common-growth phase and is characterized by continued growth of the largest follicle to become the dominant follicle and a reduction or cessation of growth by the remaining follicles to become subordinate follicles [6,8]. The beginning of observed deviation in the diameter profiles of individual follicles occurs at the ultrasound examination preceding the first examination with an apparent change in diameter differences between the two largest follicles [9]. Mean diameter observed at the beginning of deviation in mares is 22.5 mm with deviation beginning a mean of 6.2 days after emergence of a 6 mm follicle [6,7]. Between emergence and deviation, the growth rate of the two largest follicles seem parallel in about 50% of individual waves [7].
The follicle that first reached 20 mm (with daily examinations) became the dominant follicle in 93% of 29 waves. This diameter occurred on average at the examination before the beginning of deviation [8]. In adition, on average, the future dominant follicle reached 6 mm before the future largest subordinate follicle and maintained a mean diameter advantage of 3 mm until the beginning of deviation [7]. The difference in diameter between the two largest follicles at beginning of deviation is postulated to allow the largest follicle to establish dominance before the second largest follicle can reach a similar diameter [9]. The difference in diameter between the two largest follicles indicates that the smaller follicle must be inhibited in < 1 day (equivalent to a difference of 3 mm) [6]. The deviation mechanism must prevent the continued growth of the future subordinate follicles because they, as well as the future dominant follicle, are capable of dominance as indicated by studies involving ablation of specific follicles [6,10]. The deviation in diameter is likely preceded by biochemical or
functional deviation. In this regard, echotextural changes were detected in the wall of the largest follicle on the day before the beginning of diameter deviation in mares [11].
The main pituitary hormone in mares involved in the stimulation and regulation of follicle development is FSH [12]. A close two-way functional relationship between FSH and the follicles has been proposed to be an integral component of the deviation mechanism [8]. The depression of FSH concentration could be the critical event in deviation if the FSH is depressed below the quantities required by the smaller follicles, but not the largest follicle. The changes in FSH concentrations and follicle development are closely related [6]. The FSH surge that stimulates emergence of a wave begins to decline when the largest follicle is about 13 mm [6]. The interval from the beginning of the FSH decline to the beginning of deviation is about 3 days. After the beginning of deviation, the concentration of FSH continue to decline reaching a nadir 2 or 3 days after deviation [6,13]. Follicular growth for about 2 days after emergence is independent of FSH. However, during the decline in the wave-stimulating FSH surge and before deviation, growth of follicle is dependent on FSH [13]. During the interval from the beginning of the FSH decline until the beginning of deviation, multiple follicles contribute to the FSH decline [8]. Nevertheless, FSH is needed to maintain follicular viability even after the FSH peak, that is, the declining FSH concentrations is required for continued follicle growth [13]. The FSH:follicle relationship changes from multiple to single-follicle at the beginning of deviation and has been demonstrated by ablating only the largest follicle, only the smaller follicle, or none of the follicles when the largest follicle reached ≥ 20 mm (expected day of deviation) [10]. The decline in FSH concentrations of the wave-stimulating FSH surge continued for several days after ablation in the groups with no ablation or only the smaller follicle ablated. In the group with only the largest follicle ablated, the FSH and diameter of the smaller follicle increased within a day [10]. The continued decrease in FSH at the expected beginning of deviation can be attributed to the largest follicle, with no indication that the smaller follicle is involved [6]. Therefore, by the time of beginning of deviation, the future
dominant follicle develops the ability to suppress circulating FSH to below the concentration required by other follicles and the ability to utilize the low FSH concentrations in its further growth and development [6]. It has been proposed that regression of the smaller follicles involved a direct effect of follicle inhibitors secreted by the larger follicle, but the evidence is not convincing [14].
Inhibin, has been shown to be the FSH inhibitor during the early development of a follicular wave and is produced by the growing follicles of a follicular wave [12,15]. During the estrous cycle, in mares, peripheral concentration of total inhibin increase at the time FSH concentrations are declining, having a known negative feedback effect on FSH secretion [12,16,17]. Inhibin concentrations increase with follicle growth [18], but do not reach circulating concentrations that are sufficient to initiate a decline in the wave-stimulating FSH surge until the largest follicle reaches 12 or 13 mm [19,20]. An FSH-suppressing activity of equine follicular fluid has been demonstrated by an increase in FSH concentrations after ablation of follicles and is attributable to the removal of FSH-suppressing factors of follicle origin [6]. In adition, administration of an inhibin antiserum increased plasma FSH concentrations and increased the number of large follicles and ovulations [6]. The first 2 days of the FSH decrease are caused by inhibin, based on the positive relationship between the number of experimentally retained follicles and the extent of the increase in circulating total inhibin concentrations and the corresponding decrease in FSH. Near the expected day of deviation, total inhibin remained at elevated concentrations and likely contributed to the continuing FSH decline [8]. In this regard, treatment with serum containing inhibin antibodies on the day the largest follicle was 20 mm resulted in an increase in the number of 30 mm follicles [21,22]. After deviation, inhibin continues to be a FSH suppressant in mares [8].
In mares, an increase in estradiol (E2) occurred in the follicular fluid [23], and echogenic changes characteristic of estrogen stimulation occurred in the wall of the future dominant follicle the day before the beginning of deviation [11]. The beginning of increased
local availability of E2 approximately coincides with the beginning of deviation. Reported autocrine and paracrine activities of E2 in the granulosa cells include enhancing aromatase enzyme activity, promoting expression of LH receptors, and enhancing the sensitivity to FSH and LH [8]. The production of E2 by the follicle at deviation has been shown to be dependent on gonadotropins [24]. The increased E2 produced by the developing dominant follicle near the beginning of deviation may be attributed to the transient elevation in LH concentrations and the increased expression of LH receptors by the granulosa cells [8]. Direct LH-induced secretion of E2 within the granulosa apparently has not been demonstrated in horses [25]. However, E2 does not begin to increase in the circulation until 1 or 2 days before the beginning of deviation in mares [19,23]. Thus, on a temporal basis, increased E2 apparently does not contribute to the FSH decline until the day before deviation. Ablation of the largest follicle at the expected beginning of deviation prevented the continuing E2 increase and resulted in associated FSH increase [10]. However, an FSH increase does not occur when only the second largest follicle is ablated [8]. Both E2 and inhibins are lost upon ablation of the largest follicle and a decrease in either or both could account for the resulting increase in FSH [8]. Inhibin from the wave of growing follicles apparently is the principal, if not the only, systemic FSH supressant during most of the common-growth phase. Circulating E2 concentrations increase near the beginning of deviation, and it appears that both inhibin and E2 contribute to the subsequent continuation of the FSH decline [8].
Elevated LH concentrations were temporally associated with deviation and often were represented by a distinct part of the prolonged ovulatory LH surge in this species [7]. The granulosa cells of the future dominant follicle acquire LH receptors just before the beginning of deviation, providing a pathway for a functional LH effect of the early portion of the transient LH elevation [8]. Detectable amounts of LH receptors are present in granulosa cells of all follicles more than 5 mm in diameter in the mare and LH receptor content in granulosa cells increases with follicular diameter [18,26] being greater when the follicles are 20-24 mm than
15-19 mm [18], but a differential change in LH receptor content in granulosa cells of the future dominant versus subordinate follicles at the beginning of deviation has not been reported. Experimental reduction of LH concentrations decreased the diameter of the dominant follicle beginning 1 or 2 days after the beginning of deviation in mares [27,28]. A study with acyline induced gonadotropins supression and with administration of reFSH, reLH, or both showed that follicle diameters are dependent only on FSH during the first 48 hours after the beginning of deviation, with no aditional dependence on LH [24]. In adition, the reduced LH did not affect the second-largest follicle. Nevertheless, the onset of deviation was not delayed by the reduction of LH, but the post-deviation growth of the largest follicle was reduced [27]. The transient elevation in LH at deviation stimulates the IGF system, as well as the steroid system. At the beginning of deviation, the largest follicle is able to utilize the low concentrations of FSH, presumably enhanced by local effects of E2 and IGF-1. The second largest follicle has not developed to a similar extent and therefore cannot withstand the low FSH concentrations. Thereby, deviation is established before the second-largest follicle can develop to a stage that would allow it to assume the biochemical characteristics of a future dominant follicle [8].
Before the beginning of deviation, differential concentration changes occur between the future dominant and subordinate follicle in E2, free insulin-like growth factor (IGF)-1, activin-A, and inhibin-A [29,30]. The IGF-1 system seems to be the most critical among these factors for the initiation of deviation in mares. In experimental deviation, an increase in IGF-1 occurs before deviation, whereas E2, activin-A, and inhibin-A concentrations increase after deviation [12,30]. Acyline-treated mares were given reFSH, reLH, or both, and in the groups that were not given FSH replacement, the IGF-1 concentrations were lower in both the dominant and second largest follicles and the lower IGF-1 was assotiated with retardation of follicular growth. The temporal availability of IGF-1 as an enabling factor in deviation in mares was also supported by the greater concentration of free IGF-1 in the dominant follicle than in the second largest follicle at 48 hours after the expected beginning of deviation [24]. In adition, injection
of recombinant human IGF-1 into the second largest follicle at the expected beginning of deviation induced an increased incidence of dominance in the treated follicle [31,32] and injection of IGF binding proteins-3 (IGF antagonist) into the dominant follicle caused the regression of the dominant follicle and the subordinate follicle to become dominant [33]. Furthermore, the injection of recombinant human IGF-1 into the dominant follicle at the expected beginning of deviation maintained follicular growth in mares treated with acyline [34]. These findings lead to the conclusion that gonadotropins are needed for increased follicular fluid concentrations of free IGF-1 at the beginning of deviation in the mare, and the increase in intrafollicular free IGF-1 in the future dominant follicle is FSH dependent [24,34].
d) Follicular growth, periovulatory period and ovulation
After deviation, the ovulatory follicle grows at a rate of 3 mm/day, reaching 35 mm 4 days before ovulation or at the beginning of the preovulatory period. The growth rate continues until 2 days before ovulation when it reaches a mean preovulatory plateau of 41 mm [35].
The E2 and LH periovulatory surges begin approximately 10 days before the periovulatory period or near the end of luteolysis and a day or two before follicle deviation as mentioned previously [35,36]. Estradiol from the dominant follicle forms a surge in the plasma that reaches a peak two days before ovulation and then recedes. The LH concentrations in the ovulatory surge increase slowly and then more rapidly, with the transition between the slow and rapid increases occurring at the peak of the E2 surge. The enhanced output of LH reaches maximum 1 day after ovulation [35,36]. The change in rate of LH output during the surge in mares is attributable to a negative effect of E2 on LH throughout the LH surge [37]. A negative effect of the follicles [15] and specifically E2 [37] on LH has been demonstrated by follicle ablations and treatments with E2. The decrease in E2 and the reduction or cessation in growth of the preovulatory follicle beginning 2 days before ovulation are attributable to the
development of a reciprocal negative effect of LH on follicular E2 production when LH reaches a critical concentration. This conclusion is based on temporal relationships and on the E2 decrease and reduction in follicle expansion beginning immediately after human chorionic gonadotropin treatment [38]. The initial rapid decrease in E2 from 2 days before to 1 day after ovulation is attributable to the negative effect of the rapidly increasing LH on E2, and the slower decrease after 1 day postovulation is attributable to the diminishing negative effect of the decreasing LH [39].
One to three surges in FSH concentrations occur during the luteal phase. The first surge begins just before ovulation when E2 is decreasing, and the peak of the last surge occurs when the largest follicle of the resulting ovulatory follicular wave is approximately 13 mm. Concentrations of FSH reach a nadir between the last surge of the estrous cycle and the first surge that will peak during the next cycle. The nadir occurs concomitantly with the preovulatory E2 peak. The occurrences of surges at different times and variation in the number of surges among mares account for the plateau in the mean FSH profile [35]. A negative effect of E2 on FSH accounts for the periovulatory E2/FSH temporal relationships; the negative effect has been demonstrated by the administration of E2 [20].
A slight but significant increase in circulating progesterone (P4) occurs with consistency among mares on the day of detection of ovulation or a collapsed follicle. The LH decrease after the peak of the LH surge on day 1 is related to a negative effect of the postovulatory increase in P4. The negative effect of P4 on LH is indicated by the temporal relationships at the beginning and end of the luteal phase [36] and by a demonstrated negative effect of exogenous P4 on LH [27].
There is indication that considerable amounts of follicular fluid with high concentrations of hormones passes through the fimbrae of the oviduct into the peritoneal cavity at ovulation [5]. The hormones are absorbed from the peritoneal cavity and alter circulating concentrations of E2 and inhibin, which in turn alter concentrations of LH and FSH. A
preovulatory collection of fluid external to the ovary in the infundibular area has been detected by transrectal ultrasonic imaging [40,41]. As ovulation approaches, a bulge at the apex of the follicle can be detected at the ovulation fossa by ultrasonic imaging [41]. The follicular fluid enters the infundibular fluid during follicle evacuation at ovulation. Most of the follicular fluid passes into the abdomen, based on continuous ultrasonic imaging in mares [40].
The gradual preovulatory mean increase in each gonadotropin is temporarily disrupted at ovulation. Concentrations of LH and FSH increased significantly between 1 and 0.5 days before ovulation and 0.5 and 1 days after ovulation but not between 0.5 days before and 0.5 days after ovulation. Concentrations of E2 decreased significantly between 1 and 0.5 days before ovulation and between the day of ovulation and 0.5 days after, but the decrease between 0.5 days before ovulation and the day of ovulation was not significant [5,42]. The transient disruption in LH increase can be attributed to release of the E2 content of the follicular fluid into the peritoneal cavity, followed by absorption into the circulatory system [5,42]. A distinct spike in circulating immunoreactive (ir)-inhibin also occurs on the day of ovulation in mares [17]. It has been shown that inhibins increased immediately after ovulation and returned to basal concentrations in 12 hours. Sampling of peritoneal fluid showed inhibin-A concentrations that were 300 times greater immediately after ovulation than at other stages of estrus [43]. The spike in (ir)-inhibin concentrations in association with evacuation of the follicle at ovulation only partly accounts for the depicted transient suspension in the FSH increase from 0.5 days before to 0.5 days after ovulation [17]. In addition, a negative effect of E2 on FSH has been demonstrated by treatment with E2 [20]. The synergistic effect of E2 and inhibin from the follicular fluid that entered the peritoneal cavity more completely accounts for the transient suppression of the incline in FSH. The E2 content of the discharged follicular fluid on the day of ovulation [5] is adequate for disrupting the LH surge [37] and contributing to disruption of the FSH increase.
Ovulation is readily detected ultrasonically by the disappearance of a large follicle that was present at a recent previous examination [2].
1.2.2. Luteal phase
a) Corpus luteum
The corpus luteum (CL) is a transient endocrine gland involved in establishment and maintenance of pregnancy due to production of P4 and has a critical role in the estrous cycle periodicity [44]. The CL goes through a developmental, maintenance and regressive stages [2], and forms at the site of ovulation, developing from cells that remain in the follicle following ovulation but is eventually composed of multiple, distinctive cell types including steroidogenic cells (small and large luteal cells) and non-steroidogenic cells (endothelial cells, pericytes, fibrocytes, and immune cells) [45]. The luteal phase has a mean length of 14 days.
After ovulation there is an immediate increase in P4 concentrations, starting on the ovulation day (Day 0) and reaches a maximum on Day 8. After Day 8, concentrations of P4 decrease gradually until the beginning of luteolysis. The period between Day 8 and 14 is designated as preluteolytic period. The area of the corpus luteum reaches a maximum on Day 4 and progressively decreases thereafter until Day 19. During preluteolysis the rate of decline in plasma P4 and area of CL are not different. The gradual decline in P4 concentrations during the preluteolytic period is temporally related to a gradual decline in LH concentrations from the ovulatory LH surge. The concomitant gradual decline in both P4 and luteal area seems attributable to a decreasing positive effect of LH on the CL [46].
b) Corpus hemorragicum
After ovulation, 68% of the luteal glands develop a large, fluid-filled, central area. The central area was attributable to blood [47], and the structure was designated by corpus hemorragicum. The central area develops gradually. It increases in area for the first 52 hours reaching a maximum at 72 hours. Echogenic lines within the central area were first detected, on average, 44 hours after follicle evacuation. The echogenic lines within the central area are attributable to clotting and fibrinization of the contents. Fibrin-like material within the blood clot is echogenic, so images of corpora lutea with this morphology had an echogenic network interspersed within the anechoic area [48]. The development of a central fluid area did not alter circulating P4 concentrations or the length of the interovulatory interval [2].
c) Luteolysis
In the absence of a viable embryo, functional and structural regression of the CL occurs, event named luteolysis. A chronology of research findings in luteolysis in the mare for the past 40 years has been reported [49]. Luteolysis is divided in three stages: preluteolysis, luteolysis, and postluteolysis. Preluteolysis occurs before the beginning of regression of the corpus luteum (defined as Days 8–14). Luteolysis is the period during regression of the corpus luteum until P4 has decreased to < 1 ng/mL. The period after luteolysis when concentrations are < 1 ng/mL is termed postluteolysis. Luteal transition refers to the hour at the end of preluteolysis and beginning of luteolysis, and is based on P4 determinations every hour [50]. The transitional hour is selected subjectively by inspection of the P4 profile for each animal and is based on the beginning of a progressive decrease in P4 in the hourly blood samples [51]. In the mare, luteolysis begins on average 14 days after ovulation or 9 days before the next ovulation, and it lasts approximately 23 hours, based in hourly blood sampling [50,52]. In many species,
including mares, CL regression is due to multiple pulses of prostaglandin F2α (PGF2α) secreted in a pulsatile way by the nonpregnant uterus [53]. Concentrations of PGF2α in the systemic circulation are usually assessed by measuring its metabolite, 15-keto-13,14-dihydro-prostaglandin F2α (PGFM), owing to the short half-life of PGF2α [54,55]. Luteal regression involves secretion of PGF2α in several sequential pulses during the length of the luteolytic period (two to four pulses) [52,56]. The peak concentration does not differ between a preluteolytic and the transitional pulse (~ 45 pg/mL), but the peak concentrations increase progressively between the first luteolytic pulse (~ 78 pg/mL) and the second luteolystic pulse (~ 193 pg/mL) to the postluteolytic pulse (~ 305 pg/mL) [52]. The base of the PGFM concentrations is maintained throughout the three periods, but mechanisms exist for increasing the prominence of the pulses during luteolysis and postluteolysis. Contributing factors in this regard may be the increase in circulating E2 concentrations which begin to increase a few hours after transition and the decreasing P4 beginning at transition [52].
In mares the PGF2α pulse that initiates luteolysis (transitional pulse) is relatively small (approximately 50 pg/ml). Approximately eight hours before the transitional pulse, the CL is exposed in the majority of the mares (67%) to two or three preluteolytic PGFM pulses similar in magnitude to the transitional pulse at a mean of peak to peak interval of 8 hours, but luteolysis is not initiated at this time [52]. The absence of PGFM pulses during preluteolysis in 33% of the mares and the small pulses in the other 67% indicate that the PGFM pulses during preluteolysis are not physiologically essential to subsequent luteolysis in mares [52]. In addition, rhythmicity of PGFM pulses was not detected during preluteolysis, but was detected in seven of nine mares during luteolysis and postluteolysis [52]. Other temporally related hormones or factors seem to be involved in the initiation of luteolysis in mares by increasing the response of the CL to the small PGFM pulse at the hour of transition in mares [50,52]. Cortisol and E2 were associated temporally with a PGFM pulse during luteolysis but not with a pulse during preluteolysis or with the transitional pulse [57]. Estradiol does not begin to
increase until 5 hours after the transitional pulse [52]. Oxytocin concentrations don’t increase during the last PGFM preluteolytic pulse, but they increase and decrease simultaneously with the ascending and descending portion of the PGFM transitional pulse and with the first PGFM luteolytic pulse. The oxytocin increase seems to account at least partly for the decrease in P4 concentrations at the moment of transition from preluteolysis to luteolysis [50,57]. Oxytocin is synthesized in the hypothalamus and stored in the posterior pituitary. It is secreted in a pulsatile way, but its regulation during luteolysis is still unknown [58,59]. In mares the ovary is not a source of oxytocin contrarily to what is seen in domestic ruminants, where the CL synthesizes and secretes oxytocin during the estrous cycle [60,61]. The studies made to clarify oxytocin’s role during the estrous cycle showed that it appears to have a role in mares’ luteolysis as the intermediary that stimulates PGF secretion from the uterus [58,59]. However, it is not clear if oxytocin has a crucial role in the beginning of luteolysis.
In mares, P4 concentrations during luteolysis decrease linearly during the hours of a PGFM pulse and between the ending nadir of a pulse and the beginning nadir of the next pulse [52,62,63]. Substantial pulses of LH are detected during preluteolysis and luteolysis. During luteolysis, LH concentration approximately doubles relatively to preluteolysis. However, concentrations of P4 don’t increase within the 3 to 5 hours of an LH pulse, and a P4 fluctuation does not occur in synchrony with the LH pulse [52].
Concentrations of P4 ≤ 0.9 ng/mL are used to represent postluteolysis. Progesterone continues to slowly decline after the defined end of luteolysis. The decline in P4 from 0.9 to 0.1 ng/mL requires 22 to 32 hours [52]. It is unknown if the prominent PGFM pulses after the defined end of luteolysis are needed for the slow continuation of the decrease in P4 output by the corpus luteum or are used for another purpose [52].
1.2.3. Abnormalities of the estrous cycle
a) Hemorrhagic anovulatory follicles
A hematoma that forms in the antrum of a follicle instead of ovulation has been termed a hemorrhagic anovulatory follicle (HAF). Most of HAFs have a peripheral wall of luteal tissue, as indicated by echotexture [48]. A distinguishing feature between a corpus hemorrhagicum and an HAF is the clotting of blood immediately during extravasation into the evacuated antrum or developing corpus luteum versus delayed clotting when blood enters follicular fluid [64]. Also, anovulation is a requisite component of the HAF syndrome. In this regard, no pregnancies occurred in 71 inseminated mares that developed an HAF [65]. The oocyte is not discharged into the oviduct before or during HAF formation, but whether oocytes are trapped or detrimentally affected in septated evacuations is not known. The incidence of hemorrhagic anovulatory follicles is approximately 5% and 20% of estrous cycles during the early and late ovulatory season, respectively and are especially common (36%) in mares 20 or more years old [64]. In addition, 44% of the mares that formed an HAF repeated the formation during a subsequent estrous cycle [64]. An HAF can occur without a simultaneous ovulation or a second HAF during the late follicular phase, in conjunction with ovulation of another follicle, or during the luteal phase [64].
The morphology of ovulatory-sized follicles that formed HAFs during the late follicular phase has been compared with those of a solitary follicle that ovulated [66]. The diameter of a preovulatory follicle or future HAF one day before ovulation or formation of HAF, respectively, was similar between the two groups. The HAF formation involves entry of blood into a follicle that does not have altered structure. In addition, the follicle cells are viable, as indicated by luteinization of the wall of the HAF (luteinization is based on echotexture and approximately normal P4 production). However, the percentage of follicle wall with color
Doppler signals one day before ovulation or HAF formation was greater for the HAF group. The difference between the two groups in percentage of wall with color signals was attributable to vascularization of the follicle wall in the area of expected ovulation (apical area) in mares that formed an HAF but not in mares that ovulated. A difference in vascularity at the apex is compatible with null or minimal hemorrhage during ovulation and massive hemorrhage during HAF formation [64]. Concentrations of FSH, LH, and P4 were not different before ovulation between mares that developed HAF and mares that ovulated [66]. In both groups, the preovulatory E2 surge reached a peak two days before ovulation or anovulation or 3 days before the peak of the LH surge, as expected for ovulating mares [39]. Endometrial echotexture on the day of HAF formation is not different for mares that do not develop HAF. However, E2 was higher for mares that developed an HAF 3 days before HAF formation [66]. The role of elevated E2 in the formation of the HAF is not known.
Increased thickness of the wall of the expanding HAF presumably represents luteal tissue and is associated with P4 production during HAF development. The luteinized wall is well vascularized, and the vascularization remains extensive as the structure regresses. Circulating P4 concentrations increase from 1 day before to the day of formation of the HAF, similarly to what is observed for an ovulation. In addition, the length of the luteal phase and interovulatory intervals are similar between mares that develop an HAF and mares that ovulate [64].
b) Idiopathic persistence of the corpus luteum
As referred previously, luteolysis in mares begins in average 14 days after ovulation (range Day 14 to 16). A CL that fails to regress during the expected time of luteolysis in a non-pregnant mare is considered to be pathologically persistent [67]. This condition can affect 25% of estrous cycles [2]and can be related to ovulations late in diestrous, embryonic loss after the
time of maternal recognition of pregnancy and chronic uterine infections. However, this condition can be observed without any of these conditionants [67], and this is named as idiopathic persistent CL. A wide spectrum of terminology has been used throughout the years to name this syndrome. Terms as persistent corpus luteum, prolonged diestrus, prolonged luteal activity or pseudopregnancy were used for similar conditions that if analyzed carefully may differ from each other [68]. Animals presenting persistent CL have P4 concentrations >1 ng/ml for about 63 days (range: 35 to 95 days) [2,68-70].
The idiopathic persistent CL has been suggested to be associated with low concentrations of PGF2α secreted from the uterus in the days that luteolysis is expected to occur, but the mechanism behind this condition is still unknown [2,68,71]. Most of the studies done in this area were made before the availability of ultrasound technology, so it was difficult to know if the cause of the prolonged diestrus was a prolonged primary CL (CL formed from a follicle that ovulated at the last estrus), a CL derived from an ovulation late in diestrus (CL is immature and subsequently non-responsive to PGF2α secreted at the normal time of luteolysis) or from an hemorrhagic anovulatory follicle with luteinized tissue [68]. Further studies with maintenance of the identity of the primary CL will be needed to characterize the mechanism that leads to idiopathic persistent CL.
List of publications
Published papers
Oxytocin induction of pulses of a prostaglandin metabolite and luteolysis in mares.
Santos, V.G., Castro, T., Bettencourt, E.M., Ginther, O.J.. Oxytocin induction of pulses of a prostaglandin metabolite and luteolysis in mares. Theriogenology 2015; 83:730– 738.
Role of PGF2α in luteolysis based on inhibition of PGF2α synthesis in the mare.
Santos VG, Beg MA, Bettencourt EM, Ginther OJ. Role of PGF2α in luteolysis based on inhibition of PGF2α synthesis in the mare. Theriogenology 2013; 80:812–20.
Hormonal, luteal, and follicular changes during initiation of persistent corpus luteum in mares.
Santos, V.G., Bettencourt, E.M., Ginther, O.J.. Hormonal, luteal, and follicular changes during initiation of persistent corpus luteum in mares. Theriogenology 2015; 83:757– 765.
.
Papers submitted to publication
Long-term characteristics of idiopathic persistent corpus luteum in the mare.
Santos, V.G., Bettencourt, E.M., Ginther, O.J.. Long-term characteristics of idiopathic persistent corpus luteum in the mare. Theriogenology (Submitted).
2. Oxytocin induction of pulses of a prostaglandin metabolite and
luteolysis in mares.
V.G. Santosa,b,c, T. Castroa,c, E.M. Bettencourtb, O.J. Ginthera,c
aEutheria Foundation, Cross Plains, Wisconsin 53528, USA
bDepartamento de Medicina Veterinária, Escola de Ciências e Tecnologia, Instituto de Ciências Agrárias e Ambientais Mediterrânicas, Instituto de Investigação e Formação Avançada, Universidade de Évora, Núcleo da Mitra, 7000 Évora, Portugal
cDepartment of Pathobiological Sciences, School of Veterinary Medicine, University of Wisconsin-Madison, Madison, Wisconsin 53706, USA
Abstract
A procedure for oxytocin (OT) administration on Day 13 postovulation was developed in mares for stimulation of a pulse of PGFM (a PGF2α metabolite) that mimics a natural PGFM pulse during luteolysis. Bolus treatment with each of five OT doses (1 to 10 IU/mare, n = 3) stimulated a burst of PGFM that was maximum in 4 min and was unlike a natural pulse. A 2-h OT infusion of 1.25, 2.5 or 5 IU/100 kg (n = 4) induced a PGFM pulse similar to reported pulses; lower doses did not. The peak of an induced pulse (~260 to 380 pg/mL) seemed similar to reported natural peaks (~200 to 300 pg/mL), using the same assay system. The interval from nadir to nadir was 6.6 ± 0.2 h. Percentage decrease in progesterone (P4) within 8 h was greater (P < 0.05) for doses of 1.25, 2.5 or 5 IU/100 kg (43 to 50%) than for a vehicle group (11%). Treatment with flunixin meglumine (1.0 mg/kg), a cyclooxygenase inhibitor, decreased (P < 0.008) PGFM concentration but treatment 2 h before the beginning of OT infusion (2.5 IU/100 kg) did not prevent the OT-induced PGFM pulses and the decrease in P4. In conclusion, a PGFM pulse was simulated by infusion of OT during 2 h but not by a single OT bolus, and an OT-simulated PGFM pulse stimulated a decrease in P4 that was not prevented by a cyclooxygenase inhibitor. These are the first firm demonstrations that OT in mares as in other species has a role in luteolysis.
2.1. Introduction
The regression of the corpus luteum (CL) or luteolysis is a pivotal reproductive event during the estrous cycle in farm species, including mares. Luteolysis represents a decrease in progesterone (P4) from the response of the CL to the secretion of prostaglandin F2α (PGF2α) by the endometrium (review [1]). In the mare, luteolysis begins on average on Day 14 (Day 0 = ovulation) and lasts 23 h based on hourly blood sampling [2]. The end of luteolysis is defined as a P4 decrease to < 1 ng/mL [3]. The main plasma PGF2α metabolite is 15-keto-13,14-dihydro-prostaglandin F2α (PGFM) [4]. The metabolite has a longer half-life and is often used to represent circulating concentrations of PGF2α [5]. In many species, including mares, complete luteolysis requires secretion of multiple pulses of PGF2α by the nongravid uterus [6]. The interval between the peaks of sequential PGFM pulses in mares is 9 h and the interval from nadir to nadir at the PGFM base is 5 h [6]. Inhibition of PGF2α secretion at the expected time of luteolysis with a cyclooxygenase inhibitor (flunixin meglumine) induces a delay in the beginning of luteolysis [7].
Based on hourly blood sampling, the transition into the luteolytic period in mares is manifested within 1 h [8]. Pulses of PGFM are relatively small before luteolysis (e.g., peak 30 ng/mL) compared to during luteolysis (e.g., 190 ng/mL) [8]. Each PGFM pulse that occurs during luteolysis is temporally associated with a pulse of oxytocin (OT) [9]. The small transitional pulse at the hour of the initiation of luteolysis is also associated with a pulse of OT, whereas previous small PGFM pulses are not [10]. Oxytocin therefore may play a role in the effectiveness of a PGF2α pulse during luteolysis as well as the effectiveness of the small transitional pulse at the initiation of luteolysis in mares (review [2]).
Oxytocin is synthesized in the hypothalamus, stored in the posterior pituitary, and secreted in pulses [11,12]. The CL also synthesizes and secretes OT during the estrous cycle in domestic ruminants [13,14], but the CL apparently does not secrete OT in mares [15].
Circulating concentration of OT in mares is greater at the expected time of luteolysis (Day 15) than before luteolysis (Days 0, 3, or 7) [12]. The role of OT during spontaneous luteolysis has not been clarified in mares, but in other farm species OT is an intermediary in the stimulation of PGF2α secretion from the uterus (review, [16]). In previous studies on the effect of exogenous OT on PGFM in mares, the doses were apparently based on clinical recommendations (e.g., 20 IU to evacuate the uterus [17]). Treatment of nonpregnant mares with OT doses of 10 to 25 IU [18-21] or the OT response to uterine biopsy [22,23] stimulates an increase in PGFM. The OT treatments are especially effective near the expected day of luteolysis when the number of uterine OT receptors is maximum (Days 14 to 17) [22–24]. Despite the induced increase in PGFM, a negative effect of OT treatment on circulating P4 concentration has not been documented in mares.
Treatment with OT early in the estrous cycle in cattle is luteolytic [25], but in mares treatment on Days 1 through 7 with a high dose (200 IU [26]) or on Days 4 to 8 (150 IU [27]) did not induce luteolysis or shorten the interovulatory interval (IOI). In this regard, the number of OT receptors in the uterus is minimal on Days 4 to 8 in mares [27]. Despite the stimulation of PGFM by OT doses of 10 to 25 IU/mare [18,20], chronic administration of OT in high doses (e.g., 60 IU/day on Days 7 to 14) prolongs the luteal phase at least until Day 30 [28–31]. Furthermore, 60 IU of OT on Days 8 to 14 prolongs the luteal phase (P4 > 1.0 ng/mL through Day 30), reduces endometrial cyclooxygenase-2 expression, and lowers plasma concentrations of PGFM [31].
The dose and method of OT administration that could be considered physiologic in mares are unknown. That is, the effect of OT treatment on the CL has been examined only on a pharmacologic basis. The objectives for the current studies in mares were (1) to determine a dose and method of administration of OT that will stimulate a PGFM pulse similar to a spontaneous pulse and (2) to study the role of OT in luteolysis. The hypotheses were (1) simulation of a PGFM pulse can be done by infusion of a specific dose of OT during 2 h but
not by a single OT bolus dose, (2) OT induction of a simulated PGFM pulse stimulates a decrease in P4, and (3) OT exerts a luteolytic effect only through stimulation of PGF2α secretion.
2.2. Materials and methods
2.2.1. Mares and treatments
Mixed breeds (light, riding-type horses and apparent pony-horse crosses) of 21 nonlactating mares aged 4 to 18 y and weighing 300 to 600 kg were used in the northern temperate zone. Abnormalities of the reproductive tract were not detected by transrectal ultrasonic scanning [32]. The mares had not been bred for at least 3 y. The mares were housed under natural light in an open shelter and outdoor paddock and were maintained by free access to primarily grass hay, trace-mineralized salt, and water. All mares remained healthy and in good body condition throughout the studies. Animals were handled according to the United States Department of Agriculture Guide for Care and Use of Agricultural Animals in Agricultural Research and Teaching. Mares were examined daily throughout each of four experiments by transrectal ultrasonic imaging as described [32]. A duplex B-mode (gray scale) and color-Doppler instrument equipped with a linear-array 7.5-MHz transducer was used. The day of ovulation was designated Day 0.
Mares were assigned by randomization to experimental groups, including a vehicle or control group (0 dose). Each designated treatment in each experiment was given into a jugular vein. Oxytocin (Oxytocin injection®, Bimeda, Inc., Le Sueur, MN, USA) was used in each experiment. Flunixin meglumine (FM; FluMeglumine, Phoenix, St Joseph, MO, USA) was also used in experiments 3 and 4. The FM acts on cyclooxygenase enzymes in the endometrium