CORRELATION AND LINEAR REGRESSION
Recebido em 26/11/2016. Aprovado em 10/01/2017. Avaliado pelo sistema double blind peer review.
Ivano Ribeiro1 Antonio Oliveira de Carvalho2 Renato Fabiano Cintra3 Alessandra Cassol4 Abstract:
The objective of this study is to present a basic tutorial on the main statistical techniques used for analyses of data in researches on applied social sciences. The selected techniques were, respectively, Exploratory Factorial Analysis (EFA), Correlation and Linear Regression Analyses. For the development of the tutorial, databases of two studies performed in Brazil were used, which permitted the application of the selected techniques in an illustrative and didactical manner. Based on the theoretical foundations present in literature, the main procedures to be adopted are presented as well as the assumptions to be observed in each of the described techniques. As a contribution to students, researchers, reviewers and other interested parties, the study presents a step-by-step permitting a basic understanding of the main multivariate techniques used in quantitative analyses.
Keywords: Quantitative research; Statistical techniques; Survey.
MÉTODOS QUANTITATIVOS: UM TUTORIAL BÁSICO SOBRE O
USO DAS TÉCNICAS DE ANÁLISE FATORIAL EXPLORATÓRIA
(AFE), CORRELAÇÃO E REGRESSÃO LINEAR
Resumo:O objetivo deste trabalho é apresentar um tutorial básico sobre as principais técnicas estatísticas utilizadas para análise de dados em pesquisas nas ciências sociais aplicadas. As técnicas escolhidas foram respectivamente, Análise Fatorial Exploratória (AFE), Correlação e Regressão Linear. Para desenvolvimento do tutorial, foram utilizadas as bases de dados de dois trabalhos realizados no Brasil, as quais possibilitaram a aplicação das técnicas selecionadas de forma ilustrativa e didática. A partir dos fundamentos teóricos presentes na literatura, são apresentados os principais procedimentos a serem adotados e os pressupostos a serem observados em cada uma das técnicas descritas. Como contribuição para estudantes, pesquisadores, avaliadores e outros interessados, o estudo apresenta um passo a passo que
1
Doutor em Administração pela Universidade Nove de Julho (UNINOVE). Professor do Centro de Ciências Sociais Aplicadas da Universidade Estadual do Oeste do Paraná (UNIOESTE) E-mail: [email protected]
2
Doutorando em Administração pela Universidade Nove de Julho (UNINOVE). Professor do Centro Universitário Jorge Amado (UNIJORGE) E-mail: [email protected]
3
Doutorando em Administração pela Universidade Nove de Julho (UNINOVE). Administrador efetivo na Universidade Federal da Grande Dourados (UFGD) E-mail: [email protected]
4
Doutoranda em Administração pela Universidade Nove de Julho (UNINOVE). Professora da Universidade do Contestado (UNC) E-mail: [email protected]
27 possibilita um entendimento básico das principais técnicas multivariadas utilizadas em análises quantitativas.
Palavras-chave: Pesquisa quantitativa; Técnicas estatísticas; Survey.
1 INTRODUCTION
One of the most important aspects for the development of science in its sundry fields is research. For Leite (2008), there is no science without research and there cannot be any research without science. It is through research that scientific progress occurs and the objectives of science, serving as an instrument in the development of mankind and its society, are attained.
Science is defined by epistemology as being a specific set of scientific knowledge, systemized, with a method, technique and own purposes. The method is conceived as a set of systematic and rational activities that, with greater safety, permit science to reach its objectives for generating valid knowledge. For Galiano (1995) method is a set of rational processes used for obtaining a result or a theoretical or practical purpose. Leite (2008) emphasizes that the scientific method has its own path or methodology in the process of observation of facts, and from these, compares the facts observed with: laws, hypothesis and scientific theories. Silveira et al. (2009) emphasizes that the method has its aim to indicate a set of phases, in a systematic manner and logically organized, which are developed throughout an investigation or research.
Among the various classifications of scientific methods, we may stress the classification between the qualitative and the quantitative method, and then conform to the second as object of analysis and exploration in this paper. According to Neves (1996) and Bryman (2006) the qualitative and quantitative methods are not mutually excluding, once the qualitative methods contribute towards the sciences through the mixture of procedures of a rational and intuitive character which permit the comprehension of a phenomena, nevertheless do not exclude the possibility of the application of quantitative techniques. Leite (2008) defines quantitative methods as those using statistics and mathematics, from numbers and calculations, as the main resource for analysis of the information.
Among the aspects that compound the routine of Social Sciences, is the measurement of phenomena that cannot be directly observed. Blalock (1974) considers that the development of theory is something important in the history of social sciences, nevertheless, the most serious and important issues that demand the attention of researchers and scientists are: conceptualization and measurement. The idea of quantification encompasses procedures, techniques and algorithms that support the researcher in the extraction of the data and subsidies for answering to the questions and established objective (ROCHA-FALCÃO; RÉGNIER, 2000). He emphasizes that the use of statistics for data analysis has been intensified in the last decades and that the methods of analysis have been improved, greatly due to information technology and specific software.
The use of multivariate analyses, defined by Corrar, Paulo and Dias-Filho (2009) as a set of statistic methods that permit the simultaneous analysis of multiple measures of an individual, phenomena or object observed, is increasingly intense. Pereira (2004) highlights that, despite the fact that in some situations the isolation and separate analysis of variables are
28 useful, in most cases, the analyses are interrelated and, in this manner, simultaneous analysis becomes important. When the variables comprising a set of data or construct to be analyzed, even when these are random, when these are interrelated, the effects cannot be significantly interpreted in a separate manner (HAIR et al., 2009).
Among the various techniques of multivariate analyses, included in the quantitative methods in the field of applied social sciences, three were selected to present the present paper. The first is Exploratory Factorial Analysis (EFA), which Tabachnick and Fidell (2001) define as a technique applied to a set of variables over which it is aimed to discover which of these form coherent and independent subsets among them. The second technique is Correlation, defined by Jupp (2006), as a linear relation between two variables or constructs. For the author the correlation coefficient represents a measure of the association between two numerical variables, generally designated by x and y. And the third, a Linear Regression (LR), defined by Toledo and Ovalle (1995), as a technique that has as its purpose to describe the existing relation between two variables through a mathematical model.
The purpose of this article is to present a tutorial on the application of these three techniques using the data of empirical studies performed in Brazil, with a description of the procedures and results for each technique. For the development of this research two databases were used, applying the Exploratory Factorial Analysis, Linear Correlation and Linear Regression. In this manner, the objective was to demonstrate the possibilities of applying the analysis techniques and, obtaining different results from one database.
The results of the analyses demonstrate the possibility and efficacy of the application of statistical techniques, for each expected objective. Thus, the study supplies a simplified vision (in a tutorial manner) which facilitates the interpretation of studies that use these forms of analysis. Furthermore when used in quantitative studies in the most diversified fields of knowledge, once it presents the objectives and basic assumptions for using each of the three techniques.
Moreover, there is the contribution of distinct aspects of research already mentioned in this field and in the national scenario, as is the case of Ringle, Silva and Bido (2014) who presented the methodological procedures for structural equation modeling as models for the measurement of partial least squares (PLS); Desjeux, Suarez and Campos (2014) who presented the itinerary methods for consumption in management; Malhotra, Lopes and Viega (2014) present the main characteristics of LISREL, its features and, by means of didactical examples, reduce the difficulties perceived in its use; Hair, Gabriel and Patel (2014) concentrate on the CB-SEM with AMOS to illustrate its application in the analysis of relations between guidance to the client, guidance to employees and performance of the company; and Hernandez, Basso and Brandão (2014) discuss the main elements for performing an experimental study, as well as stimulating researchers in its use as a method of research.
2 STATISTICAL METHODS
In this section we present the main references on which this research is substantiated, whereby the arguments and definitions support the demonstrated and analyzed aspects. Collier, Brady and Seawright (2004) emphasize that the center for evaluation of the results of a research is the credibility of the method employed. For the authors it is the rigorous use of a method that will distinguish the systematic knowledge of other forms of knowledge.
29 Factorial analysis, according to Marôco (2011), is an exploratory analysis technique which has the purpose of discovering and analyzing the structure of a set of interrelated variables, with the aim of constructing a scale of measures for these factors which, in some manner, controls the behavior of the original variables. This argument is corroborated by Fávero et al. (2009), who define this analysis modality as a multivariate technique which aims to discover a relatively small number of common factors that may represent the relations between a larger group of interrelated variables. Despite this being widely considered a statistical technique, Bartholomew (1984), considers factorial analysis as a method in which the theoretical foundations are somewhat obscure lacking, according to the author, further exploration and explanation.
According to Hair et al. (2009), through factorial analysis, each one of the variables can be defined as a linear combination of the common factors that will explain the portion of variance of each variable, plus a deviation that summarizes the portion of the total variance unexplained by these factors. Reis (1997) defines factorial analysis as a set of techniques which have the objective of representing or describing a number of initial variables from a lesser number of hypothetical variables. For Corrar, Paulo and Dias-Filho (2009), EFA has the purpose of identifying a means of condensing the information of a set of original interrelated variables into a smaller set, with minimum loss, in order to summarize the data of the variables and explain the relations between them.
There is, nevertheless, the need to distinguish two forms of factorial analysis: exploratory and confirmatory. Exploratory Factorial Analysis (EFA), which concerns the present study, is defined by Mingoti (2005) as a technique that aims to find subjacent factors to the variables used in the sample. For the author, when the researcher uses this analysis, there is not clear notion, a priori, of the amount of factors that compose the model and also what these represent.
As highlighted by Hair et al. (2009), when analyzing the interrelations of a set of observed variables, research, with the use of EFA is capable of defining the factors that explain the covariance in the best manner. Brown (2006) observes that we must consider the variables observed as belonging to the same factor when these share a common variance, in other words, are influenced by the same subjacent construct. For the author, one factor is a latent variable (for example, a hindering aspect in the feasibility of startups) which influences more than one variable observed (for example, difficulty in planning finances; high tax burden…), representing, in this manner, the covariance amongst them. For Figueiredo-Filho and Silva-Junior (2010a), EFA is the most adequate technique for measuring the behavior and relations between the phenomena that cannot be directly observed.
2.2 Correlation
To correlate is to establish a corresponding relationship, between two things, people, and viewpoints. According to Moore and McCabe (1989) correlation is a statistical measurement technique that measures the strength and the direction of the existing linear relationship between two quantitative variables. This definition is corroborated by Figueiredo-Filho and Silva-Junior (2010b) who define correlation as being a measurement that analyzes the linear association between quantitative variables. For Andrade (2002) the search for association among variables is one of the most frequent purposes of empirical researches, whereby the possible existence of a relationship between variables, which guide the analyses and the obtainment of conclusions and evidences in the analyzed phenomena.
Andrade (2002) highlights that correlation is a measure of association that is independent of the individual units of measure of the variables. Levine (2005) states that
30 correlation measures the strength of the association between numerical values. In other words, it is the relationship between quantifiable factors or phenomena. Correlation between two variables is verified when one is related to the other in some manner and, having the alteration in the value of one of them (independent variable) results in an alteration to the value of the other (dependent variable) in an instant manner.
Two variables are associated when they have between them similarities in the distribution of their scores and may become associated as of the distribution of frequencies or in the sharing of variances, and this relationship is measured using the coefficient of correlation. For Cohen (1977) the coefficient of correlation, which the most well known is Pearson (r), varies from -1 to 1, whereby the sign indicates the positive or negative direction of the relationship between the variables. The coefficient of correlation is thus a measurement of association between two numerical, quantifiable values, generally termed in an equation as x and y (JUPP, 2006). For Hair et al. (2009) the adoption of correlation is considered adequate when the purpose is only to understand the relationship between analyzed variables or constructs and the patterns of these relationships.
2.3 Linear regression
According to Powell (1984), among the recent important advances in the quantitative methods of analysis with application and models of limited dependent variables, emphasis is given to the regression models, which according to the author analyze a range of dependent variables restricted to one subset. For Levine (2005) regression is used to predict values of a dependent variable or output variable, based on the values of at least one independent or explanatory variable.
Linear Regression Analysis (LRA) is a statistical technique using the relationship between two or more variables of a quantitative or qualitative nature, where one of the variables can be predicted by the others. Bruni (2013), stresses that LRA has as its objective the obtainment of a mathematical equation that represents the best relationship between the linear numerical among sets of distinct sets of variable data. Linear regression analysis is an adequate technique for studies that have the purpose of explaining how social security variables (dependent) respond to changes in independent variables (HAIR et al., 2009; KUTNER, 1996).
Hair et al. (2009) defined LRA as a statistical technique used for analysis of a relationship between a dependent variable and various independent variables. The author states that the regression variable is constituted from the set of weighted independent variables, in other words, from the linear combination of independent variables that are able to predict the dependent variable. The coefficients (β), which represent the weights of each variable represent how much each variable contributes to predict or explain the model or construct. The multiple correlation coefficients, or multiple determination coefficients (R2), determines the intensity of the relation stipulated by the multiple regression equation. Malhotra (2001) emphasizes that o R2 has variations between 0 and 1 and this variation indicates the degree of total variation of the dependent variable, which is explained by the constructed model.
3 METHOD
For carrying out this research, two databases were used. The first by Carvalho, Ribeiro and Cunha (2015) related to a research on factors hindering the feasibility of startups in Brazil. The research was performed in the period of April and May, 2015 by means of a survey sent electronically, which obtained a total of 131 respondents from 13 states of Brazil comprised by individuals classified by type of relationship with the startups, such as:
31 entrepreneurs, potential entrepreneurs, researchers, professionals from public mechanisms of support for business incubators and/or accelerators. The instrument used in the study comprised of a five point scale, being: (1) Totally disagree, (2) Slightly disagree, (3) Do not disagree, nor agree, (4) Slightly agree, and (5) Totally agree, as per Figure 1.
Q01-Lack of capacity for business planning
Q02-Lack of capacity for facing the risks of the type of business Q03-Lack of capacity for facing initial financial restrictions Q04-Lack of specific knowledge of the area of enterprise
Q05-Lack of capacity for analyzing the feasibility of the business Q06-Lack of business administration knowledge
Q07-Lack of financial administration knowledge Q08-Lack of capacity for people management
Q09-Lack of capacity for mobilizing resources and attract financing Q10-High tax burden
Q11-High bureaucracy for opening and maintaining business
Q12-Difficulty in finding qualified professionals and available to be professionally involved with a startup
Q13-Lack of financial support from credit institutions
Q14-Technological changes rapidly alter consumer preferences Q15-Lack of angel investors (financial support from businessmen) Q16-Lack of financial support from public mechanisms of support
Q17-Insufficient technical support from incubators, accelerators and other organisms Q18-Vulnerability of the national economy (economic insecurity)
Figure 1. Questions of the survey instrument
Source: Prepared from Carvalho, Ribeiro and Cunha (2016).
The second database used is related to a study with Brazilian multinational companies, where aspects related to international experience, business diversification and degree of internationalization of multinational companies were verified, data is from the study of Ribeiro and Serra (2015). From these two databases a tutorial is realized, aiming to point out some basic assumptions for each form of analysis - EFA, Correlation and Linear Regression. Initially we made an explanation on Exploratory Factorial Analysis (EFA), and we further highlight that all the analyses were performed using the software IBM SPSS, v. 20. We also point out that we “do not” present the outputs from the software for each test performed, once the objective is to present a tutorial on the analyzed tests, and not on the use of certain software.
32
4 DATABASE DESIGN AND ANALYSIS
One of the first phases after data collection is to structure the data in such a manner as to permit a quantitative analysis. To do so, one of the most usual forms is the preparation of an electronic worksheet on which the data is arranged in lines and columns represented by numerical or descriptive data. In order to attain our objective in this study two databases were used, as previously described. In Tables 1 and 2, we demonstrate forms that can be used to organize the information from the research, permitting its analysis by most of the software for analysis of quantitative data.
Table 1. First model for structuring the database
State Formation Age Gender Q1 Q2 Q3 Q4 Q5 Q6 Q7 Q8 Q9 Q10 Q11 Q12 Q13 Q14 Q15 Q16 Q17 Q18
Bahia Master 36-45 Men 4 4 4 4 3 5 2 3 4 4 5 2 3 2 4 4 5
Paraná Master 36-45 Men 5 5 5 5 5 5 5 5 5 5 5 5 5 5 5 5 5 5
São Paulo Master 36-45 Men 5 3 4 2 2 4 4 3 4 5 5 3 4 3 2 1 2 4
Bahia Master 36-45 Men 4 4 3 4 3 4 5 4 5 2 3 4 2 5 4 4 2 5
Santa Catarina
Technical
education 15-25 Woman 3 4 5 2 4 4 5 3 2 5 4 2 5 4 2 4 4 5
Bahia Specialization 26-35 Men 4 4 4 4 4 4 4 4 3 5 5 4 3 4 3 4 5 5
Alagoas Graduate 26-35 Men 4 3 4 2 4 3 4 5 4 5 3 2 3 3 4 5 4 3
Alagoas PHD 26-35 Men 4 5 4 3 4 5 5 4 5 4 3 3 3 3 2 4 5 2
Alagoas PHD 36-45 Men 5 5 3 3 3 5 3 5 4 2 2 5 2 1 2 1 2 5
Alagoas Master 26-35 Men 5 5 5 5 5 5 5 5 3 5 5 3 3 4 4 4 4 3
Bahia Graduate 26-35 Men 5 3 4 1 1 2 2 4 5 5 5 5 5 3 1 5 5 5
Alagoas Graduate 15-25 Men 1 2 4 2 3 4 5 4 5 2 1 4 3 4 3 3 4 2
Alagoas Graduate 15-25 Men 4 3 2 3 4 3 3 4 3 4 2 4 3 3 2 3 1 2
Bahia Graduate 15-25 Woman 4 4 4 2 4 4 4 2 4 2 2 4 2 1 4 4 4 5
Bahia Graduate 15-25 Men 3 4 2 3 4 3 4 5 4 2 2 4 3 1 2 2 2 1
Bahia Graduate 26-35 Men 4 2 3 1 3 4 5 3 5 1 1 1 5 3 5 5 2 3
Bahia Graduate 15-25 Woman 2 3 4 2 4 1 4 4 3 5 5 3 3 3 2 2 2 4
Alagoas Graduate 15-25 Men 3 4 3 5 4 4 4 3 2 4 4 5 5 4 2 3 5 5
Source: Prepared by Carvalho, Ribeiro and Cunha (2016).
As can be observed in Table 1 the lines represent the information from each respondent, and the columns represent the research variables. It can be observed that in the first four columns there are descriptive information (nominal variables), nevertheless, according to the objectives of the analysis some of the data can be transformed to ordinal variables (such as columns 2, 3 and 4), once the first can only be used for a characterization of the sample or for an eventual separation of groups for comparison.
In the same manner as in Table 1, Table 2 also has structured values. It can be observed that in this case, column 3 (variable control 2) was codified in a dummy variable, in other words, a binary value that assumed values of 0 and 1. For example, this technique can be used to identify gender: male (0) and female (1); publicly held (0) privately held (1) and other variables that need this treatment. The order shall be the choice of the researcher, being important always to identify the text as was performed in this codification.
33 N Control variable (1) Control variable (2) Control variable (3) I ndependent variable (1) I ndependent variable (2) Dependent variable 1 3 0 53 27 1 0,13 2 2 0 55 10 1 0,03 3 5 1 67 18 1 0,19 4 2 0 28 13 1 0,09 5 3 1 81 15 3 0,27 6 3 1 22 7 1 0,04 7 3 0 76 45 6 0,25 8 3 0 63 5 1 0,00 9 2 1 20 12 1 0,21 10 2 0 52 10 1 0,14 11 1 1 74 14 1 0,08
Source: Prepared by Ribeiro and Serra (2015).
These two databases expose only a small part of the totality of the data. This is due to the high quantity of data present, having presented only an example of the structure. The original data (totality of the data) was used for the following analyses.
4.1 Application of the exploratory factorial analysis
For the execution of the factorial analysis it is important to observe some assumptions, such as the size of the sample which must be above 5 respondents per variable analyzed. Thus, should one wish to perform an EFA with 10 items in each scale, the minimum sample must be of 50 respondents. Another matter is the attention to the Kaiser Meyer Olkin (KMO) values and the Bartlett sphericity test, which are tests that can offer greater safety in the use of factorial analysis. Both these tests indicate the degree of adjustment of data for factorial analysis, in other words, the level of reliability expected from the data when used (Hair et al., 2009).
The first of these KMO presents normalized values (between 0 and 1.0) and demonstrates the proportion of variance that the variables (questions of the instrument used) present in common, or the proportionality of the questions within the factors. The KMO has as its critical value 0.60, and should only be performed when the result is equal or above this value (HAIR et al., 2009 e DEVELLIS, 1991). On the other hand, the Bartlett Sphericity test is based on the statistical distribution of “chi-squared” and tests the null hypothesis (H0) from a correlation matrix, levels of significance p < 0.05 indicate that the matrix is liable for analysis using the factorial method (HAIR et al., 2009; MARÔCO, 2009).
In this first example (EFA) the possibility of using all the items of the scale was verified, using the method of the Principal Component Analysis (PCA) with varimax rotation, being the most used method in social sciences (HAIR et al., 2009). In this manner we observed that some items aggregate to two or more factors, even when this is not a rule, the items can be gradually removed from the analyses, in the same manner that items that do not group to any “isolated” factor. In this phase it is important that the items be removed gradually, once when “rotated again” isolated items can aggregate to a new factor, deserving in this manner, a new observation. Another observation can be performed from the screen
plot, where it is possible to verify the quantity of factors extracted by means of the greater eigenvalues, in this case retaining factors with values of over 1.
34 Obeying this criterion, three items were eliminated, these being: Q9- Lack of capacity for mobilizing resources and attract financing; Q18- Vulnerability of the national economy (economic insecurity); and Q2- Lack of capacity for facing the risks of the type of business. Another two items were removed once they aggregate to a factor that presented the Cronbach’s Alpha value, below the stipulated amount for this test, these items were: Q14- Technological changes rapidly alter consumer preferences; and Q12- Difficulty in finding qualified professionals and available to be professionally involved with a startup.
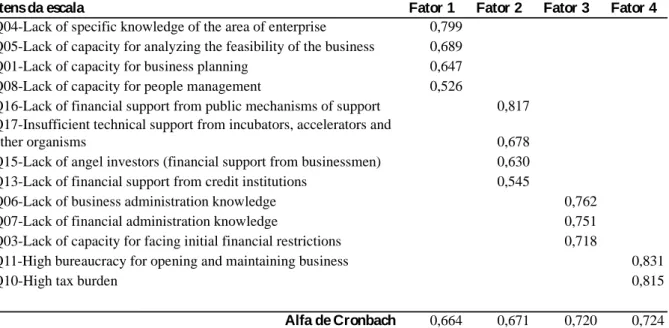
Table 3. Exploratory Factorial Analysis of the items of the scale
I tens da escala Fator 1 Fator 2 Fator 3 Fator 4
Q04-Lack of specific knowledge of the area of enterprise 0,799 Q05-Lack of capacity for analyzing the feasibility of the business 0,689 Q01-Lack of capacity for business planning 0,647 Q08-Lack of capacity for people management 0,526
Q16-Lack of financial support from public mechanisms of support 0,817 Q17-Insufficient technical support from incubators, accelerators and
other organisms 0,678
Q15-Lack of angel investors (financial support from businessmen) 0,630 Q13-Lack of financial support from credit institutions 0,545
Q06-Lack of business administration knowledge 0,762
Q07-Lack of financial administration knowledge 0,751
Q03-Lack of capacity for facing initial financial restrictions 0,718
Q11-High bureaucracy for opening and maintaining business 0,831
Q10-High tax burden 0,815
Alfa de Cronbach 0,664 0,671 0,720 0,724
Variância explicada (%) 14,78 27,98 40,76 52,52 Extraction Method: Principal Component Analysis.
Rotation Method: Varimax with Kaiser Normalization.
Source: Carvalho, Ribeiro and Cunha (2016).
It was observed that 13 items formed the factorial model and four factors were retained, as per Table 3. In the case of the EFA it is fundamental to observe factorial loads of over (0.40), and a form of improving the visualization of the items is to suppress the results below these levels. From these observations the next step is to verify the total variance explained and Cronbach’s Alpha value for each construct. In this case, the total variance of the model was of 52%, observing that the higher this value the greater is the explanatory power of the model, and generally a minimum variance of 50% is accepted. The Cronbach’s Alpha coefficients should have values within the limits accepted in the literature, despite not being a consensus, in social sciences values of 0,600, are held as being the minimum acceptable values for this analysis (MARÔCO, 2009). Should there occur some item with a value below the established amount, it can be removed and a new analysis performed.
Thus, the next step is to appoint a name for each factor, and for this effect the researcher must justify the choices. Below are examples of how to justify the names of the
35 factors extracted in the EFA, as per the results of Table 3. This justification should be preferably made by means of a solid theoretical base or results from prior studies. In the specific case of the presented study the names were appointed to the factors in the following manner: Factor 1 – Planning and management of the business; Factor 2 - Technical and financial support; Factor 3 – Administrative and financial management; Factor 4 – Taxes and bureaucracy.
4.2 Application of linear correlation
Among the various existing correlation tests two stand-out, Pearson Correlation and Spearman Correlation, with the first being a parametric test and the second non-parametric. Once the data used by this tutorial are presented as normal, the Pearson Correlation was used for this phase. For this purpose we prepared a matrix of correlations, as observed in Table 4.
Table 4. Exploratory Factorial Analysis
Fatores 1 2 3 4
1 Planning and management 1
2 Technical and financial support 0,112 1
3 Administrative and financial management ,506** 0,097 1
4 Taxes and bureaucracy 0,168 ,246** 0,061 1
** Correlation is significant at the 0.01 level (2-tailed). Source: Carvalho, Ribeiro and Cunha (2016).
We emphasize that this analysis may also be performed even before the application of an EFA, where it is possible to observe all of the variables belonging to an instrument. The existing or non-existing correlations can be another indication for the option of using the Factorial method. Nevertheless, in the present study we opted to perform correlations only for the variables extracted from the factorial analysis, and can observe the existence of some significant correlations, reinforcing that the correlations can be positive or negative.
In this case, the two significant correlations observed were positive, in other words, the planning and management factor is positively related to the administrative and financial management. While the factor taxes and bureaucracy is positively related to the technical and financial support factor. We emphasize that in one of the studies these associations deserved a more profound analysis, which was not performed here due to the specific purposes of this tutorial. Among the indications described about the interpretation of the values, we emphasize Dancey and Reidy (2006), which point that a correlation of (0.10 to 0.30) is weak, (0.40 to 0.60) is moderate, and over (0.70) is strong. In the next session we shall discuss linear regression.
4.3 Application of linear regression
Linear Regression is a widely used technique in quantitative studies searching for the explanation of an event (variable y) by means of (one or a set) explanatory variables (variable x). For this explanation we used the database presented under Table 2, nevertheless in its complete version. In this analysis which independent variables that explain the variation of a determined dependent variable were investigated, and also control variables were used for the control of the models prepared.
It should be noted that linear regression can be simple, where there is only one explanatory variable (independent) or multiple that refers to two or more explanatory variables. The use of linear regression is conditioned to the normality of the data, this normality can be attested through various tests, nevertheless, the most common being:
36 Komogorov-Smirnov and Shapiro-Wilk. In the case of smaller samples (<50 cases), the best option is for the Shapiro-Wilk test. In both tests a value below the established significance (value p) indicates a deviation in the distribution of the data in relation to the Normal Curve.
Another important issue in this analysis is the observation of indications of multicollinearity, a phenomenon that occurs when independent variables have exact or approximate linear relations. Thus, it is important to execute the Variance Inflation Factor (VIF) test, to confirm the nonexistence of this occurrence (Hair et al., 2009). Once again there is no consensus about the exact limits of this test, nevertheless, values over 10 are described as problematic.
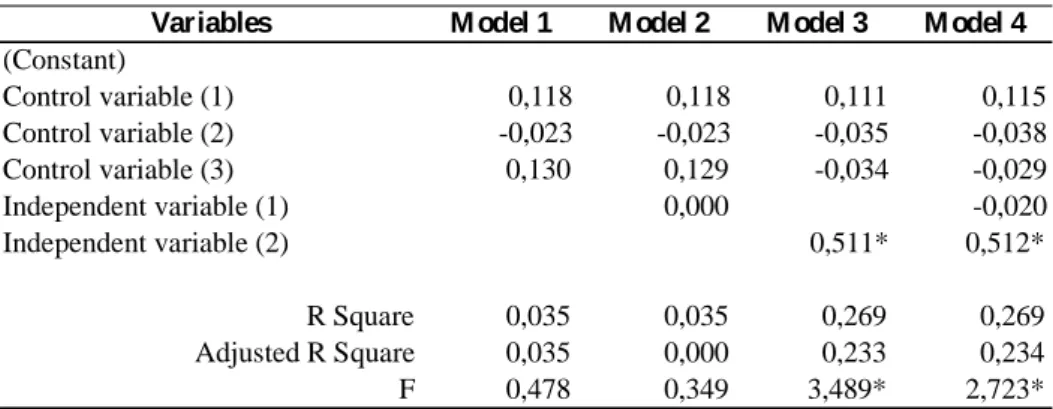
Table 5 presents the results of the multiple linear regression tests, in this case we used a database comprised of three control variables, two independent or explanatory variables (x) and a dependent variable (y). The option was for the preparation of 4 linear regression models, once this permits to observe in an isolated manner the behavior of the variable y in relation to the explanatory variables. It is observed that the variables: control 1, control 2 and control 3 are presented in all of the 4 models.
Table 5. Linear Regression
Variables M odel 1 M odel 2 M odel 3 M odel 4
(Constant) Control variable (1) 0,118 0,118 0,111 0,115 Control variable (2) -0,023 -0,023 -0,035 -0,038 Control variable (3) 0,130 0,129 -0,034 -0,029 Independent variable (1) 0,000 -0,020 Independent variable (2) 0,511* 0,512* R Square 0,035 0,035 0,269 0,269 Adjusted R Square 0,035 0,000 0,233 0,234 F 0,478 0,349 3,489* 2,723* *Significante ao nível de 0,05
Source: Ribeiro and Serra (2015).
Models 2 and 3 add, separately, the independent variables, “1 and 2” respectively, whereby model 4 contemplates all the explanatory variables. From models 3 and 4 it is possible to verify the existence of a positive relationship between the independent variable 2 and the dependent variable A positive coefficient and statistically significant (β=0.511, p<0;05) in model 3 and (β=0.512, p<0;05) in model 4, permit to state that this variable influence in a positive manner the dependent variable.
It is common in regression models that values p are not presented for each β value, but a (*) for values that are presented as significant. Thus, below a table with regression models it is important to highlight the levels of significance used for the analysis. Generally in social sciences the level of significance adopted is of 0.05. On the other hand, the adjusted values of R2 are used to verify the explanatory power of each model, and through the p value of the F test it is possible to verify whether R2 is significant or not.
37 It is important to emphasize that this article does not present conclusions as such as other academic articles do. This fact is due to the fact that this is a didactical attempt for presenting methodological procedures in a quantitative approach, with a focus on scripting and explanation of the phases to be followed and analyzed for using exploratory factorial analysis, correlation and linear regression. In this manner, the aim was to present a tutorial for students, researchers, reviewers and other groups of interest to have a basis for understating the main techniques used for quantitative analysis, as well as the assumptions to be fulfilled for its application.
In this respect, we explored the Exploratory Factorial Analysis, Correlation and Linear Regression. It is observed that this study was limited to the technical description and specific methods, which do not represent the universe of options related to quantitative analysis. The choice of these three techniques is justified once they are considered the most common in the studies of applied social sciences. We considered that this study will be capable of generating a contribution to illuminate the attempt to apply the quantitative techniques, draw on the researcher to sympathize for its use and has the intention of offering an understanding and use for those who progress, or need to progress, with the quantitative research.
The results of the analyses demonstrate the possibility and effectiveness of the application of the statistical techniques for each expected objective. Thus, the study supplies a simplified vision (in a tutorial manner) which eases the interpretation of studies that use these forms of analysis. In other words, structure and routing its use in quantitative studies in the most diverse areas of knowledge, once it presents the objectives and basic assumptions for use of each of the three techniques.
Finally, there is a contribution in relation to the distinct aspects of researches already related in the area and in the national scenario, as is the case of Ringle, Silva and Bido (2014) that present the methodological procedures of the modeling of the structural equations with the measurement model of partial least squares (PLS); Desjeux, Suarez and Campos (2014) who present the itinerary methods for the research of management consumption; Malhotra, Lopes and Veiga (2014) present the main characteristics of LISREL, its features and, by means of a didactical example; Hair, Gabriel and Patel (2014) concentrate on CB-SEM with AMOS to illustrate its application in the analysis of relationships between guidance for the client, guidance for the employees and performance of the company; and Hernandez, Basso and Brandão (2014) discuss the main elements for the performance of an experimental study, as well as stimulating the researchers to adopt it as a method of research.
REFERENCES
ANDRADE, G. M. Manual para elaboração de monografias e dissertações. São Paulo, Atlas, 2002.
BARTHOLOMEW, D. J. The foundations of factor analysis. Biometrika, v. 71, n. 2, p. 221-232, 1984. https://doi.org/10.1093/biomet/71.2.221
BLALOCK, H. M. Measurement in the social sciences: Theories and strategies. Chicago, Illinois: Aldine Publishing Company, 1974.
BROWN, T. A. Confirmatory factor analysis for applied research. New York: The Guilford Press, 2006.
38 BRYMAN, A. Integrating quantitative and qualitative research: how is it done? Qualitative
Research, v. 6, n. 1, p. 97-113, 2006. http://doi.org/10.1177/1468794106058877
CARVALHO, A. O.; RIBEIRO, I.; CUNHA, S. A. Viabilidade de startups: uma proposta de construção de uma escala de fatores dificultadores. Ágora Revista de Divulgação Científica, v. 20, n. 1, p. 131-153, 2015.
COHEN, J. Statistical power analysis for the behavioral sciences. Academic press. New York University: New York, 1997. http://dx.doi.org/10.1016/B978-0-12-179060-8.50001-3
COLLIER, D.; BRADY, H. E.; SEAWRIGHT, J. Sources of Leverage in Causal Inference: Toward an Alternative View of Methodology. In H. E. Brady; D. Collier (Eds.), Rethinking
Social Inquiry: Diverse Tools, Shared Standards. (pp. 229-266). Lanham: Rowman and
Littlefield, 2004.
CORRAR, L. J.; PAULO, E.; DIAS FILHO, J. M. Análise multivariada para os cursos de
administração, ciências contábeis e economia. São Paulo: Atlas, 2009.
DANCEY, C. P.; REIDY, J. Estatística sem matemática: para psicologia usando SPSS para Windows. Porto Alegre: Artmed, 2006.
DESJEUX, D.; SUAREZ, M.; CAMPOS, R. D. O método dos itinerários: uma contribuição metodológica das ciências sociais à pesquisa de consumo em gestão. Revista Brasileira de
Marketing, v. 13, n. 2, p. 72-81, 2014.
DEVELLIS, R. F. Scale Development: theory and applications. California: Sage Publications, 1991.
FÁVERO, L. P.; BELFIORE, P.; SILVA, P.; CHAN, B. Análise de Dados: Modelagem Multivariada para Tomada de Decisões. Rio de Janeiro: Campos Elsevier, 2009.
FIGUEIREDO-FILHO, D. B.; SILVA-JUNIOR, J. A. Desvendando os Mistérios do Coeficiente de Correlação de Pearson (r). Revista Política Hoje, v. 18, n. 1, p. 115-146, 2010b.
FIGUEIREDO-FILHO, D. B.; SILVA-JUNIOR, J. A. Visão além do alcance: uma introdução à análise fatorial. Opinião Pública, v. 16, n. 1, p. 160-185, 2010a.
GALIANO, G. A. O método científico: teoria e prática. São Paulo: Habra, 1995.
HAIR, J. F.; BLACK, W. C.; BABIN, B. J.; ANDERSON, R. E.; TATHAM, R. L. Análise
Multivariada de Dados. Porto Alegre: Bookman, 2009.
HAIR, J. F.; GABRIEL, M. L. D. S.; PATEL, V. K. Modelagem de equações estruturais baseada em covariância (CB-SEM) com o AMOS: orientações sobre a sua aplicação como uma ferramenta de pesquisa de marketing. Revista Brasileira de Marketing, v. 13, n. 2, p. 43-53, 2014.
HERNANDEZ, J. M. C.; BASSO, K.; BRANDÃO, M. M. Pesquisa experimental em marketing. Revista Brasileira de Marketing, v. 13, n. 2, p. 96-115, 2014.
JUPP, V. The Sage dictionary of social research methods. London: Sage Publications, 2006.
39 LEITE, F. T. Metodologia científica: métodos e técnicas de pesquisa: monografias,
dissertações, teses e livros. Aparecida: Ideias e Letras, 2008.
LEVINE, D. M.; STEPHAN, D.; KREHBIEL, T. C.; BERENSON, M. L. Estatística -
Teoria e aplicações usando-se o Microsoft EXCEL em português. Rio de Janeiro: LTC,
2005.
MALHOTRA, N. K. Pesquisa de marketing: uma orientação aplicada. Porto Alegre: Bookman, 2001.
MALHOTRA, N. K.; LOPES, E. L.; VEIGA, R. T. Modelagem de equações estruturais com LISREL: uma visão inicial. Revista Brasileira de Marketing, v. 13, n. 2, p. 27-42, 2014. MARÔCO, J. Análise Estatística com a Utilização do SPSS. Lisboa: Pero Pinheiro, 2011. MINGOTI, S. A. Análise de Dados através de Métodos de Estatística Multivariada: uma abordagem aplicada. Belo Horizonte: UFMG, 2005.
MOORE, D. S.; MCCABE, G. P. Introduction to the practice of statistics. New York: W.H. Freeman, 1989.
NEVES, J. L. Pesquisa qualitativa: características, usos e possibilidades. Caderno de
Pesquisas em Administração, v. 1, n. 3, p. 1-15, 1996.
PEREIRA, J. C. R. Análise de dados quantitativos: estratégias metodológicas para as
ciências da saúde, humanas e sociais. São Paulo: Edusp, 2004.
POWELL, J. L. Least absolute deviations estimation for the censored regression model.
Journal of Econometrics, v. 25, n. 3, p. 303-325, 1984.
REIS, E. Estatística Multivariada Aplicada. Lisboa: Edições Sílabo, 1997.
RIBEIRO, I.; SERRA, F. A. R. Influências da experiência internacional e da diversificação de negócios no grau de internacionalização das multinacionais brasileiras. XVIII Seminários em
Administração – XVIII Semead, São Paulo, SP, Brasil, 2015.
RINGLE, C. M.; SILVA, D.; BIDO, D. Modelagem de equações estruturais com utilização do SMARTPLS. Revista Brasileira de Marketing, v. 13, n. 2, p. 54-71, 2014.
ROCHA-FALCÃO, J. T.; RÉGINIER, J. Sobre os métodos quantitativos na pesquisa em ciências humanas: riscos e benefícios para o pesquisador. Revista Brasileira de Estudos
Pedagógicos, v. 81, n. 198, p. 229-243, 2000.
SILVEIRA, A. Roteiro básico para apresentação e editoração de teses, dissertações e
monografias. Blumenau: Edifurb, 2009.
TABACHNICK, B. G.; FIDELL, L. S. Using multivariate statistics. Northridge: Pearson, 2001.