STraTEGIC PLaNNING BaSED ON DEMOGraPhIC PrOJECTIONS OF SChOOL DEMaND:
WhaT ChaLLENGES DO ThE DIFFErENT aCTOrS haVE TO FaCE?
Teresa Pimentel35
abstract
As partners, municipal and school authorities are faced with the challenge of strategically planning the educa-tion of their young citizens. When we refer to strategic planning, we envision it divided into three stages: anal-ysis or diagnosis of the system; policy formulation; and action plan. The first stage deals with the diagnosis of the existing reality by quantifying the population that is going to be educated. This quantification has been developed based on a cross-sectional analysis. We chose to present a methodology based on a longitudinal analysis, namely the reconstruction of the educational trajectories of individuals of the same cohort, thus ap-plying the principles of demographic analysis to school events (Bandeira, 2007). This methodology allows us not only to analyse current educational trends but also to project the impact of maintaining enrolment and ed-ucation rates in the 2025 timeframe, based on projection scenarios of the population within the normal age for attending school. Therefore, we took the municipality of Castelo Branco as the unit of analysis and applied the principles of demographic analysis to school events. As a result, and despite the limitations identified through-out the study, we think the longitudinal analysis of the school trajectories of students coupled with population projections allows us to have a better understanding of the possible and/or probable futures regarding school demand in Castelo Branco.
keywords: strategic planning; school demand; demographic projection; school trajectory
1. Introduction
In Portugal, education policies have been taking a leading role, especially since the turn of the 1980s, when we witnessed a reformulation in the regulation mode of the national education system. Since the Law on the Education System (1986), the topic of “decentralization” began to guide the Portuguese educational policy. We understand decentralization as a process associated with the concept of subsidiarity, i.e., the transfer of functions and tasks to the lowest level of the social order able to complete them, assuming a redistribution of authority, power, resources, and responsibilities. This redistribution can be made between functions or be-tween “territories”. Either there is a distribution of powers bebe-tween various authorities working in parallel, or there is a transfer of powers from higher to lower levels of government. In the latter, the authority can be allo-cated to the central, regional or municipal government, district or local council, and/or schools boards (McGinn & Welshthem, 1999 as cited in Batista 2012).
Increasingly, municipal authorities are faced with new responsibilities delegated by the central government (Municipal Councils of Education, Educational Charter - Laws No. 115-A/98 and No. 7/2003, later amended by Laws No. 41/2003 and No. 6/2012). Furthermore, the relationship with schools and vertical clusters of schools has been strengthened.
As partners, municipal and school authorities are faced with the challenge of strategically planning the edu-cation of their young citizens. When we refer to strategic planning, we envision it divided into three stages: analysis or diagnosis of the system; policy formulation; and action plan (Chang, 2008).
The first stage deals with the diagnosis of the existing reality by quantifying the population that is going to be educated. This quantification has been developed (particularly in municipal charters and educational projects targeted at schools/vertical clusters of schools) based on a cross-sectional analysis, i.e., the evolution of total students enrolled in a particular school year and the enrolment rates calculated by the normal age for attend-ing school.
We chose to present a methodology based on a longitudinal analysis, namely the reconstruction of the edu-cational trajectories of individuals of the same cohort, thus applying the principles of demographic analysis to school events (Bandeira, 2007). This methodology allows us not only to analyse current educational trajec-tories in the present but also to project the impact of maintaining enrolment and education rates in the 2025 timeframe, based on projection scenarios of the population within the normal age for attending school. In this analysis, we can see past trends (perspective) and simultaneously projecting them into the future (pro-spective). Our goal is to provide an overview of possible futures through a simulation exercise that will allow us to highlight what can happen under many previously established and justified assumptions. This exercise does not aim to be a forecast or a futurology practice but a reflection that can lead to action and fight against fatalism (Nazareth, 2009).
At the policy formulation stage, the previous approach will allow the different actors (mainly municipal and school authorities but also the community in which the school is located and families) to discuss the chal-lenges that municipalities and vertical clusters of schools/schools will be facing in the next decade, as well as potential solutions via the formulation of policies(We can’t forget that these policies should be analysed taking into account the constraints of national education policies and European guidelines in the area of education). Although we do not intend to elaborate on the third phase, we must clarify that the action plan refers to the physical product of the strategic planning process. Besides the initial diagnosis, it includes goals and priorities for action, as well as the strategies and policies to be implemented in order to achieve these goals. In other words: it is the document that gets the action going.
2. Methodology
According to Bandeira (2007), the school population ¾ like any other population ¾ lives and reproduces itself through its own dynamics. The dynamic of school activity includes the permanent and cyclical succession of inflows and outflows of students in the educational system. But while a larger population (e.g. the Portuguese population) ensures its renewal by generational replacement, the school population depends on exogenous factors in order to reproduce itself. These can be: demographic structures (that are in turn conditioned by births, mortality, and migrations); public policies that affect access to education; individual propensity to pur-sue further studies; and the availability of families to match this propensity (Bandeira, 2007, p. 517).
Therefore, we took the municipality of Castelo Branco as the unit of analysis and applied the principles of de-mographic analysis to school events. We transposed the principles of construction of mortality tables to the population of students enrolled, and enrolled for the first time, by age, academic year, and school year. This process was aimed at the construction of a school enrolment panel and a panel of schooling. These panels are built upon, respectively, the calculation of enrolment ratios (which relate the students enrolled with the popula-tion of a specific age attending school) and schooling rates (which indicate promopopula-tions, grade repetipopula-tion, and dropouts in each academic year). Disaggregating data by age allows us to reconstruct the school trajectories of students in a particular cohort.
In a prospective exercise, we have assumed that the identified school trajectories would remain constant over the next 10 years (until 2025). We have also traced the expected school demand over that period based on the evolution of the number of students that are of the right age to attend a certain level of education. The calcula-tion of this number of students is based on previously completed populacalcula-tion projeccalcula-tions by age.
3. results
As we said before, this methodology allows us to project the impact of maintaining enrolment and education rates in the 2025 timeframe, based on projection scenarios of the population within the normal age for at-tending school. In the graph below, the expected school demand at Castelo Branco until 2025 in the moderate scenario of projection shows a clear downward trend. In this scenario, in 2015 children between the ages of six and nine years old would slightly exceed 1 750 and in 2040 the expected school demand would be below 1000. This means that in the next 25 years, Castelo Branco can lose more than 750 children only in this age group.
Figure 1 - Projection of expected school demand in Castelo Branco until 2025 (moderate projection scenario) based on the number of students that are of the right age to attend each cycle of education.
2,000 1,750 1,500 1,250 1,000 750 500 250 0 2015 2020 2025 2030 2035 2040 15 - 17 years
3 - 5 years 6 - 9 years 10 - 11 years 12 - 14 years
If we look at this projection based on the number of students that are of the right age to attend each academic year, we can see the impact over the next ten years.
Table 1 - Projection of expected school demand in Castelo Branco until 2025 (moderate projection scenario) based on the number of students that are of the right age to attend each academic year
School year academic year 2015/2016 2016/2017 … 2020/2021 … 2025/2026 MF M F MF M F MF M F MF M F kindergarten 1287 666 678 1287 656 658 1131 594 591 945 527 526 1st year 429 222 226 428 221 226 404 209 208 336 183 183 2nd year 447 234 223 429 222 226 426 214 213 348 188 187 3rd year 451 237 224 446 222 226 426 220 218 360 193 192 4th year 457 240 226 450 222 226 426 221 226 374 198 197 5th year 464 244 228 456 234 222 425 221 226 387 203 202 6th year 473 249 232 463 236 223 425 221 225 400 208 207 7th year 483 255 236 472 239 225 442 221 225 421 214 212 8th year 491 259 240 481 243 227 446 221 225 421 219 217 9th year 496 262 244 489 249 231 450 233 221 420 220 224 10th year 496 261 248 494 254 235 457 235 222 419 220 224 11th year 492 258 252 494 258 239 466 238 224 418 220 224 12th year 487 255 256 490 261 243 474 242 226 434 219 224
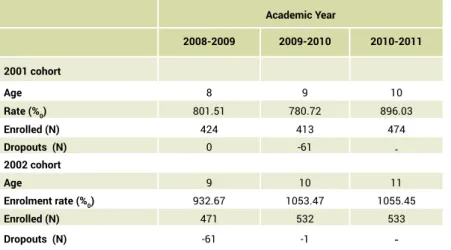
As mentioned before, we have transposed the principles of construction of mortality tables to the population of students enrolled, and enrolled for the first time, by age, academic year, and school year. This process was aimed at the construction of a school enrolment panel and a panel of schooling. Table 2 corresponds to the school enrolment panel of the students from the 2001 and 2002 Cohorts.
For example, the children of the 2002 cohort were 9 years old in the 2008-2009 academic year, with an enrol-ment rate of 933 students for each 1000 children that had that age in the municipality of Castelo Branco. There were 471 children enrolled in school and 61 dropouts (this can include children that go to other schools out-side the municipality because at this stage we have no information that would allow us to identify and exclude those cases).
Table 2 - School enrolment panel of the students from the 2001 and 2002 Cohorts (10 and 11 years old in 2011). academic year 2008-2009 2009-2010 2010-2011 2001 cohort age 8 9 10 rate (%0) 801.51 780.72 896.03 Enrolled (N) 424 413 474 Dropouts (N) 0 -61 -2002 cohort age 9 10 11 Enrolment rate (%0) 932.67 1053.47 1055.45 Enrolled (N) 471 532 533 Dropouts (N) -61 -1
-In the following table, we applied the school enrolment panel of the students from the 2001 and 2002 Cohorts to the 2025 population with 10 and 11 years old, assuming that the identified school trends would remain con-stant until then. As we can see, in the 2023-2024 academic year, 9 year-old children enrolled in school would be 375 and 48 children would not be enrolled.
Table 3 - Application of the School enrolment panel of the students from the 2001 and 2002 Cohorts to the 2025 popula-tion with 10 and 11 years old, assuming that the identified school trajectories would remain constant until then.
academic year 2023-2024 2024-2025 2025-2026 2015 cohort age 8 9 10 rate (%0) 801,51 780,72 896,03 Enrolled (N) 312 303 347 Dropouts (N) 9 -44 -2016 cohort age 9 10 11 Enrolment rate (%0) 932,67 1053,47 1055,45 Enrolled (N) 375 422 422 Dropouts (N) -48 0 -4. Conclusions
Despite the limitations identified throughout the study, the longitudinal analysis of the school trajectories of students coupled with population projections allows us to have a better understanding of the possible and/or probable futures regarding school demand in Castelo Branco. This approach, in our view, is a very important part of the system analysis and provides a valid contribution to the debate on the merits and the challenges that education in this district is facing today and will face in the near future, taking into consideration the dif-ferent educational actors. Remembering the words of Chang (2008), planners and managers can look at this contribution (as part of the overall system analysis) from the perspective of the system’s strengths, weakness-es, lessons, and opportunities regarding educational development and use it to help to identify critical issues and challenges, and design remedial actions and policy provisions.
From the policy formulation perspective, in Castelo Branco the population decline in pre-school and school age children over the next 10 years can be seen as an opportunity to promote educational excellence but represents a challenge to the management of physical and human resources and the planning of educational offers. Assuming a scenario of maintenance of school trajectories over the next 10 years, we find that the focus will be increasingly on improving the quality of education for a progressively reduced group of individuals who represent the future of the municipality.
Also, the strategic planning of education in Castelo Branco cannot be oblivious to the net migration, which has been negative in the past few years, a trend maintained in the moderate scenario of the projection used in this exercise. In fact, the educational actors are responsible for suggesting policies to promote the permanence of the younger generations in the municipality, which can include, for example, a better integration of Gypsy
students36 and simultaneously promote their academic success, as this population has a higher school
drop-out. Let us remind that these policies should be part of the goals and purposes defined along the following threefold dimension (Chang, 2008): access (access, participation, including gender, and equity issues); quality (quality, internal efficiency, relevance, and external effectiveness), and management (governance, decentraliza-tion, resource management).
We would like to end this reflection by saying that education planning has become more complex because it involves various actors, it is influenced by the system analyses, it involves more complex and multidimensional problems and it requires the involvement of many diversified and specialized skills and competences of the education managers.
36 National Strategic plan to integrate Gypsy Communities - Law No. 51/2013; and “Tackling Gypsy Needs in the 2014-2020 Structural Funds Programming Period” in the European Anti-Poverty Network EAPN http://www.eapn.pt/documentos.php?ID=7#sthash.NBvbGbF7.dpuf
references
Bandeira, M. L. (2007). Demografia escolar e análise longitudinal: Escolarização e escolaridade de coortes de alunos dos ensinos básico e secundário. Análise Social, XLII(183), 515-538.
Batista, S. (2012). A relação escola-comunidade: políticas e práticas. Lisbon: Projecto ESCXEL.
Chang, G.-C. (2008). Strategic planning in education: Some concepts and methods. [Presentation] Direc-tions in Educational Planning: Symposium to Honour the Work of Françoise Caillods. Paris: Internation Insti-tute for Education Planning - UNESCO.
Nazareth, J. M. (2009). Demografia - A ciência da população (3rd ed.). Lisbon: Editorial Presença.
Legal Documens
Law on Education System (1986). Law no.115-A/98.
Law no. 7/2003. Law no. 41/2003. Law no. 6/2012. Law no. 51/2013.