1
N O V A
S C H O O L O F B U S I N E S S A N D E C O N O M I C S
T H E S I S
The Impact of Corporate Governance on Firm Performance:
A Case of CAC 40 Firms
By Ahmed Bouzouita
Student Number: 29364 (Nova SBE)
Professor António Nogueira Leite
2
Table of Contents
Abstract ... 5
1. Introduction ... 6
2. Research Aim and Objectives... 7
2.1.
Introduction to the governance ecosystem in France ... 7
3. Research Question ... 7
4. Literature Review... 8
5. Methodology ... 11
5.1.
Research Approach and Purpose ... 11
5.2.
Research Design ... 11
5.3.
Data Sources ... 12
5.4.
Sample Size ... 12
5.5.
Research Hypothesis ... 13
5.6.
Variables ... 13
5.7.
The Corporate governance assessment Model (CGAM): ... 13
5.8.
Data Analysis and modelling ... 14
5.9.
Ethical Considerations ... 15
6. Results and Discussion ... 15
6.1.
Descriptive Statistics ... 15
6.2.
Unitary vs Dual Systems performance ... 16
6.3.
Regression Analyses ... 18
7. Conclusion and limitations ... 21
8. References ... 22
3
Table of figures
Figure 1. Two Sample z-Test ROA
... 17
Figure 2. Two Sample z-test ROCE
... 17
Figure 3. Two Sample z-test ROIC
... 18
Figure 4. ROA regression summary results
... 19
Figure 5. ROCE regression summary results
... 20
4
Acknowledgements
I would like to take this opportunity to acknowledge my deep and sincere thanks to
Professor Doctor António Nogueira Leite for being a great supervisor for my thesis. This
adventurous journey would have been non-achievable without his guidance and persistent
help through the year.
I am extremely grateful to Nova School of Business & Economics for giving me the
chance to attend this multicultural and unique environment in Europe. The high quality of the
classes, as well as the top-notch professors, will have a huge impact on my future career.
I would like to show thanks and gratitude to my family members for being supportive
through this year.
5
Abstract
There are several elements in business management that help increase financial
efficiency, market positioning and overall firm performance which leads to generate
confidence among investors, customers, suppliers and other stakeholders. One of these
elements is corporate governance which covers the relationships between directors, the board,
its shareholders and all those interested in the firm’s performance and therefore provides the
necessary structure to define and execute the strategic objectives of the company as well as
the control exercised over said execution.
This study presents an assessment model based on supervisory board, investor
relations, management team, and disclosure of information and analyses the relationship
between different board systems, corporate governance and its characteristics with firm’s
performance through the financial results of CAC 40 Firms.
Key words: corporate governance, Performance, the board of directors, CAC40, demographic
variables, cognitive diversity, France.
6
1. Introduction
Since the 1980s, the issues related to corporate governance (CG), such as corporate
failure and collapse, corporate fraud, excess of executive remuneration, abuse of management
power, and corporate social irresponsibility, have attracted much media attention (Sun,
Stewart and Pollard, 2011). Many scholars, CG practitioners, and policy analysts have
associated the increasingly circular nature and severity of global financial crisis to CG
failures (Pollard, Steward and Sun, 2014; Erkens, Hung and Matos, 2012; Berger,
Imbierowicz and Rauch, 2016). Moreover, the influence CG practices on firm performance
has been a topic of discussion, especially in the fields of finance, accounting, and
management (Akbar et al., 2016). The relationship between the two constructs is
well-researched and has been widely debated in the context of both developed and developing
countries (Christensen et al., 2015; Arora and Sharma, 2016; Yasser, Entebang and Mansor,
2015). The concern towards improving and reforming governance structure has emerged due
to previous corporate collapses (Arora and Sharma, 2016). The failure to detect and prevent
corporate scams, in the recent decades, has fuelled debates on the effectiveness and
implementation of CG principles, rules, mechanisms, and structures (Sun et al, 2011).
It is observed that effective corporate governance (CG) practices direct organisations
towards increasing corporate accountability and prosperity. From the economic perspective,
it enables efficiency and results in higher return and profitability (Bai et al., 2004; Zabri,
Ahmad and Wah, 2016). Effective CG practices help overcoming the agency problems and
affect firm value via higher stock price multiples (Ammann, Oesch and Schmid, 2011), since
investor perceive less cash flow diversion and anticipate higher dividends or interest from
profits. Moreover, good CG declines costs of capital due to the reduction in shareholders’
auditing and monitoring cost (Shleifer and Vishny, 1997). However, at the same time, there
are costs associated with stronger governance mechanisms’ implementation, which may
outweigh the benefits (Bruno and Claessens, 2010). Still, majority of the previous literature
has reported positive association between CF and firm valuation or performance (Bebchuk,
Cohen and Ferrell, 2008; Bhagat and Bolton, 2008; Yasser et al., 2015), suggesting that
stronger CG is related with higher firm value.
7
2. Research Aim and Objectives
This research aims to determine the impact of corporate governance (CG) on firm
performance. It focuses on the case of CAC 40 index, which represents 40 most actively
traded and largest shares listed on Euronext Paris. It is considered as the most widely used
Paris stock market’s indicator (Euronext, 2018). Following are the objectives of the study:
1. To explore the relationship between CG and firm performance in the light of pervious
literature.
2. To propose a CG Assessment Model based on supervisory board, investor relations,
management team, and disclosure of information.
3. To analyse the impact of CG characteristics and Board Systems on the financial
performance of CAC 40 firms.
2.1. Introduction to the governance ecosystem in France
The code of corporate governance that all French listed companies refer to, is the
AFEP - MEDEF code of corporate governance that was introduced in 2010 and revised in
2016. AFEP, “Association Française des Entreprises Privées”, Represents more than 110 of
the largest private groups operating in France. MEDEF, « Mouvement des Entreprises de
France », is an employers' organization that represents French companies.
Each Organization reports in its annual review the achievements towards the
progressive implementations of the code practices and recommendations.
3. Research Question
The main research question of the study is:
Does Corporate Governance practices positively influence performance of CAC 40 firms?
The sub-questions are:
1. Does unitary board system positively infleunce of CAC 40 firms performance?
2. Does Dual board system positively infleunce of CAC 40 firms performance?
8
4. Literature Review
Numerous authors have studied the interrelation between corporate governance (CG)
and firm’s performance (Wang, Sami and Zhou, 2011; Siddiqui, 2015; Black et al, 2015). Some
authors studied this relationship by using an individual measure of CG while others focused on
using a composite measure (Arora and Sharma, 2016). The current research study is focused
on analysing the impact of individual CG measures on firm’s performance.
CG has now become an attractive subject of study for researchers, specifically after
2008 financial crisis (Erkens, Hung and Matos, 2012). Recent two decades reflects significant
changes in CG structures (Gomez, 2005). Monks (1996) has discussed that numerous corporate
failures result from ineffective CG structure. CG is a set of rules and regulations that guide
firm’s behaviour where ownership and management are separated (Claessens and Yurtoglu,
2013). CG is sometimes referred to regulatory activity, that can be implemented through
internal and external factors to protect the interest of stakeholders and to resolve conflicts
(Dalwai, Basiruddin and Abdul Rasid, 2015). Mohamed and Elewa (2016) describe that strong
CG network help organisations in increasing their contribution towards the well-being of the
economy that includes all stakeholders. Previous literature on CG has identified that there are
several individual measures that help shareholders to identify that managers are acting in the
best interest of the shareholders or not (Reddy, Locke and Scrimgeour, 2010). Denis (2001)
suggests that these individual measures are classified as internal and external. Internal factors
include board size, management ownership and independence of board while external factors
include market competition, block ownership and level of debt financing.
A number of researchers have evaluated the relationship between CG and firm’s
performance by using different measures. Siddiqui (2015) have studied the link between the
two constructs and classified CG mechanism into the internal and external mechanisms.
Previous research has measured internal governance mechanism by the board of directors and
block holders (Brown, Beekes and Verhoeven, 2011) while the external mechanism is
measured by the market for corporate control and takeover (Cremers and Nair, 2005). Yasser
et al. (2015) have established a relationship between four CG mechanisms and firm’s
performance. These four CG mechanisms include CEO and chairman duality, board
composition, size of the board and the audit committee. Results of the study reflected the
positive impact of board size and audit committee on firm’s performance and the weak impact
of CEO and chairman duality. Similarly, Bhagat and Bolton (2013), while studying the
association between CG and firm’s performance, considered five different measures of CG.
9
This study was based on the period 1998-2007. The five variables for measuring CG were CEO
and Chairman Duality, board independence, G-Index, E-Index and director ownership. The
authors observed a negative relationship between board independence and firm’s performance
till 2002 but after that, there was a shift in the relationship between both constructs. Moreover,
it is observed that board independence and director’s ownership positively correlate with firm’s
performance. It suggests that the two CG-based characteristics are favourable for improving
firm performance.
Previous research has also assessed how CG impacts firm’s performance (Arora and
Sharma, 2016). The study was conducted on manufacturing sector for the period of 2001-2010.
It suggested that having a larger board size provides great depth of intellectual knowledge,
which results in improved decision making and enhanced firm’s performance. But results
concluded that there is no relationship between CG indicators and firm’s performance. Erkens,
Hung and Matos (2012) investigated the impact of GC on firm’s performance during the
financial crisis of 2008. It was observed that firms with higher institutional ownership and more
independent board faced negative stock returns. The results can be explained by the fact that
firms with higher institutional ownership had taken greater risk and as a result faced losses
during the financial crisis.
The association between CG and firm’s performance is also studied and explained with
the help of agency theory (Sami, Wang and Zhou, 2011). Previous literature on agency theory
suggests that strong corporate governance framework reduces firms cost and enhances firm’s
profitability. Brown and Caylor (2009) suggested that US firms that are better governed have
higher accounting profits and performance. This study used a composite measure of corporate
governance to study the impact of CG on firm’s performance. This composite measure of CG
can be developed by using individual CG attributes like board size, ownership independence
etc. (Joh, 2003; Patibandla, 2006). Authors used ten individual CG factors to develop a
composite to predict firm’s performance. These ten individual CG factors include different role
of Chairman and CEO, the number of independent outside directors, the relationship among
top 10 shareholders, the percentage of stock owned by the state, the percentage of stock owned
by a foreign investor, the percentage of stock owned by an institutional investor, the percentage
of stock owned by directors and officers, the amount of stock owned by largest stockholder,
the directors with more than one year of service and owning stock, and a board approving CEO
succession plan. The result of this study suggests that there is a positive association between
quality of CG and firms’ performance.
10
Based on the data of listed companies in CAC 40, a recent study analysed the
association between CG and firm’s performance, considering board of directors’ composition,
CEO and Chairman Duality, board’s size and gender diversity as a variable to measure CG;
while firm’s performance was measured by return on asset and return on equity (Ahmadi and
Bouri, 2017). After analysing data, it is concluded that there is a positive relationship between
CG and firm’s performance (Ahmadi and Bouri, 2017). Another study investigated the
relationship between CG and firm’s performance. This relationship was studied on French 120
companies listed in the SBF120 index. This study focused on the influence of institutional
investors on CG and how it impacts firm’s performance. Results suggested that CG improves
with the increase of share ownership of institutional investors, but there is no association
between CG and performance of the firm (Mizuno, 2014). Moreover, another research was
conducted to investigate the impact of independent and non-independent director on firm’s
performance using the data of 157 non-financial companies (Kumar and Singh, 2012). After
analysing data, the authors concluded that proportion of independent directors has an
insignificant positive effect on firm’s performance. Ammann Oesch and Schmid (2011) studied
the relationship between CG and firm’s performance by using a set of 64 individual CG
attributes. Two indices of equal weights were developed from these 64 individual CG
attributes. Results showed a positive relationship between CG and firm’s performance.
Similarly, Bistrova and Lace (2011) examined the relationship between GC and firm’s
performance by developing a CG assessment model. This CG assessment model was based 21
evaluation criteria to measure GC. These 21 criteria were classified into four broad categories
that include Supervisory Board, Investor Relations, Management Team and Disclosure of
Information. Supervisory board measured different variables such as frequency of meetings,
committee structure, CEO and Chairman Duality, performance-based compensation, directors’
independence etc. Investor relations were focused on evaluating the dividend policy and how
well information regarding Annual General Meetings was shared. Management team measured
variables like CEO background, reporting structure and stability. Disclosure of Information
examined the degree of information disclosure with investors. After analysis, results concluded
that companies with strong CG outperformed companies with weak CG. It shows that majority
of the previous research on the subject has evaluated positive significant relationship between
CG and firm performance.
The financial market in France is aware of the fact that CG plays a crucial role in the
progress of any company. This has made French companies to adopt best CG practices. For
11
this reason, Institut français des administrateurs has developed a set of guidelines that can help
firms to build a strong CG framework. Institut français des administrateurs (2015) suggested
some factors that must be considered by every firm while developing CG framework. Authors
have classified these factors into three broad terminologies named Balance, Performance and
Transparency. The first broad category is Balance and this refers to balance in Board of
Directors’ structure, their membership, status and mission. The structure can be balanced by a
variety of choices and balances the governance based on their specificities. Membership is
balanced by increasing the number of independent directors along with the growth of female
representation on board. Directors’ status is defined in terms of director’s remuneration that
can be balanced compensating strategically. The performance focuses on developing an
effective strategy that contributes towards company’s success. Development of these strategies
depends on men and women leading the board, specialised committees and directors’ collective
contribution. Transparency refers to sharing information and reports to shareholders and
stakeholders, timely and honestly. This helps shareholders and stakeholders in making better
decisions. These above-mentioned guidelines can help firms in developing a strong CG model.
5. Methodology
This section of the study is focused on describing research methods selected by
researchers to study the relationship between CG and firm’s performance. This section is
considered a crucial part of the study that describes procedures adopted by the researcher to
study the problem, analyse data and make conclusions.
5.1. Research Approach and Purpose
This section defines the approach used by the researcher to study the problem. Research
approaches can be classified as a deductive and inductive approach. In this study, we have used
deductive approach. The deductive approach focuses on developing hypothesis based on
previous literature. Purpose of the study reflects the reason behind conducting a research. The
reason could be either exploration, description or explanation. As previously, this problem has
been discussed by multiple authors, therefore the purpose of this study is explanatory i.e. the
author further explains the problem using a new dataset i.e. data of CAC 40 firms.
12
Research design describes the overall strategy. It shows the methods that are used to
study the problem. This section defines the type of data that will be used to study the problem.
Since the objective of the study to explain the impact of CG characteristics on firm performance
and the nature of study is quantitative; therefore, a correlation design is most suitable in this
case. A correlation design examines statistical relationship between two or more variables. This
analysis is supported with a regression analysis.
5.3. Data Sources
Data sources are classified as primary and secondary data sources. This study is focused
on collecting data from secondary sources. Data that is previously collected by some other
researcher or any data that is available on the internet and any other sources are called
secondary data. Data required for this research analysis is gathered from companies’ annual
reports.
5.4. Sample Size
It is necessary for the researcher to determine the sample size before collecting data.
The sample size is important because it is difficult for researchers to study the overall
population. The sample size of this study is 30 companies listed on the CAC 40, which is a
French stock market index. Data related to corporate governance variables and firm
performance is collected for the financial period of 2016 and 2017.
10 companies were rejected from the research due to different reasons. Companies such
as Credit Agricole, BNP Paribas, and Société general belongs to the banking industry. This
sub-sector is heavy regulated after the 2008 crisis. Therefore, we cannot asses these companies
with the same standard as we do for non-banking corporations. Adding to that, the factors that
were decisive to reject more corporations from the research are:
• The origin and the nationality of the companies
• The headquarters geographical position of the companies
• the listing of the corporation.
13
Among this group, we can find corporations such as Solvay, Unibail-Rodamco,
ArcelorMittal, Technic FMC, Lafargeholcim Ltd, STMicroelectronics
5.5. Research Hypothesis
The main research hypothesis of the study is:
H
1
: Corporate Governance practices are positively related to firm’s performance
H
A1
: Unitary boards perform better compared to the companies with system of dual board.
The above hypothesis relates to supervisory board component of the corporate governance as
highlighted by
Bistrova and Lace (2011).
5.6. Variables
This study examines the relationship between CG and firm’s performance. Corporate
Governance variables are considered as ‘Independent Variables’ in this study while firm’s
performance is ‘dependent variable’. Corporate Governance is defined as a set of rules and
regulations that guide firm’s behaviour where ownership and management are separated
(Claessens and Yurtoglu, 2013). This study has identified various CG characteristics for
measuring CG. These variables relate to supervisory board, investor relations, management
team, and disclosure of information. However, for establishing relationships board system and
independent directors’ proportion are considered. All of these mentioned characteristics are
condensed into one summary variable that gives a quantitative value for the CG of each
company and that is explained through the following CGAM method.
5.7.The Corporate governance assessment Model (CGAM):
The corporate governance assessment model that we proposed to assess the CAC40
companies is originally designed by Julia BISTROVA and Natalja LACE in their paper on the
influence of governance on stock performance” (Bistrova and Lace, 2011).
The new assessment model that results from investigating past literature review,
incorporates demographic and cognitive diversity that a significant number of empirical
14
research showed a positive relationship between these mentioned variables and company
performance.
The exact method of quantitative assessment for each characteristic and each company
is attached in appendix 1. The results of such method for each company is attached in appendix
2 for 2016 and in appendix 3 for 2017. The method used a database containing the age and
gender of the actual directors of each company, this information can be found in appendix 4.
Firm’s performance is measured using ROA, ROIC, and ROCE. According to Ebaid
(2009), accounting based measures of firm’s performance can be calculated from financial
statements and these performance measures include ROA, ROIC and ROCE.
5.8. Data Analysis and modelling
Quantitative data in this study is analysed by using ‘descriptive statistics’. The
relationship between CG variables and firm’s performance is evaluated with the help of
correlation and regression analysis. To keep the validity and reliability of this research only
complete data on the variables necessary for this study will be used for the sample. Also, no
outliers were identified so there was not any data treatment or adjustment.
The correlation analysis is sustained with a simple fixed effects regression as the data
can be classified as panel or longitudinal data, and that is the same subject, a company,
observed multiple times across time, 2016 and 2017. The fixed effects regression is used
amongst the random effects regression because and the equation is the following one:
𝑌
𝑖
= 𝛽
0
+ 𝛽
1
𝑋 + 𝜀
𝑦𝑖
Where
𝑌
𝑖
is the dependent variable determined by the ROA, ROIC and ROCE having
three different models.
𝑋
is the independent variable CG,
𝛽
0
is the intercept coefficient and
𝛽
1
is the slope coefficient that gives the behavior of the relationship between the firm’s
performance and the CG.
Finally,
𝜀
𝑦𝑖
is the standard errors term.
The final database can be found at appendix 5. All the data analysis and statistical
procedures are performed in the software STATA 14.0. All the lines of code used can be found
in appendix 6.
15
5.9. Ethical Considerations
It is necessary for every researcher, that he/she must aware of ethical considerations
related to conducting research. The researcher makes sure that data that is collected is free from
any misrepresentation. The use of false data is strictly avoided during analysis. The highest
level of objectivity is maintained throughout the study.
6. Results and Discussion
6.1. Descriptive Statistics
The descriptive statistics and correlation coefficients of the dependent and independent
variables are shown in the following section.
Descriptive Statistics All Firms
Variable
Obs
Mean
Std. Dev.
Min
Max
ROA
60
4.17
2.77
-2.88
11.20
ROCE
60
11.72
7.87
-9.75
42.21
ROIC
60
7.44
4.91
-4.37
17.33
CG
60
13.75
1.22
11.00
16.00
Table 1. Descriptive Statistics All Companies
Table 1 shows the descriptive statistics for all the firms despite their board systems.
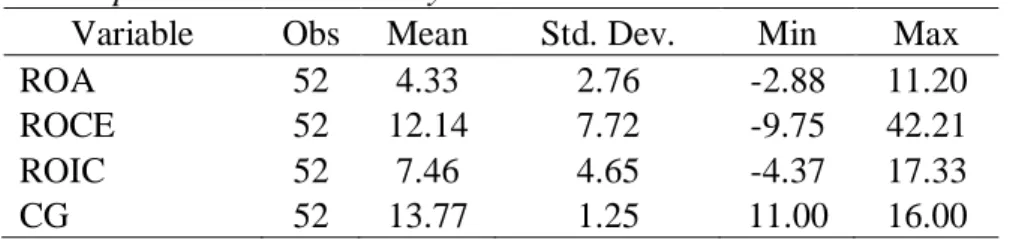
Descriptive Statistics Unitary Firms
Variable
Obs
Mean
Std. Dev.
Min
Max
ROA
52
4.33
2.76
-2.88
11.20
ROCE
52
12.14
7.72
-9.75
42.21
ROIC
52
7.46
4.65
-4.37
17.33
CG
52
13.77
1.25
11.00
16.00
Table 2. Descriptive Statistics Unitary Firms
Descriptive Statistics Dual Firms
Variable
Obs
Mean
Std. Dev.
Min
Max
ROA
8
3.13
2.76
-2.25
7.27
ROCE
8
8.97
8.81
-8.60
17.70
ROIC
8
7.29
6.74
-3.91
16.71
CG
8
13.63
1.06
12.50
15.50
Table 3. Descriptive Statistics Dual Firms
Table 2 shows the descriptive statistics for the firms with unitary board systems.
Table 3 shows the descriptive statistics for the firms with dual board systems. In general
16
terms, it can be seen how the mean of the performance indicators of the dual firms are
considerably smaller than the ones observed for the unitary firms. However, the mean CG
remains almost constant among the groups.
Correlation coefficients
ROA
ROCE
ROIC
CG
ROA
1
ROCE
0.8298*
1
0.0000
ROIC
0.8426*
0.8729*
1
0.0000
0.0000
CG
0.0035
0.0369
0.0196
1
0.9790
0.7798
0.8816
Table 4. Correlation coefficients
The correlation between the CG and the firm’s performance indicators is not significant
and it shows a weak relationship between the variables. It is important to say that, the
within-panel correlation of two variables and the between-panel correlation of two
variables do not have to be the same. In fact they can be of opposite sign. The use of
correlations in panel data or longitudinal data can be misleading. Scientific considerations
and the regression results should predominate after analyzing the correlation by itself.
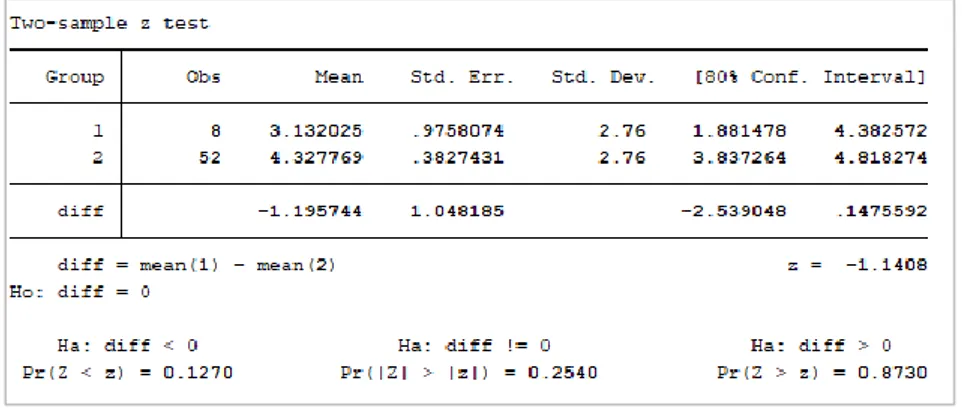
6.2. Unitary vs Dual Systems performance
This section will allow to determine which board system performs better in terms of
the financial ratios. Each ratio will be analyzed separately and conclude on the predominant
results. To determine which board system group performs better the performance indicator
means are tested using a z-test for mean comparison with known variance (Meng & Rosenthal,
1992).
The null hypothesis is the assumption of having equal means for each performance
indicator between the unitary and the dual board systems.
𝜇
𝐵𝑆
− 𝜇
𝑈𝑆
= 0
We reject the hypothesis if z < -1.96 or z > +1.96.
17
ROA
For the ROA performance indicator, the z value is -1.14 thus accepting the null
hypothesis and having equal performance between the groups.
Figure 1. Two Sample z-Test ROA
ROCE
For the ROCE performance indicator, the z value is -0.96 thus accepting the null
hypothesis and having equal performance between the groups. Same result as for the ROA.
Figure 2. Two Sample z-test ROCE
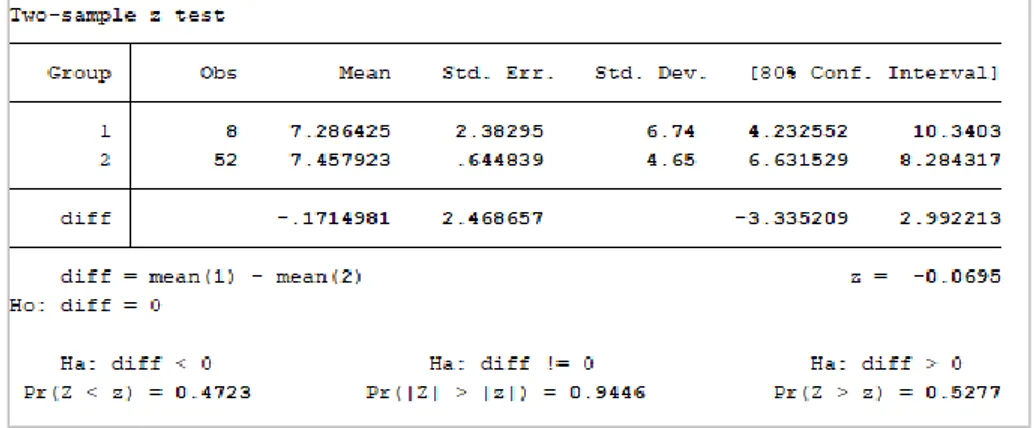
ROIC
For the ROIC performance indicator, the z value is -0.07 thus accepting the null hypothesis
and having equal performance between the groups. Same result as for the ROA and the ROCE.
18
Figure 3. Two Sample z-test ROIC
The previous results show that despite having diffence between the means, the general
performance indicators are not influenced by the type of board system. At a 80% level of
confidence we can say that there is not enough evidence to claim the mean performance
indicators of the ROA, ROCE and ROIC perform different according to the board system.
6.3. Regression Analyses
As mentioned before, the regression was performed as a fixed effects simple regression
for the four dependent variables and firm’s performance indicators. Each regression will
add an impact for the conclusion regarding the main hypothesis The following are the
results,
ROA
Figure 1 summarizes the results of the regression and it can be seen that the CG has a
positive impact on the ROA (+0.57). However, this relationship is not significant (p-value:
0.314) as suggested in the correlation analysis. It can be said that a 80% level of confidence,
there is not enough evidence to claim there is a positive relationship between the CG and the
ROA of a CAC40 firm. The model itself is not significant (F p-value: 0.3139) thus the CG can
not fully explain the behavior of the ROA of such firms. This allows to reject the main
hypothesis in terms of the ROA ratio.
19
Figure 4. ROA regression summary results
ROCE
The ROCE ratio by the other hand, has an oppsite result and that is that the CG has a
positive impact on the ROCE (+2.41). Moreover, this relationship is significant (p-value:
0.122) despite the suggested in the correlation analysis. It can be said that a 80% level of
confidence, there is enough evidence to claim there is a positive relationship between the CG
and the ROCE of a CAC40 firm. The model stands significant (F p-value: 0.1218) thus the CG
can explain the variance of the ROCE of a firm. However, the model can only predict 1.4% of
this variance according to the R-squared obtained.
20
Figure 5. ROCE regression summary results
With the data depicted in figure 2, the following model equation can be constructed
thus accepting the main hypothesis:
𝑌
𝑖
= −21.54 + 2.42𝑋
ROIC
Finally, figure 3 summarizes the results of the regression for the ROIC and the results are
similar to the first ratio. The CG has a positive impact on the ROA (+0.47) but is not significant
(p-value: 0.564). It can be said that a 80% level of confidence, there is not enough evidence to
claim there is a positive relationship between the CG and the ROIC of a CAC40 firm. The
model itself is not significant (F p-value: 0.5637) thus rejecting the main hypothesis in terms
of the ROIC ratio.
Figure 6. ROIC regression summary results
Having a summary of the obtained results as shown in table 4, it can be said that this
study has not found a strong relationship between the CG of a CAC40 firm and how it
performs in terms of its main financial ratios, ROA, ROCE and ROIC. The relationship can
be assumed to be weak and exists because of the ROCE ratio.
21
Hypothesis acceptance comparison
Hypothesis
ROA
ROCE
ROIC
H1
Rejected
Accepted
Rejected
Table 5. Hypotheses acceptance comparison
The regressions were run for the three performance indicators grouping the
observations according to the board system. The obtained results were very similar for both
groups but for all indicators, the unitary board group showed a strong positive relationship
answering positively to the research sub-question 1 and negatively to the sub-question 2. The
unitary board system does have a better impact in the performance indicators of the CAC40
firms.
7. Conclusion and limitations
Based on the results obtained, this study find a small positivee impact of the CG
variables on the CAC 40 companies. This does not mean that the CG is not important for the
firm's performance since it was widely described in this report, the literature supports such a
fact. However, it is necessary to identify quantitative variables that describe the approach used
by a company in terms of its CG, likewise reiterates the recommendation to expand both the
number of companies and years that make up the sample for further research and thus increase
the possibility of finding the aforementioned impact of CG variables on the performance of
CAC40 companies.
The main limitation that was found during this study is related to the amount of data
available for the statistical analysis since having two years of information limits the quality of
the applied regression and the correlation between the analyzed variables, putting at risk the
certainty of the results obtained. Therefore, it is suggested to extend the size of the sample to
10 years for further research in order to include possible behaviors during particular stages of
the markets as an economic resection among other elements. Likewise, it is suggested to have
a larger sample of companies.
Regarding the method of measuring corporate governance, it is also suggested to resort
to less qualitative measures to reduce subjectivity in the analysis of this variable, for example,
ratios that represent corporate transparency through correct accounting within the company.
However, this could imply that companies incorporate a series of indicators designed for this
purpose and that in this way they may be available for investigations such as this one.
22
8. References
Ahmadi, A. and Bouri, A., 2017. Board of directors’ composition and performance in French
CAC 40 listed firms. Accounting, 3(4), pp.245-256.
Akbar, S., Poletti-Hughes, J., El-Faitouri, R. and Shah, S.Z.A., 2016. More on the
relationship between corporate governance and firm performance in the UK:
Evidence from the application of generalized method of moments
estimation. Research in International Business and Finance, 38, pp.417-429.
Ammann, M., Oesch, D. and Schmid, M.M., 2011. Corporate governance and firm value:
International evidence. Journal of Empirical Finance, 18(1), pp.36-55.
Arora, A. and Sharma, C., 2016. Corporate governance and firm performance in developing
countries: evidence from India. Corporate Governance, 16(2), pp.420-436.
Bai, C.E., Liu, Q., Lu, J., Song, F.M. and Zhang, J., 2004. Corporate governance and market
valuation in China. Journal of comparative economics, 32(4), pp.599-616.
Bebchuk, L., Cohen, A. and Ferrell, A., 2008. What matters in corporate governance?. The
Review of financial studies, 22(2), pp.783-827.
Berger, A.N., Imbierowicz, B. and Rauch, C., 2016. The roles of corporate governance in
bank failures during the recent financial crisis. Journal of Money, Credit and
Banking, 48(4), pp.729-770.
Bhagat, S. and Bolton, B., 2008. Corporate governance and firm performance. Journal of
corporate finance, 14(3), pp.257-273.
Bhagat, S. and Bolton, B., 2013. Director ownership, governance, and performance. Journal
of Financial and Quantitative Analysis, 48(1), pp.105-135.
Bistrova, J. and Lace, N., 2011. Evaluation of Corporate Governance Influence on Stock
Performance of CEE Companies. WMSCI 2011 Proceedings I, United States of
America, Orlando, 19(22), pp.59-64.
Black, B.S., Kim, W., Jang, H. and Park, K.S., 2015. How corporate governance affect firm
value? Evidence on a self-dealing channel from a natural experiment in
23
Brown, L.D. and Caylor, M.L., 2009. Corporate governance and firm operating
performance. Review of quantitative finance and accounting, 32(2), pp.129-144.
Brown, P., Beekes, W. and Verhoeven, P., 2011. Corporate governance, accounting and
finance: A review. Accounting & finance, 51(1), pp.96-172.
Bruno, V. and Claessens, S., 2010. Corporate governance and regulation: can there be too
much of a good thing?. Journal of Financial Intermediation, 19(4), pp.461-482.
Christensen, J., Kent, P., Routledge, J. and Stewart, J., 2015. Do corporate governance
recommendations improve the performance and accountability of small listed
companies?. Accounting & Finance, 55(1), pp.133-164.
Claessens, S. and Yurtoglu, B.B., 2013. Corporate governance in emerging markets: A
survey. Emerging markets review, 15, pp.1-33.
Corporate Governance in French listed companies, an investor guide. (2015) Institut Français
des Administrateurs. Available at:
http://www.experts-comptables.fr/sites/default/files/asset/document/gouvernance_en_france_2015_versio
n_anglaise_0.pdf (Accessed: 26th April 2018).
Cremers, K.J., and Nair, V.B., 2005. Governance mechanisms and equity prices, The Journal
of Finance, Vol. 60 No. 6, pp. 2859-2894
Dalwai, T.A.R., Basiruddin, R. and Abdul Rasid, S.Z., 2015. A critical review of relationship
between corporate governance and firm performance: GCC banking sector
perspective. Corporate Governance, 15(1), pp.18-30.
Denis, D.K., 2001. Twenty-five years of corporate governance research. . . and counting.
Review of Financial Economics 10, 191-212.
Ebaid, I. E., 2009. The impact of capital structure choice on firm performance: empirical
evidence from Egypt, The Journal of Risk Finance, 10(5): 477 -487.
Erkens, D.H., Hung, M. and Matos, P., 2012. Corporate governance in the 2007–2008
financial crisis: Evidence from financial institutions worldwide. Journal of corporate
finance, 18(2), pp.389-411.
Euronext., 2018. Country and Cross Border Indices. Retrieved from
24
Gomez, L.R., 2005. A Theory of Global Strategy and Firm Efficiencies: Considering the
Effects of Cultural Diversity. Journal of Management, 25 (4), 587-606.
Joh, S.W., 2003. Corporate governance and firm profitability: evidence from Korea before
the economic crisis. Journal of financial Economics, 68(2), pp.287-322.
Mizuno, M., 2014. Corporate governance, institutional investors, and firm performance in
France. Journal of Business and Finance, 2(1), pp.33-46.
Meng, X. L., Rosenthal, R., & Rubin, D. B. (1992). Comparing correlated correlation
coefficients. Psychological bulletin, 111(1), 172.
Mohamed, W.S. and Elewa, M.M., 2016. The Impact of Corporate Governance on Stock
Price and Trade Volume. International Journal of Accounting and Financial
Reporting, 6(2), pp.27-44.
Monks, K., 1996. Global versus Local: Managing Human Resources in the Multinational
Company. Evidence from some Irish subsidiaries. International Journal of Human
Resource Management, 7(3): 721-735.
Patibandla, M., 2006. Equity pattern, corporate governance and performance: A study of
India's corporate sector. Journal of Economic Behavior & Organisation, 59(1),
pp.29-44.
Pollard, D.S., Stewart, D. and Sun, W., 2014. Corporate governance and Global Financial
Crisis.
London: Springer
Reddy, K., Locke, S. and Scrimgeour, F., 2010. The efficacy of principle-based corporate
governance practices and firm financial performance: An empirical
investigation. International Journal of Managerial Finance, 6(3), pp.190-219.
Sami, H., Wang, J. and Zhou, H., 2011. Corporate governance and operating performance of
Chinese listed firms. Journal of International Accounting, Auditing and
Taxation, 20(2), pp.106-114.
Sami, H., Wang, J. and Zhou, H., 2011. Corporate governance and operating performance of
Chinese listed firms. Journal of International Accounting, Auditing and
25
Shleifer, A. and Vishny, R.W., 1997. A survey of corporate governance. The journal of
finance, 52(2), pp.737-783.
Siddiqui, S.S., 2015. The association between corporate governance and firm performance–a
meta-analysis. International Journal of Accounting and Information
Management, 23(3), pp.218-237.
Siddiqui, S.S., 2015. The association between corporate governance and firm performance–a
meta-analysis. International Journal of Accounting and Information
Management, 23(3), pp.218-237.
Sun, W., Stewart, J. and Pollard, D. eds., 2011. Corporate governance and the global
financial crisis: International perspectives. Cambridge University Press.
Yasser, Q., Entebang, H. and Mansor, S., 2015. Corporate governance and firm performance
in Pakistan: The case of Karachi Stock Exchange (KSE)-30.
Zabri, S.M., Ahmad, K. and Wah, K.K., 2016. Corporate governance practices and firm
performance: Evidence from top 100 public listed companies in Malaysia. Procedia
Economics and Finance, 35, pp.287-296.
26
9. Appendices
Appendix 1: Corporate Governance Assessment Model
Worst (0)
Neutral (0,5 )
Best (1)
Independence of directors
0-50%
50-75%
75-100%
Performance-based compensation
NO
Partial
for all members
Diversified backgrounds of directors
Concentrated
Average
Diversified
CEO/Chairman position separated
NO
YES
Size of the board of directors
More than 10
Less than 5
Between 5 and 10
Directors average age
age < 60 or age < 40
40< age <60
Stability of BoD
30% and more change
10-30% member change
0-10% member change
Board Gender diversity
Less than 35%
between 35% and 45%
Between 45% and 50%
Committee structure
Less than 4 committees
More than 4 committees
4 committees
Frequency of Elections
Once in more than 3 years
Once in 3 years
Once in 1 year
Frequency of meetings
<4 and >10 meetings
4-5 and 9-10 meetings
6-8 meetings
0
5,5
11
Stability
30% and more
10-30% member change
0-10% member change
CEO Age
age > 65 or age < 40
40 < age <65
CEO Background
irrelevant
not very relevant
relevant
0
1,5
3
Information regarding AGM
NO
Not explicit
YES
Dividend policy
NO
Not 100% clear
YES
0
1
2
Ownership Structure
NO
YES
Info on BoD
NO
Not explicit
YES
Info on mgmt
NO
Not explicit
YES
0
1,5
3
0
9,5
19
Corporate Governance Assessment Model
Disclosure of
information
Total
Sub-total
Supervisory
Board/BoD
Sub-total
Management Team
Sub-total
Investor
Relations/AGM
Sub-total
27
Management Team
CEO - Chairman Directors Independence BOD Stability Meetings frequency Elections Frequency Diversified background of directors Committee structure Performance-based compensation Size of the directors board Directors average age Board Gender diversity Management Stability CEO AgeCEO Background
Information
regarding AGM Dividend policy Info on
managementInfo on BOD Ownership
Structure
Accor Unitary Yes 56,25% 12% 4 3 diversified over 4 comm for all members 13 51,5 46,15% 21% 54 not very relevant yes yes yes yes yes Air Liquide Unitary Yes 66,67% 17% 9 3 average less than 4 committees for all members 12 57,5 41,66% 9% 58 relevant yes yes yes yes yes Axa Unitary No 71,43% 0% 11 4 diversified less than 4 committees for all members 14 59 42,85% 0% 44 relevant yes yes yes yes yes Atos Unitary Yes 70,00% 8% 4 3 average over 4 comm for all members 12 58,2 50,00% 8% 61 relevant yes Not 100% clear yes yes no Bouygues Unitary Yes 41,67% 13% 10 3 diversified less than 4 committees for all members 15 55,9 46,66% 0% 64 relevant yes yes yes yes yes Cap Gemini Unitary Yes 61,54% 19% 6 4 diversified 4 committees for all members 16 61 46,00% 8% 64 relevant yes yes yes yes yes Carrefour Unitary Yes 52,94% 8% 4 3 average over 4 comm for all members 19 60 36,84% 0% 43 not very relevant yes yes yes yes yes
Danone Unitary No 71,43% 13% 3 3 diversified 4 committees for all members 16 54 31,25% 12% 52 relevant yes yes yes yes yes
Engie Unitary No 42,11% 26% 9 2 diversified 4 committees for all members 19 56 42,10% 8% 49 relevant yes yes yes yes yes
Essilor International Unitary Yes 53,67% 15% 5 2 diversified less than 4 committees for all members 13 58 42,00% 0% 61 relevant yes yes yes yes yes
Kering Unitary Yes 60,00% 9% 4 4 diversified 4 committees for all members 11 52 64,00% 9% 54 relevant yes yes yes yes yes
L'Oreal Unitary Yes 50,00% 20% 5 3 diversified 4 committees no 15 56 46,00% 12% 60 relevant yes Not 100% clear yes yes no
Legrand Unitary Yes 59,00% 10% 4 3 average 4 committees for all members 10 55 50,00% 0% 57 relevant yes Not 100% clear yes yes yes LVMH Unitary Yes 60,00% 7% 6 4 diversified less than 4 committees for all members 15 60 41,00% 0% 67 irrelevant yes yes yes yes yes Michelin Dual No 66,67% 15% 3 4 diversified less than 4 committees for all members 9 60 44,44% 12% 63 not very relevant yes yes yes yes yes Orange Unitary Yes 46,67% 26% 8 4 diversified less than 4 committees no 15 55 40,00% 0% 55 not very relevant yes yes yes yes yes
Pernod Ricard Unitary Yes 42,86% 0% 8 4 Average over 4 comm for all members 13 51 38,46% 32% 44 relevant yes yes yes yes yes
Peugeot Dual No 66,67% 11% 3 4 diversified less than 4 committees for all members 17 56 33,33% 27% 58 relevant yes yes yes yes yes Publicis Groupe SA Dual No 66,67% 0% 3 4 diversified over 4 comm for all members 12 60 50,00% 0% 44 relevant yes yes yes yes yes
Renault Unitary Yes 66,37% 6% 5 3 diversified over 4 comm for all members 19 55 31,25% 13% 62 relevant yes yes yes yes yes
Safran Unitary No 53,78% 11% 9 3 diversified 4 committees for all members 17 58 40,00% 0% 64 relevant yes yes yes yes yes
Saint Gobain Unitary Yes 57,14% 14% 10 4 diversified less than 4 committees for all members 14 56 42,00% 17% 58 relevant yes yes yes yes yes
Sanofi Unitary No 68,75% 0% 11 4 average over 4 comm for all members 16 59 43,00% 29% 60 relevant yes yes yes yes yes
Schneider Electric Unitary Yes 69,23% 0% 3 4 diversified 4 committees for all members 13 58 40,00% 11% 53 relevant yes yes yes yes yes Sodexo Unitary No 42,86% 14% 12 4 diversified less than 4 committees for all members 14 58 50,00% 8% 64 relevant yes yes yes yes yes
Total Unitary Yes 33,33% 9% 5 3 diversified 4 committees for all members 12 60 50,00% 31% 53 relevant yes yes yes yes yes
Valeo SA Unitary Yes 91,67% 0% 7 4 diversified 4 committees for all members 12 61 41,66% 7% 61 not very relevant yes yes yes yes yes Veolia Environnement Unitary Yes 52,94% 12% 5 2 diversified 4 committees for all members 17 57 40,00% 0% 58 relevant Not explicit yes yes yes no
Vinci Unitary Yes 60,00% 0% 9 3 diversified less than 4 committees no 14 59 42,85% 19% 61 relevant yes yes yes yes yes
Vivendi Dual No 51,00% 0% 4 3 diversified less than 4 committees for all members 12 51 50,00% 10% 52 relevant yes yes yes yes yes
Supervisory Board/BoD
Investor Relations/AGM
Disclosure of information
COMPANY
BOARD
SYSTEM
28
CEO - Chairman Directors Independence BOD Stability Meetings frequency Elections Frequency Diversified background of directors Committee structure Performance-based compensation Size of the directors board Directors average age Board Gender diversity Management Stability CEO AgeCEO Background Information regarding AGM Dividend policy Info on management Info on BoD Ownership Structure Accor 0 0,5 0,5 1 0,5 1 0,5 1 0 1 1 0,5 1 0,5 1 1 1 1 1 14 Air Liquide 0 0,5 0,5 0 0,5 0,5 0 1 0 1 0,5 1 1 1 1 1 1 1 1 12,5 Axa 1 0,5 1 1 0 0,5 0 1 0 1 1 1 1 1 1 1 1 1 1 15 Atos 0 0,5 1 1 0,5 1 1 1 0 1 0,5 1 1 1 1 0,5 1 1 0 14,0 Bouygues 0 0 0,5 0,5 0,5 1 0 1 0 1 1 1 1 1 1 1 1 1 1 13,5 Cap Gemini 0 0,5 0,5 1 0 1 1 1 0 0 1 1 1 1 1 1 1 1 1 14 Carrefour 0 0,5 1 0 0,5 0,5 0,5 1 0 0 0,5 1 1 0,5 1 1 1 1 1 12 Danone 1 0,5 0,5 1 0,5 1 1 1 0 1 0 0,5 1 1 1 1 1 1 1 15 Engie 1 0 0,5 1 0,5 1 1 1 0 1 0,5 1 1 1 1 1 1 1 1 15,5 Essilor International 0 0,5 0,5 1 0,5 1 0,5 1 0 1 0,5 1 1 1 1 1 1 1 1 14,5 Kering 0 0,5 1 0,5 0 1 1 1 0 1 1 1 1 1 1 0,5 1 1 1 14,5 L'Oreal 0 0,5 1 1 0,5 0,5 1 1 1 1 1 1 1 1 1 0,5 1 1 0 15 Legrand 0 0,5 0,5 1 0,5 1 1 0 0 1 1 0,5 1 1 1 1 1 1 1 14 LVMH 0 0,5 1 1 0 1 0 1 0 1 0,5 1 0 0 1 1 1 1 1 12 Michelin 1 0,5 0,5 0 0 1 0 1 1 1 0,5 0,5 1 0,5 1 1 1 1 1 13,5 Orange 0 0 0,5 1 0 1 0 0 0 1 0,5 1 1 0,5 1 1 1 1 1 11,5 Pernod Ricard 0 0 1 1 0 0,5 0,5 1 0 1 0,5 0 1 1 1 1 1 1 1 12,5 Peugeot 1 0,5 0,5 0,5 0 1 0 1 0 1 0 0,5 1 1 1 1 1 1 1 13 Publicis Groupe SA 1 0,5 1 1 0 1 0,5 1 0 1 1 1 1 1 1 1 1 1 1 16 Renault 0 0,5 1 0 0,5 1 0,5 1 0 1 0 0,5 1 1 1 1 1 1 1 13 Safran 1 0,5 0,5 0 0,5 1 1 1 0 1 0,5 1 1 1 1 1 1 1 1 15 Saint Gobain 0 0,5 0,5 0,5 0 1 0 1 0 1 0,5 0,5 1 1 1 1 1 1 1 12,5 Sanofi 1 0,5 1 0,5 0 0,5 0,5 1 0 1 0,5 0,5 1 1 1 1 1 1 1 14 Schneider Electric 0 0,5 1 1 0 1 1 1 0 1 0,5 0,5 1 1 1 1 1 1 1 14,5 Sodexo 1 0 0,5 1 0 1 0 1 0 1 1 1 1 1 1 1 1 1 1 14,5 Total 0 0 1 0,5 0,5 1 1 1 0 1 0,5 0 1 1 1 1 1 1 1 13,5 Valeo SA 0 1 0,5 1 0 1 1 1 0 1 0,5 1 1 0,5 1 1 1 1 1 14,5 Veolia Environnement 0 0,5 0,5 1 0,5 1 1 1 0 1 0,5 1 1 1 0,5 1 1 1 0 13,5 Vinci 0 0,5 1 0 0,5 1 0 0 0 1 0,5 0,5 1 1 1 1 1 1 1 12 Vivendi 1 0,5 0,5 0,5 0,5 1 0 1 0 1 1 1 1 1 1 1 1 1 1 15
COMPANY
Supervisory Board/BoD
Management Team
Investor Relations/AGM
Disclosure of information
29
Appendix 3: 2017 Assessment Data
Management Team
CEO - Chairman Directors Independence BOD Stability Meetings frequency Elections Frequency Diversified background of directors Committee structure Performance-based compensation Size of the directors board Directors average age Board Gender diversity Management Stability CEO AgeCEO Background
Information
regarding AGM Dividend policy Info on
managementInfo on BOD Ownership
Structure
Accor Unitary Yes 56,25% 0% 6 3 diversified over 4 comm for all members 13 52,5 46,15% 21% 55 not very relevant yes yes yes yes yes Air Liquide Unitary Yes 66,67% 17% 3 3 average less than 4 committees for all members 12 58,5 41,66% 9% 59 relevant yes yes yes yes yes
Axa Unitary No 71,43% 0% 8 4 diversified 4 committees for all members 14 60 42,85% 0% 45 relevant yes yes yes yes yes
Atos Unitary Yes 70,00% 8% 7 3 average over 4 comm for all members 12 59,2 50,00% 8% 62 relevant yes Not 100% clear yes yes no Bouygues Unitary Yes 41,67% 13% 5 3 diversified less than 4 committees for all members 15 56,9 46,66% 0% 65 relevant yes yes yes yes yes Cap Gemini Unitary Yes 61,54% 19% 6 4 diversified 4 committees for all members 16 62 46,00% 8% 65 relevant yes yes yes yes yes Carrefour Unitary Yes 52,94% 8% 3 3 average over 4 comm for all members 19 61 36,84% 0% 44 not very relevant yes yes yes yes yes
Danone Unitary No 71,43% 13% 6 3 diversified 4 committees for all members 16 55 31,25% 12% 53 relevant yes yes yes yes yes
Engie Unitary No 42,11% 26% 6 2 diversified 4 committees for all members 19 57 42,10% 8% 50 relevant yes yes yes yes yes
Essilor International Unitary Yes 53,67% 15% 8 2 diversified 4 committees for all members 13 59 46,15% 0% 62 relevant yes yes yes yes yes
Kering Unitary Yes 60,00% 9% 4 4 diversified 4 committees for all members 11 53 64,00% 9% 55 relevant yes yes yes yes yes
L'Oreal Unitary Yes 50,00% 20% 6 3 diversified 4 committees no 15 57 46,00% 12% 61 relevant yes Not 100% clear yes yes no
Legrand Unitary Yes 70,00% 10% 6 3 average 4 committees for all members 10 56 50,00% 0% 58 relevant yes yes yes yes yes
LVMH Unitary Yes 60,00% 7% 6 4 diversified less than 4 committees for all members 15 61 41,00% 0% 68 irrelevant yes yes yes yes yes Michelin Dual No 66,67% 0% 1 4 diversified less than 4 committees for all members 9 61 44,44% 8% 64 not very relevant yes yes yes yes yes Orange Unitary Yes 46,67% 26% 8 4 diversified less than 4 committees no 15 56 40,00% 0% 56 not very relevant yes yes yes yes yes Pernod Ricard Unitary Yes 42,86% 0% 8 4 diversified over 4 comm for all members 13 52 38,46% 32% 45 relevant yes yes yes yes yes Peugeot Dual No 66,67% 11% 5 4 diversified less than 4 committees for all members 17 57 33,33% 27% 59 relevant yes yes yes yes yes Publicis Groupe SA Dual No 66,67% 0% 7 4 diversified over 4 comm for all members 12 61 50,00% 0% 45 relevant yes yes yes yes yes
Renault Unitary Yes 66,37% 6% 1 3 diversified over 4 comm for all members 19 56 31,25% 13% 63 relevant yes yes yes yes yes
Safran Unitary No 53,78% 11% 13 3 diversified 4 committees for all members 17 59 40,00% 0% 65 relevant yes yes yes yes yes
Saint Gobain Unitary Yes 57,14% 14% 10 4 diversified less than 4 committees for all members 14 57 42,00% 17% 59 relevant yes yes yes yes yes
Sanofi Unitary No 68,75% 0% 9 4 average over 4 comm for all members 16 60 43,00% 29% 61 relevant yes yes yes yes yes
Schneider Electric Unitary Yes 69,23% 0% 6 4 diversified 4 committees for all members 13 59 40,00% 6% 54 relevant yes yes yes yes yes Sodexo Unitary No 42,86% 14% 6 4 diversified less than 4 committees for all members 14 59 50,00% 8% 65 relevant yes yes yes yes yes
Total Unitary Yes 33,33% 9% 9 3 diversified 4 committees for all members 12 61 50,00% 31% 54 relevant yes yes yes yes yes
Valeo SA Unitary Yes 91,67% 0% 7 4 diversified 4 committees for all members 12 62 41,66% 7% 62 not very relevant yes yes yes yes yes Veolia Environnement Unitary Yes 52,94% 12% 6 2 diversified 4 committees for all members 17 58 40,00% 0% 59 relevant Not explicit yes yes yes no
Vinci Unitary Yes 60,00% 0% 11 3 diversified less than 4 committees no 14 60 42,85% 19% 62 relevant yes yes yes yes yes
Vivendi Dual No 50,00% 0% 5 3 diversified less than 4 committees for all members 12 52 50,00% 10% 53 relevant yes yes yes yes yes
Disclosure of information
Supervisory Board/BoD
Investor Relations/AGM
COMPANY
BOARD
SYSTEM
30
CEO - Chairman DirectorsIndependence BOD Stability Meetings frequency Elections Frequency Diversified background of directors Committee structure Performance-based compensation Size of the directors board Directors average age Board Gender diversity Manageme nt Stability CEO Age
CEO Background Information regarding AGM Dividend policy Info on manageme nt Info on BoD Ownership Structure Accor 0 0,5 1 1 0,5 1 0,5 1 0 1 1 0,5 1 0,5 1 1 1 1 1 14,5 Air Liquide 0 0,5 0,5 0 0,5 0,5 0 1 0 1 0,5 1 1 1 1 1 1 1 1 12,5 Axa 1 0,5 1 1 0 0,5 0,5 1 0 1 0,5 1 1 1 1 1 1 1 1 15 Atos 0 0,5 1 1 0,5 1 1 1 0 1 1 1 1 1 1 0,5 1 1 0 14,5 Bouygues 0 0 0,5 0,5 0,5 1 0 1 0 1 1 1 0 1 1 1 1 1 1 12,5 Cap Gemini 0 0,5 0,5 1 0 1 1 1 0 0 1 1 0 1 1 1 1 1 1 13 Carrefour 0 0,5 1 0 0,5 0,5 0,5 1 0 0 0,5 1 1 0,5 1 1 1 1 1 12 Danone 1 0,5 0,5 1 0,5 1 1 1 0 1 0 0,5 1 1 1 1 1 1 1 15 Engie 1 0 0,5 1 0,5 1 1 1 0 1 0,5 1 1 1 1 1 1 1 1 15,5 Essilor International 0 0,5 0,5 1 0,5 1 1 1 0 1 1 1 1 1 1 1 1 1 1 15,5 Kering 0 0,5 1 0,5 0 1 1 1 0 1 1 1 1 1 1 1 1 1 1 15 L'Oreal 0 0,5 1 1 0,5 0,5 1 1 0 1 1 0,5 1 1 1 0,5 1 1 0 13,5 Legrand 0 0,5 0,5 1 0,5 1 1 0 1 1 1 1 1 1 1 1 1 1 1 15,5 LVMH 0 0,5 1 1 0 1 0 1 0 0 0,5 1 0 0 1 1 1 1 1 11 Michelin 1 0,5 1 0 0 1 0 1 1 0 0,5 1 1 0,5 1 1 1 1 1 13,5 Orange 0 0 0,5 1 0 1 0 0 0 1 0,5 1 1 0,5 1 1 1 1 1 11,5 Pernod Ricard 0 0 1 1 0 1 0,5 1 0 1 0,5 0 1 1 1 1 1 1 1 13 Peugeot 1 0,5 0,5 0,5 0 1 0 1 0 1 0 0,5 1 1 1 1 1 1 1 13 Publicis Groupe SA 1 0,5 1 1 0 1 0,5 1 0 0 1 1 1 1 1 1 1 1 1 15 Renault 0 0,5 1 0 0,5 1 0,5 1 0 1 0 0,5 1 1 1 1 1 1 1 13 Safran 1 0,5 0,5 0 0,5 1 1 1 0 1 0,5 1 0 1 1 1 1 1 1 14 Saint Gobain 0 0,5 0,5 0,5 0 1 0 1 0 1 0,5 0,5 1 1 1 1 1 1 1 12,5 Sanofi 1 0,5 1 0,5 0 0,5 0,5 1 0 1 0,5 0,5 1 1 1 1 1 1 1 14 Schneider Electric 0 0,5 1 1 0 1 1 1 0 1 0,5 1 1 1 1 1 1 1 1 15 Sodexo 1 0 0,5 1 0 1 0 1 0 1 1 1 0 1 1 1 1 1 1 13,5 Total 0 0 1 0,5 0,5 1 1 1 0 0 1 0 1 1 1 1 1 1 1 13 Valeo SA 0 1 1 1 0 1 1 1 0 0 0,5 1 1 0,5 1 1 1 1 1 14 Veolia Environnement 0 0,5 0,5 1 0,5 1 1 1 0 1 0,5 1 1 1 0,5 1 1 1 0 13,5 Vinci 0 0,5 1 0 0,5 1 0 0 0 1 0,5 0,5 1 1 1 1 1 1 1 12 Vivendi 1 0,5 1 0,5 0,5 1 0 1 0 1 1 1 1 1 1 1 1 1 1 15,5
Company
Supervisory Board/BoD
Management Team
Investor Relations/AGM
Disclosure of information
31
Accor S.A.
Air Liquide SA
Average age 52,5
Name Age Current Position Officer/Director In Position Total Compensation (€)
Mr. Sebastien Bazin 55 Chairman of the Board, Chief Executive Officer, Member of the Executive Committee 13 Years 4 Years 2,513,215 Mr. Sven Boinet 64 Deputy Chief Executive Officer in charge of Group Procurement, Audit, Legal and Security & Safety -- 2 Years 1,343,054 Mr. Laurent Picheral 51 Deputy Chief Executive Officer and Chief Operating Officer HotelInvest -- 1 Year --Mr. Jean-Jacques Morin -- Chief Financial Officer, Member of the Executive Committee -- -- --Mr. Jean-Jacques Dessors 53 Chief Executive Officer HotelServices, Europe (excl. France and Switzerland) -- 1 Year --Mr. Michael Issenberg -- Chief Executive Officer of HotelServices, Asia-Pacific, Member of the Executive Committee 9 Years 3 Years
--Mr. Patrick Mendes -- Chief Executive Officer HotelServices, Latin America -- --
--Mr. Amir Nahai -- Chief Executive Officer Group Food & Beverage, Member of the Executive Committee 2 Years 2 Years --Ms. Sophie Stabile 47 Chief Executive Officer HotelServices, France & Switzerland 19 Years 1 Year
--Mr. Francois Pinon -- Group General Counsel, Secretary -- 2 Years
--Mr. John Ozinga 50 Chief Operating Officer of HotelInvest, Member of the Executive Committee -- 3 Years
--Ms. Maud Bailly -- Chief Digital Officer 1 Year 1 Year
--Ms. Arantxa Balson 50 Chief Talent & Culture Officer, Member of the Executive Committee 3 Years 3 Years
--Mr. Gaurav Bhushan -- Chief Development Officer -- --
--Mr. Chris Cahill 61 Chief Executive Officer Luxury Brands and HotelServices, North America, Central America and the Caribbean -- -- --Mr. Steven Daines 51 CEO New Businesses and CEO HotelServices, Africa and the Middle East 3 Years 1 Year
--Sheikh Nawaf Al-Thani 45 Director 1 Year 1 Year
--Mr. Vivek Badrinath 48 Director 4 Years 1 Year
--Ms. Iliane Dumas 46 Director - Representing Employees 4 Years 4 Years
--Mr. Aziz Aluthman Fakhroo 39 Director 1 Year 1 Year
--Mr. Patrick Sayer 59 Director 9 Years 9 Years 61,583
Mr. Sarmad Zok 48 Director 1 Year 1 Year
--Mr. Jean-Paul Bailly 70 Independent Director 9 Years 9 Years 51,954
Mrs. Mercedes Erra 62 Independent Director 7 Years 7 Years 43,830
Ms. Sophie Gasperment 52 Independent Director 7 Years 7 Years 59,306
Mr. Qionger Jiang 40 Independent Director 1 Year 1 Year
--Ms. Iris Knobloch 54 Independent Director 5 Years 5 Years 39,559
Mr. Bertrand Meheut 65 Independent Director 9 Years 9 Years 44,081
Mr. Nicolas Sarkozy 62 Independent Director 1 Year 1 Year
--Ms. Isabelle Simon 47 Independent Director 1 Year 1 Year
--Ms. Natacha Valla 41 Independent Director 1 Year 1 Year
--Mr. Sebastien Valentin -- Senior Vice President of Financial Communication and Investors Relations -- --
--Age average 58,8
Name Age Current Position Officer/Director In Position Total Compensation (€)
Mr. Benoit Potier 59 Chairman of the Board, Chief Executive Officer, Member of the General Management Team and Member of the Executive Committee 18 Years 12 Years 2,831,000 Ms. Fabienne Lecorvaisier 54 Chief Financial Officer, Vice President - Finance, Operations Control, Diving, Welding 9 Years 3 Years --Mr. Guy Salzgeber 59 Senior Vice President - Europe Industries Frankfurt hub, Executive Vice President, Group Procurement 10 Years 2 Years --Mr. Francois Darchis 61 Senior Vice President - Strategy, IDST (Innovation, Digital, Science, Technologies), Information Technologies, Industrial Merchant
World Business Line
-- --
--Mr. Jean-Marc de Royere 52 Senior Vice President - International, Governance and Corporate Social Responsibility -- 5 Years
--Mr. Michael (Mike) Graff 61 Senior Vice President 9 Years 3 Years
--Mr. Pascal Vinet 55 Vice President of Healthcare Global Operations and Member of the Executive Committee 11 Years 7 Years
--Mr. Francois Abrial 55 Vice President - Group Human Resources 8 Years 3 Years
--Mr. Francois Jackow -- Vice President Supervising the Dubaï hub, Healthcare, Healthcare World Business Line, Customers 4 Years 2 Years --Mr. Francois Venet 50 Vice President - Asia Pacific, Shanghai Hub Executive Vice-President -- --
--Mr. Mok Weng 64 Vice President - Deputy Head of Asia 30 Years 5 Years
--Mr. Thierry Desmarest 71 Independent Director - Lead Director 19 Years 3 Years 105,000
Mr. Philippe Dubrulle 45 Director representing the employees 3 Years 3 Years
--Mr. Pierre Dufour 62 Director 21 Years 1 Year 1,673,000
Mr. Jean-Paul Agon 61 Independent Director 8 Years 8 Years 85,000
Ms. Genevieve Berger 62 Independent Director -- -- 63,000
Mr. Brian Gilvary 55 Independent Director -- -- 47,000
Ms. Sian Herbert-Jones 56 Independent Director 7 Years 7 Years 89,000
Mr. Xavier Huillard 62 Independent Director 1 Year 1 Year
--Ms. Karen Katen 68 Independent Director 10 Years 10 Years 71,000
Ms. Sin Leng Low 65 Independent Director -- 3 Years 102,000
Mr. Thierry Peugeot 59 Independent Director 13 Years 12 Years 69,000