EUROPEAN ORGANISATION FOR NUCLEAR RESEARCH (CERN)
Eur. Phys. J. C 78 (2018) 903
DOI:10.1140/epjc/s10052-018-6288-9
CERN-EP-2017-274 14th December 2018
Performance of missing transverse momentum
reconstruction with the ATLAS detector using
proton–proton collisions at
√
s
= 13 TeV
The ATLAS Collaboration
The performance of the missing transverse momentum (ETmiss) reconstruction with the ATLAS detector is evaluated using data collected in proton–proton collisions at the LHC at a centre-of-mass energy of 13 TeV in 2015. To reconstruct ETmiss, fully calibrated electrons, muons, photons, hadronically decaying τ-leptons, and jets reconstructed from calorimeter energy deposits and charged-particle tracks are used. These are combined with the soft hadronic activity measured by reconstructed charged-particle tracks not associated with the hard ob-jects. Possible double counting of contributions from reconstructed charged-particle tracks from the inner detector, energy deposits in the calorimeter, and reconstructed muons from the muon spectrometer is avoided by applying a signal ambiguity resolution procedure which rejects already used signals when combining the various ETmisscontributions. The individual terms as well as the overall reconstructed ETmissare evaluated with various performance met-rics for scale (linearity), resolution, and sensitivity to the data-taking conditions. The method developed to determine the systematic uncertainties of the ETmiss scale and resolution is dis-cussed. Results are shown based on the full 2015 data sample corresponding to an integrated luminosity of 3.2 fb−1.
© 2018 CERN for the benefit of the ATLAS Collaboration.
Contents
1 Introduction 4 2 ATLAS detector 4 3 EmissT reconstruction 5 3.1 ETmissbasics 5 3.2 ETmissterms 7 3.3 Object selection 9 3.3.1 Electron selection 9 3.3.2 Photon selection 9 3.3.3 τ-lepton selection 10 3.3.4 Muon selection 10 3.3.5 Jet selection 103.3.6 Muon overlap with jets 11
3.4 ETmisssoft term 12
3.4.1 Track and vertex selection 13
3.4.2 Track soft term 13
4 Data and simulation samples 13
4.1 Data samples 14
4.2 Monte Carlo samples 14
4.3 Pile-up 15
5 Event selection 15
5.1 Z → µµ event selection 15
5.2 W → eν event selection 16
5.3 t ¯t event selection 16
6 Performance of ETmissreconstruction in data and Monte Carlo simulation 17
6.1 ETmissmodelling in Monte Carlo simulations 18
6.2 ETmissresponse and resolution 20
6.2.1 ETmissscale determination 22
6.2.2 Measuring the ETmissresponse 23
6.2.3 Determination of the ETmissresolution 25
6.2.4 ETmissresolution measurements 26
6.2.5 ETmissresolution in final states with neutrinos 28
6.3 ETmisstails 29
7 Systematic uncertainties 31
7.1 Methodology 32
7.1.1 Observables 32
7.1.2 Procedures 33
7.2 Systematic uncertainties in ETmissresponse and resolution 35
8 Missing transverse momentum reconstruction variants 35
8.2 ETmissfrom tracks 36
8.3 Performance evaluations for ETmissvariants 36
8.3.1 Comparisons of ETmissresolution 37
8.3.2 Comparisons of ETmissscale 39
8.3.3 Summary of performance 40
9 Conclusion 41
Appendix 43
A Glossary of terms 43
B Alternative ETmisscomposition 43
1 Introduction
The missing transverse momentum (ETmiss) is an important observable serving as an experimental proxy for the transverse momentum carried by undetected particles produced in proton–proton (pp) collisions measured with the ATLAS detector [1] at the Large Hadron Collider (LHC). It is reconstructed from the signals of detected particles in the final state. A value incompatible with zero may indicate not only the production of Standard Model (SM) neutrinos but also the production of new particles suggested in models for physics beyond the SM that escape the ATLAS detector without being detected. The reconstruction of ETmiss is challenging because it involves all detector subsystems and requires the most complete and unambiguous representation of the hard interaction of interest by calorimeter and tracking signals. This representation is obscured by limitations introduced by the detector acceptance and by signals and signal remnants from additional pp interactions occurring in the same, previous and subsequent LHC bunch crossings (pile-up) relative to the triggered hard-scattering. ATLAS has developed successful strategies for a high-quality ETmissreconstruction focussing on the minimisation of effects introduced by pile-up for the data recorded between 2010 and 2012 (LHC Run 1) [2, 3]. These approaches are the basis for the Emiss
T reconstruction developed for the data collected in 2015 (LHC Run 2) that is described in this paper,
together with results from performance evaluations and the determination of systematic uncertainties. This paper is organised as follows. The subsystems forming the ATLAS detector are described in Section2. The ETmissreconstruction is discussed in Section3. The extraction of the data samples and the generation of the Monte Carlo (MC) simulation samples are presented in Section4. The event selection is outlined in Section5, followed by results for ETmiss performance in Section6. Section 7comprises a discussion of methods used to determine systematic uncertainties associated with the ETmiss measurement, and the presentation of the corresponding results. Section8describes variations of the ETmissreconstruction using calorimeter signals for the soft hadronic event activity, or reconstructed charged-particle tracks only. The paper concludes with a summary and outlook in Section9. The nomenclature and conventions used by ATLAS for ETmiss-related variables and descriptors can be found in Appendix A, while the composition of ETmissreconstruction variants is presented in AppendixB. An evaluation of the effect of alternative jet selections on the ETmissreconstruction performance is given in AppendixC.
2 ATLAS detector
The ATLAS experiment at the LHC features a multi-purpose particle detector with a forward–backward symmetric cylindrical geometry and a nearly full (4π) coverage in solid angle.1 It consists of an inner detector (ID) tracking system in a 2 T axial magnetic field provided by a superconducting solenoid. The solenoid is surrounded by electromagnetic and hadronic calorimeters, and a muon spectrometer (MS). The ID covers the pseudorapidity range |η| < 2.5, and consists of a silicon pixel detector, a silicon microstrip detector and a transition radiation tracker for |η| < 2.0. During the LHC shutdown between Run 1 and Run 2, a new tracking layer, known as the insertable B-layer [4], was added between the previous innermost pixel layer and a new, narrower beam pipe.
1ATLAS uses a right-handed coordinate system with its origin at the nominal interaction point (IP) in the centre of the detector and the z-axis along the beam pipe. The x-axis points from the IP to the centre of the LHC ring, and the y-axis points upwards. Cylindrical coordinates (r, φ) are used in the transverse plane, φ being the azimuthal angle around the z-axis. The pseudorapidity is defined in terms of the polar angle θ as η = − ln tan(θ/2). Angular distance is measured in units of ∆R ≡p(∆η)2+ (∆φ)2.
The high-granularity lead/liquid-argon (LAr) sampling electromagnetic calorimeter covers the region |η| < 3.2. The regions |η| < 1.37 and 1.5 < |η| < 1.8 are instrumented with presamplers in front of the LAr calorimeter in the same cryostat. A steel/scintillator-tile calorimeter (Tile) provides hadronic coverage in the central pseudorapidity range |η| < 1.7. LAr technology is also used for the hadronic calorimeters in the endcap region 1.5 < |η| < 3.2 and for electromagnetic and hadronic energy measurements in the forward calorimeters covering 3.2 < |η| < 4.9.
The MS surrounds the calorimeters. It consists of three large superconducting air-core toroidal magnets, precision tracking chambers providing precise muon tracking out to |η| = 2.7, and fast detectors for triggering in the region |η| < 2.4.
A two-level trigger system is used to select events [5]. A low-level hardware trigger reduces the data rate, and a high-level software trigger selects events with interesting final states. More details of the ATLAS detector can be found in Ref. [1].
3 E
Tmissreconstruction
The reconstructed ETmiss in ATLAS is characterised by two contributions. The first one is from the hard-event signals comprising fully reconstructed and calibrated particles and jets (hard objects). The reconstructed particles are electrons, photons, τ-leptons, and muons. While muons are reconstructed from ID and MS tracks, electrons and τ-leptons are identified combining calorimeter signals with tracking information. Photons and jets are principally reconstructed from calorimeter signals, with possible signal refinements from reconstructed tracks. The second contribution to ETmiss is from the soft-event signals consisting of reconstructed charged-particle tracks (soft signals) associated with the hard-scatter vertex defined in AppendixAbut not with the hard objects.
ATLAS carries out a dedicated reconstruction procedure for each kind of particle as well as for jets, casting a particle or jet hypothesis on the origin of (a group of) detector signals. These procedures are independent of one another. This means that e.g. the same calorimeter signal used to reconstruct an electron is likely also used to reconstruct a jet, thus potentially introducing double counting of the same signal when reconstructing ETmiss. This issue is addressed by the explicit signal ambiguity resolution in the object-based ETmissreconstruction originally introduced in Refs. [2] and [3], and by its 2015 implementation described in Sections3.1and3.2.
Additional options for the set of signals used to reconstruct ETmiss are available and discussed in detail in Section8. One of these alternative options is the calorimeter-based ETmiss reconstruction discussed in Section8.1, which uses a soft event built from clusters of topologically connected calorimeter cells (topo-clusters) [6]. Another option is the track-based missing transverse momentum, which differs from Emiss
T only in the use of tracks in place of jets. It is described in more detail in Section8.2.
3.1 ETmissbasics
The missing transverse momentum reconstruction provides a set of observables constructed from the components px(y) of the transverse momentum vectors (pT) of the various contributions. The missing
transverse momentum components Ex(y)missserve as the basic input for most of these observables. They are given by Emiss x(y) = − Õ i ∈ {hard objects} px(y),i − Õ j ∈ {soft signals} px(y), j. (1)
The set of observables constructed from Ex(y)missis Emiss T = (E miss x , Eymiss), (2) Emiss T = |E miss T | = q (Emiss x )2+ (Eymiss)2, (3)
φmiss= tan−1(Emiss
y /Exmiss). (4)
The vector EmissT provides the amount of the missing transverse momentum via its magnitude ETmiss, and its direction in the transverse plane in terms of the azimuthal angle φmiss. Consequently, ETmissis non-negative by definition. However, in an experimental environment where not all relevant pT from the hard-scatter
interaction can be reconstructed and used in Eq. (1), and the reconstructed pT from each contribution
is affected by the limited resolution of the detector, an observation bias towards non-vanishing values for ETmissis introduced even for final states without genuine missing transverse momentum generated by undetectable particles.
The scalar sum of all transverse momenta (pT= |pT|) from the objects contributing to ETmissreconstruction
is given by ΣET = Õ i ∈ {hard objects} pT,i+ Õ j ∈ {soft signals} pT, j. (5)
In the context of ETmissreconstruction, ΣET is calculated in addition to the sum given in Eq. (1), and the
derived quantities defining ETmiss given in Eqs. (2) to (4). It provides a useful overall scale for evaluating the hardness of the hard-scatter event in the transverse plane, and thus provides a measure for the event activity in physics analyses and ETmissreconstruction performance studies.
In the calculation of Ex(y)miss and ΣET the contributing objects need to be reconstructed from mutually
exclusive detector signals. This rule avoids multiple inclusions of the same signal in all constructed observables. The implementation of this rule in terms of the signal ambiguity resolution requires the definition of a sequence for selected contributions, in addition to a rejection mechanism based on common signal usage between different objects. Similarly to the analysis presented in Ref. [3], the most commonly used order for the ETmissreconstruction sequence for the hard-object contribution starts with electrons (e), followed by photons (γ), then hadronically decaying τ-leptons (τhad), and finally jets. Muons (µ) are
principally reconstructed from ID and MS tracks alone, with corrections based on their energy loss in the calorimeter, leading to little or no signal overlap with the other reconstructed particles in the calorimeter. In the sequence discussed here, all electrons passing the selection enter the ETmissreconstruction first. The lower-priority reconstructed particles (γ, τhad) are fully rejected if they share their calorimeter signal with
a higher-priority object that has already entered the ETmissreconstruction. Muons experience energy loss in the calorimeters, but only non-isolated muons overlap with other hard objects, most likely jets or τ-leptons. In this case the muon’s energy deposit in the calorimeter cannot be separated from the overlapping jet-like objects with the required precision, and the calorimeter-signal-overlap resolution based on the shared use of topo-clusters cannot be applied. A discussion of the treatment of isolated and non-isolated muons is given in Section3.3.4.
Generally, jets are rejected if they overlap with accepted higher-priority particles. To avoid signal losses for ETmissreconstruction in the case of partial or marginal overlap, and to suppress the accidental inclusion of jets reconstructed from calorimeter signals from large muon energy losses or pile-up, the more refined overlap resolution strategies described in Sections3.3.5and3.3.6are applied.
Excluding ID tracks associated with any of the accepted hard objects contributing to ETmiss, ID tracks from the hard-scatter collision vertex are used to construct the soft-event signal for the results presented in this paper.
3.2 ETmissterms
Particle and jet selections in a given analysis should be reflected in ETmiss and ΣET for a consistent
interpretation of a given event. Each reconstructed particle and jet has its own dedicated calibration translating the detector signals into a fully corrected four-momentum. This means that e.g. rejecting certain electrons in a given analysis can change both ETmiss and ΣET, if the corresponding calorimeter
signal is included and calibrated as a jet or a significant part of a jet. This also means that systematic uncertainties for the different particles can be consistently propagated to ETmiss. The applied selections are presented in Section3.3, and summarised in Table1.
In ATLAS the flexibility needed to recalculate ETmissand ΣET under changing analysis requirements for
the same event is implemented using dedicated variables corresponding to specific object contributions. In this approach the full EmissT is the vectorial sum of missing transverse momentum terms Emiss, pT , with p ∈ {e, γ, τhad, µ, jet} reconstructed from the pT = (px, py) of accepted particles and jets, and the
corresponding soft term Emiss,softT from the soft-event signals introduced in Section3.1and further specified in Section3.4. This yields2
Emiss T = − Õ selected electrons pe T Emiss, e T − Õ accepted photons pγ T Emiss,γ T − Õ accepted τ-leptons pτhad T Emiss, τhad T − Õ selected muons pµ T Emiss, µ T − Õ accepted jets pjet T Emiss, jet T hard term − Õ unused tracks ptrack T Emiss, soft T soft term . (6)
The ETmiss and φmiss observables can be constructed according to Eqs. (3) and (4), respectively, for the overall missing transverse momentum (from EmissT ) as well as for each individual term indicated in Eq. (6). In the priority-ordered reconstruction sequence for ETmiss, contributions are defined by a combination of analysis-dependent selections and a possible rejection due to the applied signal ambiguity resolution. The muon and electron contributions are typically not subjected to the signal overlap resolution and are thus exclusively defined by the selection requirements. Unused tracks in Eq. (6) refers to those tracks associated with the hard-scatter vertex but not with any hard object. Neutral particle signals from the calorimeter suffer from significant contributions from pile-up and are not included in the soft term.
2In this formula the notion of selected, which is only applicable to electrons and muons, means that the choice of reconstructed particles is purely given by a set of criteria similar to those given in Sections3.3.1and 3.3.4, respectively, with possible modifications imposed by a given analysis. The notion of accepted indicates a modification of the set of initially selected objects imposed by the signal ambiguity resolution.
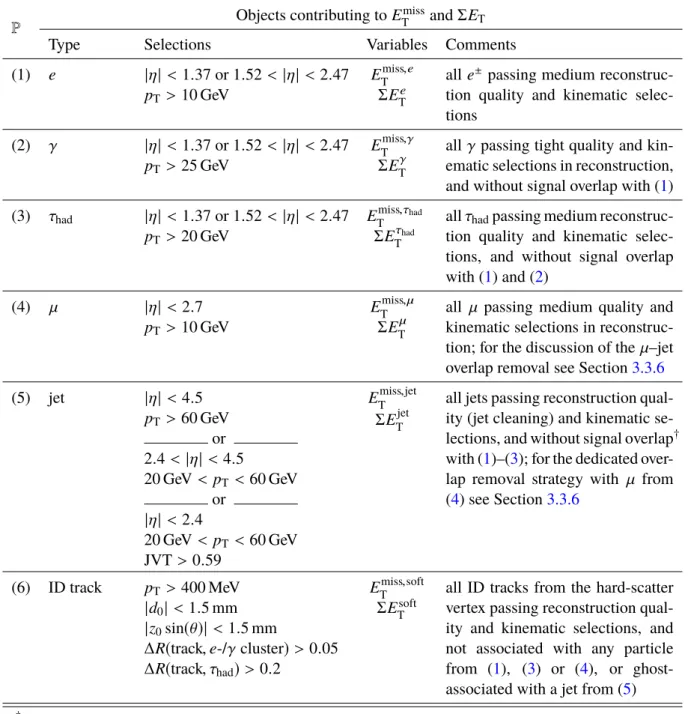
Table 1: Overview of the contributions to ETmiss and ΣET from hard objects such as electrons (e), photons (γ), hadronically decaying τ-leptons (τhad), muons (µ), and jets, together with the signals for the soft term. The configuration shown is the one used as reference for the performance evaluations presented in this paper. The table is ordered descending in priority P of consideration for ETmissreconstruction, with (1) being the first and (5) being the last calculated hard-object contribution. The soft-event contribution is constructed at the lowest priority (6), after all hard objects are considered. The transverse (longitudinal) impact parameter d0(z0sin(θ)) used to select the ID tracks contributing to ETmiss,softand ΣETsoft in P = (6) is measured relative to the hard-scatter vertex. All variables
are explained in Section3.2. The angular distance ∆R between objects is defined as ∆R =p(∆η)2+ (∆φ)2.
P Objects contributing to E
miss
T and ΣET
Type Selections Variables Comments
(1) e |η| < 1.37 or 1.52 < |η| < 2.47 pT > 10 GeV Emiss,e T ΣEe T
all e± passing medium reconstruc-tion quality and kinematic selec-tions (2) γ |η| < 1.37 or 1.52 < |η| < 2.47 pT > 25 GeV Emiss,γ T ΣEγ T
all γ passing tight quality and kin-ematic selections in reconstruction, and without signal overlap with (1) (3) τhad |η| < 1.37 or 1.52 < |η| < 2.47 pT > 20 GeV Emiss,τhad T ΣEτhad T
all τhadpassing medium
reconstruc-tion quality and kinematic selec-tions, and without signal overlap with (1) and (2) (4) µ |η| < 2.7 pT > 10 GeV Emiss,µ T ΣEµ T
all µ passing medium quality and kinematic selections in reconstruc-tion; for the discussion of the µ–jet overlap removal see Section3.3.6
(5) jet |η| < 4.5 pT > 60 GeV or 2.4 < |η| < 4.5 20 GeV < pT < 60 GeV or |η| < 2.4 20 GeV < pT < 60 GeV JVT > 0.59 Emiss,jet T ΣEjet T
all jets passing reconstruction qual-ity (jet cleaning) and kinematic se-lections, and without signal overlap† with (1)–(3); for the dedicated over-lap removal strategy with µ from (4) see Section3.3.6
(6) ID track pT > 400 MeV
|d0| < 1.5 mm |z0sin(θ)| < 1.5 mm
∆R(track, e-/γ cluster) > 0.05 ∆R(track, τhad)> 0.2
Emiss,soft T
ΣEsoft T
all ID tracks from the hard-scatter vertex passing reconstruction qual-ity and kinematic selections, and not associated with any particle from (1), (3) or (4), or ghost-associated with a jet from (5)
†
While for single reconstructed particles no overlap is accepted at all, jets with a signal overlap fraction κE < 50% can still contribute their associated tracks to ETmiss,softif those pass the selections for P = (6), as discussed in Section3.3.5. The definition of κEis given in Eq. (8).
Correspondingly, ΣET is calculated from the scalar sums of the transverse momenta of hard objects
entering the ETmissreconstruction and the soft term, ΣET= Õ selected electrons pe T+ Õ accepted photons pγ T+ Õ accepted τ-leptons pτhad T + Õ selected muons pµ T+ Õ accepted jets pjet T hard term + Õ unused tracks ptrack T soft term . (7)
The hard term in both ETmiss and ΣET is characterised by little dependence on pile-up, as it includes
only fully calibrated objects, where the calibration includes a pile-up correction and objects tagged as originating from pile-up are removed. The particular choice of using only tracks from the hard-scatter vertex for the soft term strongly suppresses pile-up contributions to this term as well. The observed residual pile-up dependencies are discussed with the performance results shown in Section6.
3.3 Object selection
The following selections are applied to reconstructed particles and jets used for the performance evaluations presented in Sections6 to 8. Generally, these selections require refinements to achieve optimal ETmiss reconstruction performance in the context of a given physics analysis, and the selections performed in this study are an example set of criteria.
3.3.1 Electron selection
Reconstructed electrons are selected on the basis of their shower shapes in the calorimeter and how well their calorimeter cell clusters are matched to ID tracks [7]. Both are evaluated in a combined likelihood-based approach [8]. Electrons with at least medium reconstruction quality are selected. They are calibrated using the default calibration given in Ref. [7]. To be considered for ETmissreconstruction, electrons passing the reconstruction quality requirements are in addition required to have pT > 10 GeV and |η| < 1.37
or 1.52 < |η| < 2.47, to avoid the transition region between the central and endcap electromagnetic calorimeters. Any energy deposit by electrons within 1.37 < |η| < 1.52 is likely reconstructed as a jet and enters the ETmissreconstruction as such, if this jet meets the corresponding selection criteria discussed in Section3.3.5.
3.3.2 Photon selection
The identification and reconstruction of photons exploits the distinctive evolution of their electromagnetic showers in the calorimeters [9]. Photons are selected and calibrated using the tight selection criteria given in Ref. [7]. In addition to the reconstruction quality requirements, photons must have pT > 25 GeV and
|η| < 1.37 or 1.52 < |η| < 2.37 to be included in the Emiss
T reconstruction. Similarly to electrons, photons
3.3.3 τ-lepton selection
Hadronically decaying τ-leptons are reconstructed from narrow jets with low associated track multipli-cities [10]. Candidates must pass the medium quality selection given in Ref. [11], and in addition have pT > 20 GeV and |η| < 1.37 or 1.52 < |η| < 2.47. Any τ-lepton not satisfying these τ-identification criteria may contribute to ETmisswhen passing the jet selection.
3.3.4 Muon selection
Muons are reconstructed within |η| < 2.5 employing a combined MS and ID track fit. Outside of the ID coverage, muons are reconstructed within 2.5 < |η| < 2.7 from a track fit to MS track segments alone. Muons are further selected for ETmissreconstruction by requiring the medium reconstruction quality defined in Ref. [12], pT > 10 GeV, and an association with the hard-scatter vertex for those within |η| < 2.5.
3.3.5 Jet selection
Jets are reconstructed from clusters of topologically connected calorimeter cells (topo-clusters), described in Ref. [6]. The topo-clusters are calibrated at the electromagnetic (EM) energy scale.3 The anti-kt
algorithm [13], as provided by the FastJet toolkit [14], is employed with a radius parameter R = 0.4 to form jets from these topo-clusters. The jets are fully calibrated using the EM+JES scheme [15] including a correction for pile-up [16]. They are required to have pT > 20 GeV after the full calibration. The jet
contribution to ETmissand ΣETis primarily defined by the signal ambiguity resolution.
Jets not rejected at that stage are further filtered using a tagging algorithm to select hard-scatter jets (“jet vertex tagging”) [16]. This algorithm provides the jet vertex tagger variable JVT, ranging from 0 (pile-up-like) to 1 (hard-scatter-like), for each jet with matched tracks.4 The matching of tracks with jets is done by ghost association, where tracks are clustered as ghost particles into the jet, as described in Ref. [3] and based on the approach outlined in Ref. [17].
The overlap resolution can result in a partial overlap of the jet with an electron or photon, in terms of the fraction of common signals contributing to the respective reconstructed energy. This is measured by the ratio κE of the electron(photon) energy Ee(γ)EM to the jet energy EjetEM,
κE = EEM e(γ) EEM jet , (8)
with both energies calibrated at the EM scale. In the case of κE ≤ 50%, the jet is included in ETmiss
reconstruction, with its pT scaled by 1 − κE. For κE > 50%, only the tracks associated with the jet,
excluding the track(s) associated with the overlapping particle if any, contribute to the soft term as discussed in Section3.4.
Jets not rejected by the signal ambiguity resolution and with pT > 20 GeV and |η| > 2.4, or with
pT ≥ 60 GeV and |η| < 4.5, are always accepted for Emiss
T reconstruction. Jets reconstructed with 3On this scale the energy deposited in the calorimeter by electrons and photons is represented well. The hadron signal at the
EM scale is not corrected for the non-compensating signal features of the ATLAS calorimeters. 4In the calculation of JVT the total amount of p
Tcarried by tracks from the hard-scatter vertex matched to the given jet is related to the total amount of pTcarried by all matched tracks, among other inputs, to tag jets from the hard-scatter interaction.
20 GeV < pT < 60 GeV and |η| < 2.4 are only accepted if they are tagged by JVT > 0.59. In both cases,
the jet pTthresholds are applied to the jet pTbefore applying the κE correction. Additional configurations
for selecting jets used in ETmissreconstruction are discussed in AppendixC, together with the effect of the variation of these selection criteria on the ETmissreconstruction performance.
3.3.6 Muon overlap with jets
Jets overlapping with a reconstructed muon affect the ETmiss reconstruction in a manner that depends on their origin. If these jets represent a significant (catastrophic) energy loss along the path of the muon through the calorimeter, or if they are pile-up jets tagged by JVT as originating from the hard-scatter interaction due to the muon ID track, they need to be rejected for ETmiss reconstruction. On the other hand, jets reconstructed from final state radiation (FSR) off the muon need to be included into ETmiss reconstruction.
In all cases, the muon–jet overlap is determined by ghost-associating the muon with the jet. For this, each muon enters the jet clustering as ghost particle with infinitesimal small momentum, together with the EM-scale topo-clusters from the calorimeter. If a given ghost particle becomes part of a jet, the corresponding muon is considered overlapping with this jet. This procedure is very similar to the track associations with jets mentioned in Section3.3.5.
Tagging jets using JVT efficiently retains those from the hard-scatter vertex for ETmissreconstruction and rejects jets generated by pile-up. A muon overlapping with a pile-up jet can lead to a mis-tag, because the ID track from the muon represents a significant amount of pT from the hard-scatter vertex and thus
increases JVT. As a consequence of this fake tag, the pile-up jet pTcontributes to ETmiss, and thus degrades
both the ETmissresponse and resolution due to the stochastic nature of its contribution.
A jet that is reconstructed from a catastrophic energy loss of a muon tends to be tagged as a hard-scatter jet as well. This jet is reconstructed from topo-clusters in close proximity to the extrapolated trajectory of the ID track associated with the muon bend in the axial magnetic field. Inclusion of such a jet into ETmiss reconstruction leads to double-counting of the transverse momentum associated with the muon energy loss, as the fully reconstructed muon pTis already corrected for this effect.
To reject contributions from pile-up jets and jets reconstructed from muon energy loss, the following selection criteria are applied:
• pT,trackµ /pjetT,track > 0.8 – the transverse momentum of the ID track associated with the muon (pµT,track) represents a significant fraction of the transverse momentum pjetT,track, the sum of the transverse momenta of all ID tracks associated with the jet;
• pjetT /pµT,track < 2 – the overall transverse momentum pjetT of the jet is not too large compared to pµ
T,track;
• NtrackPV < 5 – the total number of tracks NtrackPV associated with the jet and emerging from the hard-scatter vertex is small.
All jets with overlapping muons meeting these criteria are understood to be either from pile-up or a catastrophic muon energy loss and are rejected for ETmiss reconstruction. The muons are retained for the Emiss
Another consideration for muon contributions to ETmissis FSR. Muons can radiate hard photons at small angles, which are typically not reconstructed as such because of the nearby muon ID track violating photon isolation requirements. They are also not reconstructed as electrons, due to the mismatch between the ID track momentum and the energy measured by the calorimeter. Most likely the calorimeter signal generated by the FSR photon is reconstructed as a jet, with the muon ID track associated. As the transverse momentum carried by the FSR photon is not recovered in muon reconstruction, jets representing this photon need to be included in the ETmissreconstruction. Such jets are characterised by the following selections, which are highly indicative of a photon in the ATLAS calorimeter:
• NtrackPV < 3 – the jet has low charged-particle content, indicated by a very small number of tracks from the hard-scatter vertex;
• fEMC > 0.9 – the jet energy Ejetis largely deposited in the electromagnetic calorimeter (EMC), as
expected for photons and measured by the corresponding energy fraction fEMC= EEMCjet /Ejet;
• pjetT,PS > 2.5 GeV – the transverse momentum contribution pjetT,PS from presampler signals to pjetT indicates an early starting point for the shower;
• wjet< 0.1 – the jet is narrow, with a width wjetcomparable to a dense electromagnetic shower; wjet
is reconstructed according to wjet= Í i∆RipT,i Í ipT,i , where ∆Ri = p
(∆ηi)2+ (∆φi)2is the angular distance of topo-cluster i from the jet axis, and pT,i is
the transverse momentum of this cluster;
• pjetT,track/pµT,track > 0.8 – the transverse momentum pjetT,track carried by all tracks associated with the jet is close to pT,trackµ .
Jets are accepted for ETmissreconstruction when consistent with an FSR photon defined by the ensemble of these selection criteria, with their energy scale set to the EM scale, to improve the calibration.
3.4 ETmisssoft term
The soft term introduced in Section3.2is exclusively reconstructed from ID tracks from the hard-scatter vertex, thus only using the pT-flow from soft charged particles. It is an important contribution to ETmiss
for the improvement of both the ETmiss scale and resolution, in particular in final states with a low hard-object multiplicity. In this case it is indicative of (hadronic) recoil, comprising the event components not otherwise represented by reconstructed and calibrated particles or jets.
The more inclusive reconstruction of the ETmisssoft term including signals from soft neutral particles uses calorimeter topo-clusters. The reconstruction performance using the calorimeter-based ETmiss,soft,calo is inferior to the track-only-based ETmiss,soft, mostly due to a larger residual dependence on pile-up. More details of the topo-cluster-based ETmiss,soft,caloreconstruction are discussed in Section8.1.
3.4.1 Track and vertex selection
Hits in the ID are used to reconstruct tracks pointing to a particular collision vertex [18]. Both the tracks and vertices need to pass basic quality requirements to be accepted. Each event typically has a number NPV > 1 of reconstructed primary vertices.
Tracks are required to have pT > 400 MeV and |η| < 2.5, in addition to the reconstruction quality
requirements given in Ref. [19]. Vertices are constructed from at least two tracks passing selections on the transverse (longitudinal) impact parameter |d0| < 1.5 mm (|z0sin(θ)| < 1.5 mm) relative to the vertex
candidate. These tracks must also pass requirements on the number of hits in the ID. The hard-scatter vertex is identified as described in AppendixA.
3.4.2 Track soft term
The track sample contributing to ETmiss,soft for each reconstructed event is collected from high-quality tracks emerging from the hard-scatter vertex but not associated with any electron, τ-lepton, muon, or jet contributing to ETmissreconstruction. The applied signal-overlap resolution removes
• ID tracks with ∆R(track,electron/photon cluster) < 0.05; • ID tracks with ∆R(track,τ-lepton) < 0.2;
• ID tracks associated with muons;
• ID tracks ghost–associated with fully or partially contributing jets.
ID tracks from the hard-scatter vertex that are associated with jets rejected by the overlap removal or are associated with jets that are likely from pile-up, as tagged by the JVT procedure discussed in Section3.3.5, contribute to ETmiss,soft.
Since only reconstructed tracks associated with the hard-scatter vertex are used, the track-based ETmiss,soft is largely insensitive to pile-up effects. It does not include contributions from any soft neutral particles, including those produced by the hard-scatter interaction.
4 Data and simulation samples
The determination of the ETmissreconstruction performance uses selected final states without (ETmiss,true= 0) and with genuine missing transverse momentum from neutrinos (ETmiss,true = pνT). Samples with Emiss,true
T = 0 are composed of leptonic Z boson decays (Z → ee and Z → µµ) collected by a trigger
and event selection that do not depend on the particular pile-up conditions, since both the electron and muon triggers as well as the corresponding reconstructed kinematic variables are only negligibly affected by pile-up. Also using lepton triggers, samples with neutrinos were collected from W → eν and W → µν decays. In addition, samples with neutrinos and higher hard-object multiplicity were collected from top-quark pair (t ¯t ) production with at least either the t or the ¯t decaying semi-leptonically.
4.1 Data samples
The data sample used corresponds to a total integrated luminosity of 3.2 fb−1, collected with a proton bunch-crossing interval of 25 ns. Only high-quality data with a well-functioning calorimeter, inner detector and muon spectrometer are analysed. The data-quality criteria are applied, which reduce the impact of instrumental noise and out-of-time calorimeter deposits from cosmic-ray and beam backgrounds.
4.2 Monte Carlo samples
The Z → `` and W → `ν samples were generated using Powheg-Box [20] (version v1r2856) employing a matrix element calculation at next-to-leading order (NLO) in perturbative QCD. To generate the particle final state, the (parton-level) matrix element output was interfaced to Pythia8 [21],5which generated the parton shower (PS) and the underlying event (UE) using the AZNLO tuned parameter set [22]. Parton distribution functions (PDFs) were taken from the CTEQ6L1 PDF set [23].
The t ¯t-production sample was generated with a Powheg NLO kernel (version v2r3026) interfaced to Pythia6 [24] (version 6.428) with the Perugia2012 set of tuned parameters [25] for the PS and UE generation. The CT10 NLO PDF set [26] was employed. The resummation of soft-gluon terms in the next-to-next-to-leading-logarithmic (NNLL) approximation with top++ 2.0 [27] was included.
Additional processes contributing to the Z → `` and W → `ν final state samples are the production of dibosons, single top quarks, and multijets. Dibosons were generated using Sherpa [28–31] version v2.1.1 employing the CT10 PDF set. Single top quarks were generated using Powheg version v1r2556 with the CT10 PDF set for the t-channel production and Powheg version v1r2819 for the s-channel and the associated top quark (W t) production, all interfaced to the PS and UE from the same Pythia6 configuration used for t ¯t production. Multijet events were generated using Pythia8 with the NNPDF23LO PDF set [32] and the A14 set of tuned PS and UE parameters described in Ref. [33].
Minimum bias (MB) events were generated using Pythia8 with the MSTW2008LO PDF set [34] and the A2 tuned parameter set [35] for PS and UE. These MB events were used to model pile-up, as discussed in Section4.3.
For the determination of the systematic uncertainties in ETmiss reconstruction, an alternative inclusive sample of Z → µµ events was generated using the MadGraph_aMC@NLO (version v2.2.2) matrix element generator [36] employing the CTEQ6L1 PDF set. Both PS and UE were generated using Pythia8 with the NNPDF23LO PDF set and the A14 set of tuned parameters.
The MC-generated events were processed with the Geant4 software toolkit [37], which simulates the propagation of the generated stable particles6through the ATLAS detector and their interactions with the detector material [38].
5Version 8.186 was used for all final states generated with Pythia8.
4.3 Pile-up
The calorimeter signals are affected by pile-up and the short bunch-crossing period at the LHC. In 2015, an average of about 13 pile-up collisions per bunch crossing was observed. The dominant contribution of the additional pp collisions to the detector signals of the recorded event arises from a diffuse emission of soft particles superimposed to the hard-scatter interaction final state (in-time pile-up). In addition, the LAr calorimeter signals are sensitive to signal remnants from up to 24 previous bunch crossings and one following bunch crossing (out-of-time pile-up), as discussed in Refs. [6,39]. Both types of pile-up affect signals contributing to ETmiss.
The in-time pile-up activity is measured by the number of reconstructed primary collision vertices NPV.
The out-of-time pile-up is proportional to the number of collisions per bunch crossing µ, measured as an average over time periods of up to two minutes by integrated signals from the luminosity detectors in ATLAS [40].
To model in-time pile-up in MC simulations, a number of generated pile-up collisions was drawn from a Poisson distribution around the value of µ recorded in data. The collisions were randomly collected from the MB sample discussed in Section4.2. The particles emerging from them were overlaid onto the particle-level final state of the generated hard-scatter interaction and converted into detector signals before event reconstruction. The event reconstruction then proceeds as for data.
Similar to the LHC proton-beam structure, events in MC simulations are organised in bunch trains, where the structure in terms of bunch-crossing interval and gaps between trains is taken into account to model the effects of out-of-time pile-up. The fully reconstructed events in MC simulation samples are finally weighted such that the distribution of the number of overlaid collisions over the whole sample corresponds to the µ distribution observed in data.
The effect of pile-up on the signal in the Tile calorimeter is reduced due to its location behind the electromagnetic calorimeter and its fast time response [41]. Reconstructed ID and MS tracks are largely unaffected by pile-up.
5 Event selection
5.1 Z →µµ event selection
The Z → µµ final state is ideal for the evaluation of ETmiss reconstruction performance, since it can be selected with a high signal-to-background ratio and the Z kinematics can be measured with high precision, even in the presence of pile-up. Neutrinos are produced only through very rare heavy-flavour decays in the hadronic recoil. This channel can therefore be considered to have no genuine missing transverse momentum. Thus, the scale and resolution for the reconstructed ETmissare indicative of the reconstruction quality and reflect limitations introduced by both the detector and the ambiguity resolution procedure. The well-defined expectation value ETmiss,true = 0 allows the reconstruction quality to be determined in both data and MC simulations. The reconstructed ETmissin this final state is also sensitive to the effectiveness of the muon–jet overlap resolution, which can be explored in this low-multiplicity environment in both data and MC simulations, with a well-defined ETmiss.
Events must pass one of three high-level muon triggers with different pµTthresholds and isolation require-ments. The isolation is determined by the ratio of the scalar sum of pTof reconstructed tracks other than
the muon track itself, in a cone of size ∆R = 0.2 around the muon track (pconeT ), to pTµ. The individual triggers require (1) pµT > 20 GeV and pconeT /pTµ < 0.12, or (2) pµT > 24 GeV and pconeT /pµT < 0.06, or (3) pµ
T > 50 GeV without isolation requirement.
The offline selection of Z → µµ events requires exactly two muons, each selected as defined in Sec-tion3.3.4, with the additional criteria that (1) the muons must have opposite charge, (2) pµT > 25 GeV, and (3) the reconstructed invariant mass mµµ of the dimuon system is consistent with the mass mZ of the Z boson, |mµµ− mZ| < 25 GeV.
5.2 W → eν event selection
Events with W → eν or W → µν in the final state provide a well-defined topology with neutrinos produced in the hard-scatter interaction. In combination with Z → µµ, the effectiveness of signal ambiguity resolution and lepton energy reconstruction for both the electrons and muons can be observed. The W → eν events in particular provide a good metric with ETmiss,true = pνT > 0 to evaluate and validate the scale, resolution and direction (azimuth) of the reconstructed ETmiss, as the ETmissreconstruction is sensitive to the electron–jet overlap resolution performance. This metric is only available in MC simulations where pνT is known. Candidate W → eν events are required to pass the high-level electron trigger with pT > 17 GeV. Electron candidates are selected according to criteria described in Section 3.3.1. Only events containing exactly one electron are considered.
Further selections using ETmissand the reconstructed transverse mass mT, given by
mT = q
2peTETmiss(1 − cos ∆φ) ,
are applied to reduce the multijet background with one jet emulating an isolated electron from the W boson. Here ETmissis calculated as presented in Section3. The transverse momentum of the electron is denoted by peT, and ∆φ is the distance between φmissand the azimuth of the electron. Selected events are required to have ETmiss> 25 GeV and mT> 50 GeV.
5.3 t ¯t event selection
Events with t ¯t in the final state allow the evaluation of the ETmissperformance in interactions with a large jet multiplicity. Electrons and muons used to define these samples are reconstructed as discussed in Section3.3.1and Section3.3.4, respectively, and are required to have pT> 25 GeV.
The final t ¯t sample is selected by imposing additional requirements. Each event must have exactly one electron and no muons passing the selections described above. In addition, at least four jets reconstructed by the anti-kt algorithm with R = 0.4 and selected following the description in Section3.3.5are required. At least one of the jets needs to be b-tagged using the tagger configuration for a 77% efficiency working point described in Ref. [42]. All jets are required to be at an angular distance of ∆R > 0.4 from the electron.
6 Performance of E
Tmissreconstruction in data and Monte Carlo simulation
Unlike for fully reconstructed and calibrated particles and jets, and in the case of the precise reconstruction of charged particle kinematics provided by ID tracks, ETmissreconstruction yields a non-linear response, especially in regions of phase space where the observation bias discussed in Section 3.1 dominates the reconstructed ETmiss. In addition, the ETmiss resolution functions are characterised by a high level of complexity, due to the composite character of the observable. Objects with different pT-resolutions
contribute, and the ETmisscomposition can fluctuate significantly for events from the same final state. Due to the dependence of the ETmissresponse on the resolution, both performance characteristics change as a function of the total event activity and are affected by pile-up. There is no universal way of mitigating these effects, due to the inability to validate in data a stable and universal calibration reference for ETmiss. The ETmiss reconstruction performance is therefore assessed by comparing a set of reconstructed ETmiss -related observables in data and MC simulations for the same final-state selection, with the same object and event selections applied. Systematic uncertainties in the ETmiss response and resolution are derived from these comparisons and are used to quantify the level of understanding of the data from the physics models. The quality of the detector simulation is independently determined for all reconstructed jets, particles and ID tracks, and can thus be propagated to the overall ETmissuncertainty for any given event. Both the distributions of observables as well as their average behaviour with respect to relevant scales measuring the overall kinematic activity of the hard-scatter event or the pile-up activity are compared. To focus on distribution shapes rather than statistical differences in these comparisons, the overall distribution of a given observable obtained from MC simulations is normalised to the integral of the corresponding distribution in data.
As the reconstructed final state can be produced by different physics processes, the individual process contributions in MC simulations are scaled according to the cross section of the process. This approach is taken to both show the contribution of a given process to the overall distribution, and to identify possible inadequate modelling arising from any individual process, or a subset of processes, by its effect on the overall shape of the MC distribution.
Inclusive event samples considered for the ETmiss performance evaluation are obtained by applying se-lections according to Section 5.1 for a final state without genuine ETmiss (Z → µµ), and according to Section5.2 for a final state with genuine ETmiss (W → eν). From these, specific exclusive samples are extracted by applying conditions on the number of jets reconstructed. In particular, zero jet (Njet = 0)
samples without any jet with pT > 20 GeV (fully calibrated) and |η| < 4.9 are useful for exclusively
studying the performance of the soft term. Samples with events selected on the basis of a non-zero number of reconstructed jets with pT > 20 GeV are useful for evaluating the contribution of jets to ETmiss.
While the pT response of jets is fully calibrated and provides a better measurement of the overall event
pT-flow, the pT resolution for jets is affected by pile-up and can introduce a detrimental effect on Emiss T
reconstruction performance.
Missing transverse momentum and its related observables presented in Section3.1are reconstructed for the performance evaluations shown in the following sections using a standard reconstruction configuration. This configuration implements the signal ambiguity resolution in the ETmiss reconstruction sequence discussed in Section3.1. It employs the hard-object selections defined in Sections3.3.1to3.3.4, with jets selected according to the prescriptions given in Section3.3.5. The overlap resolution strategy for jets and muons described in Section3.3.6is applied. The soft term is formed from ID tracks according to Section3.4.
(a) (b)
(c) (d)
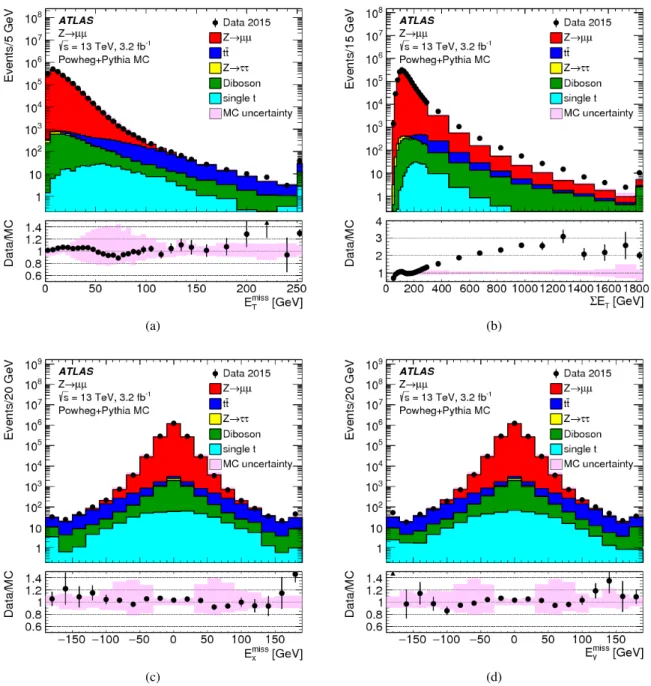
Figure 1: Distributions of(a)ETmiss, (b)ΣET,(c)Exmiss and(d) Eymiss for an inclusive sample of Z → µµ events extracted from data and compared to MC simulations including all relevant backgrounds. The shaded areas indicate the total uncertainty for MC simulations, including the overall statistical uncertainty combined with systematic uncertainties from the pTscale and resolution which are contributed by muons, jets, and the soft term. The last bin of each distribution includes the overflow, and the first bin contains the underflow in(c)and(d). The respective ratios between data and MC simulations are shown below the distributions, with the shaded areas showing the total uncertainties for MC simulations.
6.1 ETmissmodelling in Monte Carlo simulations
The quality of the MC modelling of Exmiss, Eymiss, ETmiss and ΣET, reconstructed as given in Eqs. (1), (3)
(a) (b)
(c)
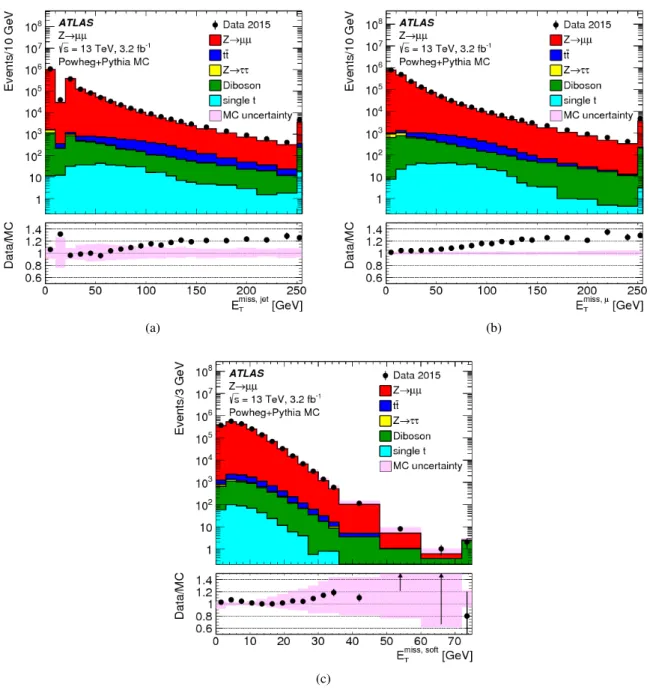
Figure 2: Distributions of(a)the jet term ETmiss,jet,(b) the muon term ETmiss,µ, and(c)the soft term ETmiss,soft for the inclusive samples of Z → µµ events in data, compared to MC simulations including all relevant backgrounds. The shaded areas indicate the total uncertainty from MC simulations, including the overall statistical uncertainty combined with the respective systematic uncertainties from(a)the jet,(b) the muon, and(c)the soft term. The last bin of each distribution includes the overflow entries. The respective ratios between data and MC simulations are shown below the distributions, with the shaded areas showing the corresponding total uncertainties from MC simulations.
observables to data. The results are presented in Fig.1. The data and MC simulations agree within 20% for the bulk of the ETmissdistribution shown in Fig.1(a), with larger differences not accommodated by the total (systematic and statistical) uncertainties of the distributions for high ETmiss. These differences suggest
a mismodelling in t ¯t events, the dominant background in the tail regime [43]. The ΣET distributions
compared between data and MC simulations in Fig.1(b)show discrepancies significantly larger than the overall uncertainties for 200 GeV < ΣET < 1.2 TeV. These reflect the level of mismodelling of the final
state mostly in terms of hard-object composition in MC simulations. The Exmissand Eymissspectra shown
in Figs.1(c)and1(d), respectively, show good agreement between data and MC simulations for the bulk of the distributions within |Ex(y)miss| < 100 GeV, with larger differences observed outside of this range still mostly within the uncertainties.
The distributions of individual contributions to ETmiss from jets (ETmiss,jet), muons (ETmiss,µ), and the soft term (ETmiss,soft), as defined in Eq. (6), are compared between data and MC simulations for the same inclusive Z → µµ sample in Fig.2. Agreement between data and MC simulations for ETmiss,jetin Fig.2(a)
is of the order of ±20% and within the total uncertainties for ETmiss,jet . 120 GeV, but beyond those for higher ETmiss,jet. A similar observation holds for ETmiss,µ in Fig. 2(b), where data and MC simulations agree within the uncertainties for low ETmiss,µbut significantly beyond them for larger ETmiss,µ. Agreement between data and MC simulations is better for the soft term ETmiss,soft, with differences up to 10% for Emiss,soft
T . 30 GeV, as seen in Fig.2(c). Larger differences for larger E miss,soft
T are still found to be within
the uncertainties.
The peak around ETmiss,jet = 20 GeV indicates the onset of single-jet events at the threshold pT = 20 GeV
for jets contributing to ETmiss,jet. Larger values of ETmiss,jetarise from events with one or more high-pTjets
balancing the pTof the Z boson.
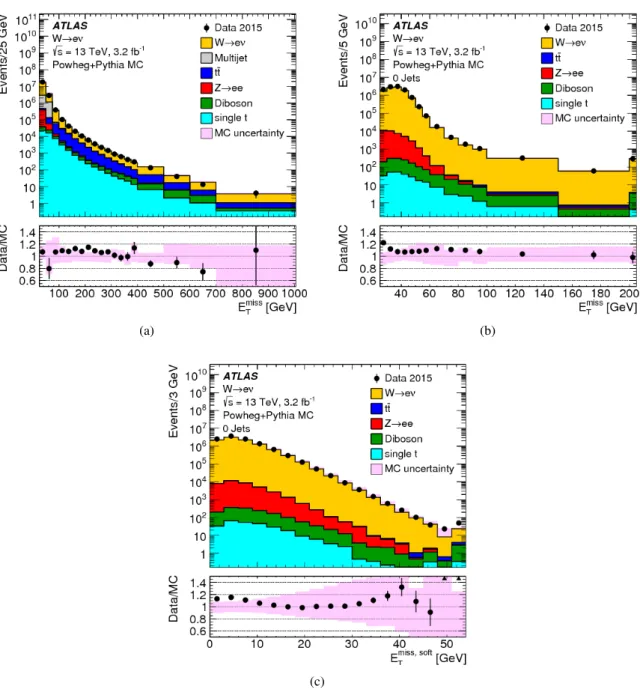
For the W → eν sample with genuine missing transverse momentum given by pνT, both the total recon-structed ETmiss and the soft term are compared between data and MC simulations in Fig.3. The level of agreement between the ETmiss distributions for data and MC simulations shown in Fig. 3(a) for the inclusive event sample is at ±20%, similar to that observed for the Z → µµ sample in Fig.1(a), except that for this final state it is found to be within the total uncertainties of the measurement. The differences between the ETmissdistributions observed with the exclusive Njet = 0 sample shown in Fig.3(b)are well
below 20%, but show a trend to larger discrepancies for decreasing ETmiss . 40 GeV. This trend is due to the missing background contribution in MC simulations from multijet final states. The extraction of this contribution is very inefficient and only possible with large statistical uncertainties. Even very large MC samples of multijet final states provide very few events with only one jet that is accidentally reconstructed as an electron, and with the amount of ETmissrequired in the W → eν selection described in Section5.2. The comparison of the ETmiss,soft distributions from data and MC simulations shown in Fig. 3(c)yields agreement well within the uncertainties, for ETmiss,soft & 10 GeV. The rising deficiencies observed in the MC distribution for decreasing ETmiss,soft . 10 GeV are expected to be related to the missing multijet contribution.
6.2 ETmissresponse and resolution
The response in the context of ETmissreconstruction is determined by the deviation of the observed ETmiss from the expectation value for a given final state. This deviation sets the scale for the observed ETmiss. If this deviation is independent of the genuine missing transverse momentum, or any other hard pTindicative of
the overall hard-scatter activity, the ETmissresponse is linear. In this case, a constant bias in the reconstructed Emiss
(a) (b)
(c)
Figure 3: Distributions of the total ETmissin(a)the inclusive case and(b)the Njet= 0 case, as well as(c)the soft term ETmiss,soft reconstructed in Njet = 0 events with W → eν in data. The expectation from MC simulation is superimposed and includes all relevant background final states passing the event selection. The inclusive ETmiss distribution from MC simulations contains a small contribution from multijet final states at low ETmiss, which is absent for the Njet= 0 selection. The shaded areas indicate the total uncertainty for MC simulations, including the overall statistical uncertainty combined with systematic uncertainties comprising contributions from the electron, jet, and the soft term. The last bins contain the respective overflows. The respective ratios between data and MC simulations are shown below the distributions, with the shaded areas indicating the total uncertainties for MC simulations.
Final states balanced in transverse momentum are expected to show a non-linear ETmiss response at low event activity, as the response in this case suffers from the observation bias in ETmiss reconstruction
discussed in Section3.1. With increasing momentum transfers in the hard-scatter interaction, the ETmiss response becomes increasingly dominated by a well-measured hadronic recoil and thus more linear. In the case of final states with genuine missing transverse momentum, the ETmissresponse is only linear once Emiss,true
T exceeds the observation bias. These features are discussed in Section 6.2.1and explored in
Section6.2.2.
Contributions to the fluctuations in the ETmiss measurement arise from (1) the limitations in the detector acceptance not allowing the reconstruction of the complete transverse momentum flow from the hard interaction, (2) the irreducible intrinsic signal fluctuations in the detector response, and from (3) the additional response fluctuations due to pile-up. In particular (1) introduces fluctuations driven by the large variations of the particle composition of the final state with respect to their types, momenta and directions. The limited detector coverage of |η| < 4.9 for all particles, together with the need to suppress the pile-up-induced signal fluctuations as much as possible, restricts the contribution of particles to ETmiss to the reconstructed and accepted e, γ, τhadand µ, and those being part of a reconstructed and accepted jet.
In addition, the pT-flow of not explicitly reconstructed charged particles emerging from the hard-scatter
vertex is represented by ID tracks contributing to ETmiss,softgiven in Eqs. (6) and (7), but only in the phase space defined by the selections given in Section 3.4.1. All other charged and neutral particles do not contribute to ETmissreconstruction.
Like for the ETmissresponse, resolution-related aspects of ETmiss reconstruction are understood from data-to-MC-simulations comparisons. The scales used for the corresponding evaluations are the overall event activity represented by ΣET, and the pile-up activity measured by NPV. The measurement of the ETmiss
resolution is discussed in Section6.2.3and results are presented in Section6.2.4.
6.2.1 ETmissscale determination
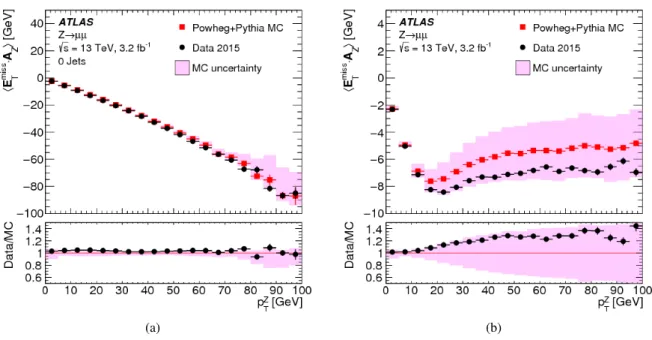
In events with Z → µµ decays, the transverse momentum of the Z boson (pZT) is an indicator of the hardness of the interaction. It provides a useful scale for the evaluation of the ETmiss response for this final state without genuine missing transverse momentum. The direction of the corresponding Z boson transverse momentum vector pTZ defines an axis AZ in the transverse plane of the collision, which is reconstructed from the pTof the decay products by
AZ = pµ+ T + p µ− T p µ+ T + p µ− T = p Z T pZ T . (9)
The magnitude of the component of EmissT parallel to AZis PkZ = Emiss
T · AZ. (10)
This projection is sensitive to any limitation in ETmiss reconstruction, in particular with respect to the contribution from the hadronic recoil against pTZ, both in terms of response and resolution. Because it can be determined both for data and MC simulations, it provides an important tool for the validation of the Emiss
T response and the associated systematic uncertainties.
The expectation value for a balanced interaction producing a Z boson against a hadronic recoil is E[PkZ]=
0. Any observed deviation from this value represents a bias in the ETmissreconstruction. For PkZ < 0, the
(a) (b)
Figure 4: The average projection of EmissT onto the direction AZof the Z boson’s transverse momentum vector pTZ, as given in Eq. (10), is shown as a function of pTZ = |pZT| in Z → µµ events from(a)the Njet= 0 sample and from(b) the inclusive sample. In both cases data are compared to MC simulations. The ratio of the averages from data and MC simulations are shown below the plots. The shaded areas indicate the overall statistical uncertainty combined with systematic uncertainties comprising contributions from the muon and soft-term systematic uncertainties in(a), and including the additional jet systematic uncertainties in(b), for MC simulations.
recoil is reconstructed. The evolution of PkZ as a function of the hardness of the Z boson production can
be measured by evaluating the mean hPkZi in bins of the hard-scatter scale phardT = p Z T.
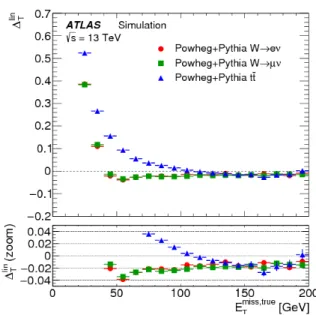
In addition to measuring the ETmissresponse in data and MC simulation without genuine ETmiss, its linearity can be determined using samples of final states with genuine ETmiss in MC simulations. This is done by evaluating the relative deviation ∆linT of the reconstructed ETmiss from the expected ETmiss,true > 0 as a function of ETmiss,true, ∆lin T (E miss,true T )= Emiss T − E miss,true T Emiss,true T . (11)
6.2.2 Measuring the EmissT response
Figure4shows hPkZi as a function of p Z
T for the Njet = 0 and the inclusive Z → µµ sample, respectively.
MC simulations compare well with the data for Njet = 0, but show larger deviations up to 30% for the
inclusive selection. Nevertheless, these differences are still found to be within the total uncertainty of the measurement.
The steep decrease of hPkZi with increasing pTZin the Njet= 0 sample seen in Fig.4(a)reflects the inherent
underestimation of the soft term, as in this case the hadronic recoil is exclusively represented by ID tracks with pT > 400 MeV within |η| < 2.5. It thus does not contain any signal from (1) neutral particles, (2)
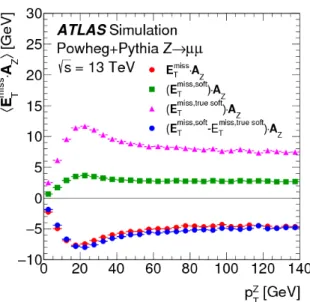
Figure 5: The average projection of EmissT onto the direction AZ of the Z boson’s transverse momentum vector pZT, as given in Eq. (10), is shown as a function of pZT = |pZT| in Z → µµ events from the inclusive MC sample. The average projection of the soft term and the true soft term are also shown, to demonstrate the source of the deviation from zero.
pTbelow threshold, rejected by the track quality requirements, or not represented by a track at all due to insuffcient signals in the ID (e.g., lack of hits for track fitting).
In the case of the inclusive sample shown in Fig. 4(b), the ETmiss response is recovered better as pZT increases, since an increasing number of events enter the sample with a reconstructed recoil containing fully calibrated jets. These provide a more complete representation of the hadronic transverse momentum flow. The residual offsets in hPkZi of about 8 GeV in data and 6 GeV in MC simulations observed for
pZ
T & 40 GeV in Fig.4(b)agree within the uncertainties of this measurement.
The persistent bias in hPkZi is further explored in Fig.5, which compares variations of hP Z
k i respectively
using the full EmissT , the soft-term contribution Emiss,softT only, the hard-term contribution EmissT − Emiss,softT , and the true soft term Emiss,true softT only, as a function of pTZ, for the Z → µµ sample from MC simulations. In particular the difference between the projections using Emiss,true softT and Emiss,softT indicates the lack of reconstructed hadronic response, when Emiss,softT = Emiss,true softT is expected for a fully measured recoil. The parallel projection using only the soft terms is larger than zero for all pTZdue to the missing Z -boson contribution to EmissT given by −pZT.
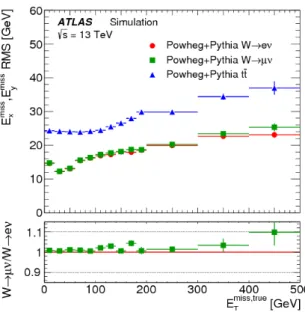
The deviation from linearity in ETmiss reconstruction, measured by ∆linT given in Eq. (11), is shown as a function of ETmiss,true for MC simulations of W → eν, W → µν and t ¯t production in Fig.6. The observed ∆linT > 0 at low ETmiss,trueindicates an overestimation of ETmiss,trueby the reconstructed ETmissdue to the observation biases arising from the finite ETmissresolution, as discussed in Section3.1. This bias overcompensates the lack of reconstructed pT-flow from the incompletely measured hadronic recoil in
W → eν and W → µν events for Emiss,true
T . 40 GeV with an increasing non-linearity observed with
decreasing ETmiss,true. For ETmiss,true & 70 GeV the ETmiss response is directly proportional to ETmiss,true, with the reconstructed recoil being approximately 2% too small. The W → eν and W → µν final states show very similar ∆linT (ETmiss,true), thus indicating the universality of the recoil reconstruction and
Figure 6: The deviation of the ETmissresponse from linearity, measured as a function of the expected ETmiss,trueby ∆linT in Eq. (11), in W → eν, W → µν, and t ¯t final states in MC simulations. The lower plot shows a zoomed-in view on the ∆linT dependence on ETmiss,truewith a highly suppressed ordinate.
the independence on the lepton flavour of the reconstructed ETmiss in a low-multiplicity final state with Emiss,true
T > 0.
In t ¯t final-state reconstruction, resolution effects tend to dominate ∆linT at ETmiss,true. 120 GeV. Compared to the W → eν and W → µν final states, a significantly poorer ETmiss resolution is observed in this kinematic region, due to the presence of at least four jets with relatively low pT and high sensitivity to
pile-up-induced fluctuations in each event of the t ¯t sample. For ETmiss,true> 120 GeV, ∆linT (ETmiss,true) ≈ 2% indicates a proportional ETmiss response with a systematic shift similar to the one observed in inclusive W -boson production.
6.2.3 Determination of the EmissT resolution
The ETmiss resolution is determined by the width of the combined distribution of the differences between the measured Ex(y)miss and the components of the true missing transverse momentum vector Emiss,trueT = (Emiss,true
x , Eymiss,true). The width is measured in terms of the RMS, with
RMSmissx(y) = (
RMS(Ex(y)miss− Ex(y)miss,true) W → eν or t¯t sample (ETmiss,true> 0) RMS(Ex(y)miss) Z → µµ sample (ETmiss,true= 0)
. (12)
This metric does not capture all of the effects driving the fluctuations in ETmiss reconstruction, such as biases between individual ETmissterms or the behaviour of outliers, but it is an appropriate general measure of how well ETmissrepresents ETmiss,true.
(a) (b)
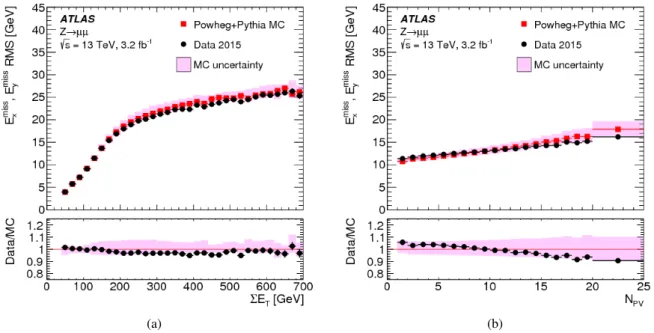
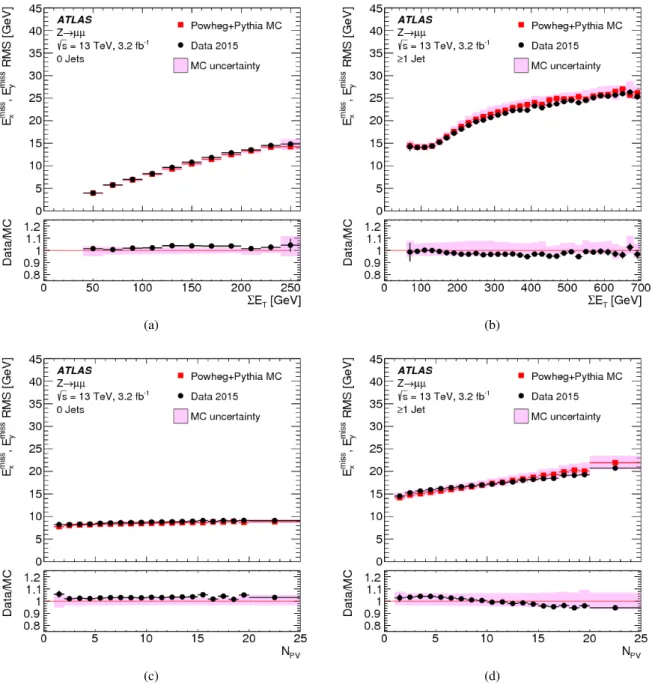
Figure 7: The RMS width of the Ex(y)miss distributions(a)in bins of ΣETand(b)in bins of the number of primary vertices in an inclusive sample of Z → µµ events. Predictions from MC simulations are overlaid on the data points, and the ratios are shown below the respective plot. The shaded bands indicate the combined statistical and systematic uncertainties of the resolution measurements.
Using the Z → µµ sample allows direct comparisons of RMSmissx(y) between data and MC simulations, as ETmiss,true = 0 in this case. The resolution in final states with genuine ETmiss is determined with MC simulations alone. For W → eν and t ¯t final states, Ex(y)miss,true= pνx(y) is used.
6.2.4 ETmissresolution measurements
The ETmiss resolution measured by RMSmissx(y) is evaluated as a function of the event activity measured by ΣET given in Eq. (7). For the inclusive Z → µµ sample, Fig.7(a) shows RMSmiss
x(y) quickly rising from
less than 5 GeV to about 10 GeV with increasing ΣET within 50 GeV ≤ ΣET < 70 GeV.7 This is due to
the fact that in this range the two muons are the dominant hard objects contributing, with a pTresolution
proportional to (pµT)2. A convolution of the muon resolution with a small contribution from ETmiss,soft is possible for ΣET > 50 GeV. This component is on average about 60% of pZT, and subject to the stochastic
fluctuations further discussed below.
The increase of Z → µµ + 1 jet topologies in the Z → µµ sample leads to an additional source of fluctuations affecting RMSmissx(y)(ΣET) for 70 GeV < ΣET . 180 GeV. In general the Z → µµ sample
collected for this study covers pZT . 140 GeV with relevant statistics. At this limit it is expected that the hadronic recoil contains two reconstructed jets, with the onset of this contribution at ΣET of about
180 GeV. The corresponding change of the dominant final state composition for ΣET > 180 GeV leads to a 7This lower boundary of this range is given by the muon selection with pµ
T> 25 GeV, as described in Section5.1, assuming no other hard-scatter vertex tracks, i.e. ETmiss,soft= 0. The upper boundary indicates the lower limit of ΣETto accommodate at least one jet with pjetT > 20 GeV in addition the two muons (for the jet selection see Section3.3.5).
(a) (b)
(c) (d)
Figure 8: The ETmiss resolution RMSmissx(y)determined for(a)an exclusive Z → µµ sample without jets with pT > 20 GeV (Njet= 0) and for(b)an exclusive sample with at least one jet above this threshold (Njet ≥ 1), as a function of ΣETin data and MC simulations. The dependence of RMSmissx(y)on the pile-up activity, as measured by NPV, for these two samples is shown in(c)and(d), respectively. The shaded bands indicate the combined statistical and systematic uncertainties associated with the measurement.
change of shape of RMSmissx(y)(ΣET), as the transverse momentum of the individual jets rises and the number
of contributing jets slowly increases. The expected RMSmissx(y)(ΣET) ∝
√
ΣETscaling driven by the jet-pT
resolution [44] therefore dominates RMSmissx(y)at these higher ΣET. The MC predictions for RMSmissx(y)(ΣET)
agree with the data within a few percent and well within the total uncertainties of this measurement. A tendency for slightly poorer resolution in MC simulations is observed, in particular for ΣET > 200 GeV.