Effects of Pre- and Post-Harvest Factors on the Selected
Elements Contents in Fruit Juices
Francisco J.A. PAULA1,2,3, Raquel P.F. GUINÉ 1,2, Luísa Cruz LOPES 1,4, Armando C. DUARTE 5, Anabela O.S. FRAGATA6 and Manuel A.L. REIS 7
1CI & DETS, Polytechnic Institute of Viseu, Campus Politécnico, Viseu, Portugal; 2Department of Food Engineering, ESAV, Polytechnic Institute of Viseu, Quinta da Alagoa, Viseu, Portugal;
3URFIC, S.A., R.Ed.A.M. Coimbra, Tondela, Portugal; 4Environment Department, ESTGV, Polytechnic Institute of Viseu, Campus Politécnico, Viseu, Portugal; 5Department of Chemistry
& CESAM, University of Aveiro, Campus Universitário de Santiago, Aveiro, Portugal; 6Department of Management, Administration and Tourism, ESTGL, Polytechnic Institute
of Viseu, Lamego, Portugal; 7Department of Mathematics, ESTGV, Polytechnic Institute of Viseu, Campus Politécnico, Viseu, Portugal
Abstract
Paula F.J.A., Guiné R.P.F., Cruz-Lopes L., Duarte A.C., Fragata A.O.S., Reis M.A.L. (2015): Effects of pre- and post-harvest factors on the selected elements contents in fruit juices. Czech J. Food Sci., 33: 384–391. Pre- and post-harvest factors determine the levels of the selected risk elements in100% fruit juices. The juices samples closely followed the Brix international reference values. Fruit juices presented the following order of the elements mean concentrations: cadmium (1.597 μg/l), chromium (2.767 μg/l), lead (20.75 μg/l), nickel (73.37 μg/l), zinc (545.9 μg/l), and iron (1792 μg/l), measured by AAS. The pre-harvest factors (origin, fruit, and agriculture) and the post-harvest factors (blending, packaging, conservation, pasteurisation, and process) were evaluated according to the manufacturers information and were correlated with the elements concentrations of fruit juices. A strong relationship was detected between the fruit species used for the juice production (i.e. pre-harvest factor) and their elements concentrations. Furthermore, multiple correspondence analysis was used for reducing the data dimension by grouping the factors. The zinc concentration was detected as a potential proxy for the identification of the fruit juices manufacturing process.
Keywords: processing effects; trace metals; atomic absorption; chemometric
Mineral elements are nutrients that have a significant role in the regulation of the human body metabolism. Fruits and their juices contain various mineral ele-ments in their composition, so they are important sources of minerals in human nutrition (Wall 2006; Ribeiro et al. 2009; Pennington & Fisher 2010).
Also, the intake of juices has been associated with the reduction of the risk of several types of cancer, thus increasing the public interest in these products (Chang et al. 2005).
The worldwide consumption of fruit juices has been increasing in recent years, requiring more extensive and better production efficiency, sustained by
tech-nological development. However, their equivalence to fresh fruits in health benefits has been questioned due to the high level of processing involved in the production of juices (AIJN 2010; Baker et al. 2012; Harmankaya et al. 2012).
The fruit juice products are obtained by two dif-ferent types of processing: pure juices are produced directly by extraction from the fruit, without dilution; juices from concentrates are produced by adding an adequate amount of water to the concentrate, pre-viously obtained by partial dehydration of the fruit juices (Ashurst 2005; Mobhammer et al. 2006; Keshani et al. 2010).
The Portuguese legislation on the fruit juices prod-ucts follows the Codex Alimentarius standards (FAO/ WHO 2005), and best practices code of the Associa-tion of the Industry of Juices and Nectars (AIJN) which publishes a table that sets a Brix graduation reference for fruit juices (AIJN 2012).
The quality of the fruit juices depends primarily on the quality and variety of the fruits used for process-ing. Some varieties of the same fruit are more suited for the preparation of juice than others (Echeverria et al. 2002; Versari et al. 2002).
The processing operations introduce major changes in the fruits and will also be a determinant in the final product quality, particularly in view of the nu-tritional value provided by the chemical composition (Rodushkina & Magnusson 2005; Ros et al. 2007; Bevelacqua et al. 2011; Bhattacherjee et al. 2011; Tangahu et al. 2011; Fawole & Oto 2013).
The fruit cultivar, agricultural practice, and pro-cessing may be crucial factors determining the el-emental composition of the juice, so that pre- and post-harvest factors determine the expected elemental concentration of fruit juices (Cisse et al. 2005; Nie-naber & Shellhammer 2005; Léchaudel & Joas 2007; Jalbani et al., 2010; Fernandes, et al. 2011; Bragança et al. 2012).
In this work, elemental characterisation was made of some major industrial contaminating metals in 100% fruit juices available in the Portuguese market, which was correlated with the pre-harvest factors; origin (country), agriculture (conventional or organic), fruit (kind of fruit used), and the post-harvest fac-tors; blending (fruits %), packaging (type of pack), conservation (refrigerated or ambient), pasteurisa-tion (heat or high pressure), process (extracpasteurisa-tion or dilution), and Brix values.
MATERIAL AND METHODS
Three replicates were made for each sample meas-urement, considering as acceptable only the results with the coefficient of variation less than or equal to 10%. The water used in all laboratory procedures was 18.2 MΩcm (25°C) ultra-pure water Millipore Simplicity.
Sampling. A sample of 62 packs was collected of
fruit juices (one pack for each different product of each producer) which were acquired randomly and as close as possible in time from major supermarkets in Portugal. All packs were kept refrigerated.
Determination of Brix graduation. In order to
determine the sample dilution, the Brix graduation was measured with a refractometer model DBR45 (Tsingtao Unicom-Optics Instruments Co., Laixi, China), with automatic temperature compensation for aqueous solutions between 5°C and 40°C, with the temperature reading accuracy of ± 0.5°C, Brix range measuring was between 0 and 45 °Bx and Brix reading accuracy was ± 0.1 °Bx.
The device was calibrated, using ultra-pure water.
Sample preparation for elemental analysis. For
separating materials in suspension, the juice samples were placed in polypropylene centrifuge tubes of approximately 50 ml and centrifuged at room tem-perature in a Hettich EBA12 centrifuge (Andreas Hettich GmbH, Tuttlingen, Germany) at a rotation speed of 6000 rpm for 60 minutes. The separated liquids were decanted into a sample holder and placed in a refrigerator for cooling.
The process of wet digestion was used applying with nitric acid in a closed system (Morte et al. 2008; Cindric et al. 2011). The samples of juices were placed in digestion tubes, of 16 mm diameter with screw caps, Merck COD Spectroquant. Into each tube 5 ml of sample and 0.5 ml of nitric acid (65% p.a.; Sigma-Aldrich, Steinheim, Germany) were added. Subsequently, after sealing the tubes diges-tion took place in a Spectroquant TR 320 Merck Thermoreactor (Merck, Darmstadt, Germany). The following temperature cycle was used in the diges-tion: 100°C/15 min, 120°C/15 min, and 148°C/15 min (Hseu 2004; Szymczycha-Madeja & Welna 2013). All samples appeared clear at the end of the diges-tion and with no suspended solids, the process be-ing repeated if not. Finally, the samples were left to cool at room temperature, they the screw caps were carefully removed upon which all samples liberated pressurised gas indicating that all digestion proce-dures were performed well in a closed system.
The liquids obtained from the digestion flasks were placed in 10 ml volumetric flasks and the volume was made up with ultra-pure water. The storing in the refrigerator was made by transferring the contents of the volumetric flasks into glass tubes with screw caps which were properly identified.
Elemental analysis. Taking as reference the
meas-urements made in wines by Rodrigues et al. (2011), and in fruit juices by Szymczycha-Madeja et al. (2014), the expected elemental concentration values of certain juices could be very low and in some cases even difficult to detect.
The concentrations of Cd, Cr, Pb, and Ni were meas-ured by graphite furnace atomic spectrometry, using an AAnalyst 300 Perkin Elmer, HGA 850 graphite furnace spectrometer with an A5 800 auto sampler.
In this system, as chemical modifiers were used (in aqueous solution), NH4H2PO4, 40 g/l, for lead determi-nation, and Mg (NO3)2, 0.3 g/l for the determination of cadmium, chromium, and nickel, respectively prepared from pa ammonium dihydrogen phosphate Riedel-de Haën and magnesium nitrate hexahydrate p.a. (Sigma-Aldrich). Also used were pirorevested graphite tubes, PerkinElmer HGA, with integrated platform.
The measuring operation began by introducing a known volume, in this case 20 µl of the sample, into the graphite tube chamber orifice, and the chamber was then subjected to a temperature multistep pro-gram, according to the analyte and sample matrix.
Still in this work, the concentrations of Zn and Fe were measured by flame atomic absorption (FAA), using an atomic absorption spectrometer Philips PU9100X (Bings et al. 2010).
In the two systems, FAAS and GFAAS, a solution of HNO3 0.2% v/v, was used as: white, zero point calibration, and to dilutions. All operating condi-tions are described in Table 1.
Spiking tests were performed in four fruit juices samples. The % of recovery of each analyte was cal-culated in relation to the added element concentra-tion and the range obtained was: Cd (94–115%), Cr (80–126%), Pb (98–109%), Ni (95–108%), Zn (84–127%), and Fe (96–106%). The % of recovery for all elements was always within the interval of 80–127%.
Statistical analysis. The statistical treatment of
the data, namely multiple correspondence analysis, was done with IBM SPSS statistic software v. 20.
RESULTS
Sample variables description. Some sample in-formation was obtained by examining the label, or by direct contact with the manufacturer.
Regarding the different countries (origin) in which the fruit juices were manufactured, they comprised: Spain (48%), Portugal (30%), South Africa (13%), France (4%), Germay (3%), and United Kingdom (2%). We assume that the manufacturing plant is geographically close to the cultivar at list in juice main fruit component.
Table 1. Operating conditions of GFAAS (Cd, Cr, Pb, Ni), and FAAS (Zn, Fe) measurements
Element Cd Cr Pb Ni Zn Fe
Wavelength (nm) 228.0 357.9 283.3 232.0 213.9 248.3
Maximum lamp current (mA) 15 10 20 25 10 15
Bandpass (nm) 0.7 0.7 0.7 0.2 0.5 0.2
Injection sample-modifier (µl) 20–10. 20-5. 20-5. 20-10. – –
Air/acetylene flame (l/min) – – – – 0.9–1.2 0.8–1.2
Calibration points (µg/l) 0; 0.5; 1; 5;
10 0; 5; 10; 15; 20; 25 0; 2.5; 5; 10; 25; 50 0; 5; 10; 25; 50; 100 0; 500; 1000; 1500; 2000 0; 1000; 2000; 3000; 4000 Standard solution 1.000 ± 0.002 (g/l) Panreac Panreac Panreac Panreac Merck Merck
Slope 0.03682 0.01746 0.00511 0.00389 0.00008 0.00002
Intercept 0.0280 0.0054 0.0118 0.0027 0.0156 0.0018
Coefficient of determination 0.99894 0.99796 0.99744 0.99924 0.99730 0.99591 Step ramp time
(s) hold time (s) internal gas flow (ml/min) temperature (°C) 1º Drying 5 20 250 120 120 120 120 – 2º Drying 15 25 250 140 140 140 140 3º Pyrolysis 10 20 250 850 1650 700 1400 4º Atomisation 0 5 0 1650 2500 1800 2500 5º Clean 1 3 250 2600 2600 2600 2600
As to the fruit species (fruit) in juices containing only onesort of fruit, following stand out: 22% of juices containing apple, 21% containing orange, and 21% con-taining other fruits. Two fruit species were contained in 31%, and a mixture of up to ten fruit species in 5%.
It was also possible to specify for each juice prod-uct its percentile (v/v) fruit composition, generally referred to in the ingredients label (blending set of factors: apple (%), orange (%), other fruits (%)).
Juices kept at ambient temperature with shelf life of twelve months (conservation) were packed mainly in Tetra Brik or Combiblock packs (packaging), along with glass bottles and Pure Packs. The juices kept under refrigeration with a shelf life of three months were packed either in HDPE or in PET bottles and only a small part in Pure Packs.
For the majority of juices (95%), the fruits were pro-duced by conventional agriculture (agriculture) and only a small part of them (5%) by organic agriculture.
The pasteurisation treatment (pasteurisation) of juices was carried out in 81% by heat treatment, and in 19% by high pressure treatment.
The process of making the juice (process) was executed in 67% by concentrates dilution, and in 33% by direct extraction from fruits.
The Brix values of juices (Brix) ranged from 5.0 to 15.9. The average being 11.8 °Bx. In juices from mixed fruits, the Brix values were calculated, entering the weight of the amount of each fruit component in percentage of the mixture. It was verified that only 14% of the values found in the juice Brix graduation were below the minimum values of AIJN, but still very close to these values as all the rest of them.
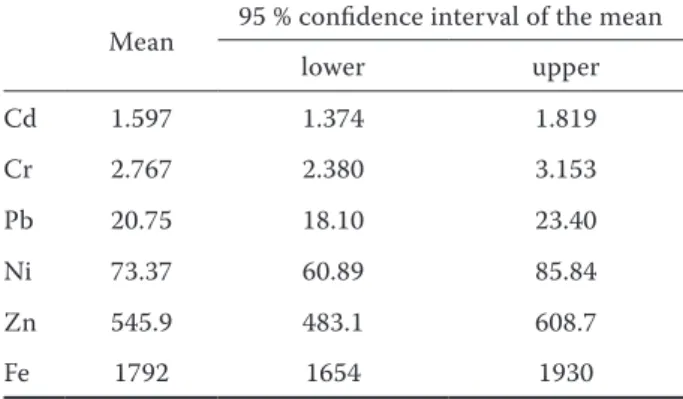
Fruit juices elemental characterisation. The
average concentrations of Cd, Cr, Pb, Ni, Zn, and Fe (Table 2) in the juices were estimated, calculating the intervals with a confidence level of 95%. The Kolmogorov-Smirnov test with Lilliefors correction and the Shapiro-Wilk test allowed to assume a normal distribution of these parameters, not rejecting the null hypothesis at the 0,05 significance level.
In the case of cadmium we estimated a mean value of 1.597 μg/l, the level rising up to 1.2 μg/l in the Brazilian juice market (Tormen et al. 2011).
Chromium, the amount of which we found to be 2.767 μg/l, was detected in the range of 0–17.61 μg/l in the Spanish juice market (Garcia et al. 1999).
As for lead, we found the mean value of 20.75 μg/l while in the Brazilian juice market, lead was detected in the range from 0.1 μg/l to 2.1 μg/l (Tormen et al. 2011) and even up to 129 μg/l (Froes et al. 2009). The Codex Alimentarius establishes as maximum lead content 0.3 mg/kg in orange juice.
We estimated the mean value of 73.37 μg/l for nickel whereas in the Brazilian juice market nickel was found in amounts of up to 180 μg/l (Simpkins et al. 2000;Froes et al. 2009; Tormen et al. 2011).
We found the mean value of 545.9 μg/l for zinc, which was detected in orange Australian juice in the range of 120–680 μg/kg (Simpkins et al. 2000), and in the juices in Brazil between 86.7 and 1122.5 μg/l (Nascentes et al. 2004). The limit set in the Codex Alimentarius for orange juice is 5 mg/kg.
Finaly, we estimated the mean value of 1792 μg/lfor iron, which was detected in the juices of the Austral-Table 2. Elemental concentration mean, and 95%
confi-dence interval of 100% fruit juices from the Portuguese market (in μg/l)
Mean 95 % confidence interval of the mean
lower upper Cd 1.597 1.374 1.819 Cr 2.767 2.380 3.153 Pb 20.75 18.10 23.40 Ni 73.37 60.89 85.84 Zn 545.9 483.1 608.7 Fe 1792 1654 1930
Table 3. Strong results of association from the Spearman correlation and correlation ratio
Cd Cr Pb Ni Zn Fe
Spearman
Pineapple (%) 0.475
Red grape (%) 0.470 0.517
Brix 0.446
Eta FruitOrigin 0.715 0.634 0.5510.482 0.598 0.902 0.884
ian market in the range 20–1800 μg/kg (Simpkins et al. 2000) and in berry juices on the Serbian market in the range of 300–2100 μg/kg (Ristic et al. 2011). The limit fixed by the Codex Alimentarius for orange juice is 15 mg/kg.
Association between factors and elemental fruit juices concentrations. A bivariate correlation analysis
was made, measuring the association between the factors and elemental concentrations by calculating the correlation coefficients (Table 3).
The variable Brix and the variables from the Blend-ing set were not normally distributed, the bivariate Spearman correlation of these variables with the elemental concentrations of juices indicated a weak association between them.
The association of the qualitative variables (fruit, origin, agriculture, pasteurisation, packaging, con-servation, process) with the elemental concentrations
in the fruit juices, calculating the correlation ratio (Eta), was strong with the fruit variables.
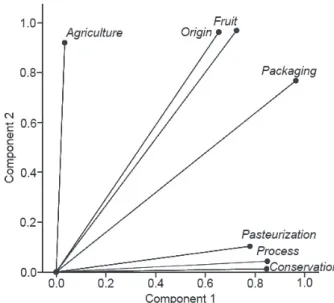
Reducing data dimension. In order to reduce
the number of variables (fruit, origin, agriculture, pasteurisation, packaging, conservation, process) a multiple correspondence analysis was made. Two components were extracted: component 1 and com-ponent 2 (Table 4) represented in two-dimensional space (Figure 1), showing the variables related to component 1, C1 = pasteurisation + packaging + conservation + process, and the variables related to component 2, C2 = fruit + agriculture + origin. The internal consistency of the components, meas-ured by Cronbach’s α, is very good (0.926) in the case of component 1 and good (0.858) in the case of component 2.
Two new variables were defined: pre-harvest and post-harvest, assigned respectively, to components C2 Table 4. Extracted matrix of main components, from
corre-spondence analysis of multiple variables fruit, origin, agri-culture, pasteurisation, packaging, conservation, and process
Component 1 2 Fruit 0.725 0.969 Origin 0.654 0.962 Agriculture 0.034 0.920 Pasteurisation 0.779 0.103 Packaging 0.963 0.767 Conservation 0.846 0.012 Process 0.849 0.043 Eigenvalue 4.851 3.775 % of variance 69.296 53.936
Cronbach α 0.926 0.858 Figure 1. Representation of the variables: fruit, origin, agriculture, pasteurisation, packaging, conservation, and process in the components phase space
Table 5. Levene’s test and t-test for Zn variable
equality of variancesLevene’s test for
t-Test for equality of means
t df (2-tailed)Sig. differencemean differencestd. error 95% confidence inter-val of the difference
F Sig. lower upper
Equ al var ianc es assumed 9.883 0.003 –2.180 65.000 0.033 –142.128 65.193 –272.327 –11.929 not assumed –2.558 61.589 0.013 –142.128 55.557 –253.199 –31.057
and C1, while the former represents the agricultural production underlying the fruits gathering, the lat-ter represents the industrial processing to obtain the juices.
The degree of association was measured between the new defined variables and the juices elemental concentrations. The Spearman correlation values indicated a weaker association of elemental con-centration variables with the new group variables.
Differentiation of extraction and dilution pro-cesses. By the variance analysis, a comparison was
made of the means of juice elemental concentration variables with the process variable group of extraction and group of dilution. First, the test was performed of homogeneity of variance (Levene’s test) and then the Student t-test for independent sample.
Table 5 shows the result for the variable Zn, which was assigned a statistical difference between the two groups. In this case, H0 was rejected in Levene test for the significance level α = 0.05 since Sig. P < 0.05 and then the t-test result corresponding to equal variances, concluded not assumed, rejecting t-test H0 of the variable Zn (to the significance level α = 0.05) since Sig. (2-tailed) P = 0.013 < 0.05.
This result means that, statistically, the values of the Zn content of the dilution process are differ-ent from those of the extraction process, with 95% confidence level.
The average Zn concentration of juices obtained by direct extraction was 450.4 μg/l and of juices obtained by diluting the concentrate was 592.6 μ/g.
CONCLUSIONS
Fruit juices present in the Portuguese market are mostly manufactured in Spain, and they show the predominance of one of two kinds of fruits: apple or orange. The juices obtained by direct extraction are packed in HDFE bottles and preserved by refrigeration with a shelf life of three months. The juices obtained by dilution are packed mostly in Tetra Brik and are kept at room temperature with a shelf life of twelve months. At the present time, the organic juices still show a very small presence in this market, expressed by less than 5%, of the fruit juices.
Most juices follow the international recommenda-tions on Brix graduation. As for the mineral elements present in fruit juice, the least abundant is cadmium, followed, respectively, in increasing order by chromium, lead, nickel, zinc, and finally iron.
A strong association was detected between juice elemental concentrations and the type of fruit used to make the juice.
In the second approach, after reducing the data matrix dimension no association was detected be-tween the new group variables assigned to pre-harvest and post-harvest practices, and elemental fruit juice concentration, reinforcing the idea that just the fruit type, the fruit genotype, will have an important influence on the elemental concentration of juices.
As for the possible identification, by elemental analysis, of the process of obtaining the juices, i.e. by extraction from fruits or by diluting concentrates, the values of zinc concentration can provide an im-portant contribution.
Refrences
AIJN (2010): Market Report. Liquid Fruit. Brussels. AIJN (2012): Association of the Industry of Juices and
Nectars. Available at http://www.aijn.org (accessed June 21, 2012).
Ashurst P. (2005): Non-carbonated beverages. In: Ashurst P. (ed.): Chemistry and Technology of Soft Drinks and Fruit Juices. Oxford, Blackwell Publishing Ltd.
Baker S., Cochran W., Greer F., Heyman M., Jaksic T., Krebs N. (2012): The use and misuse of fruit juice in pediatrics. Pediatrics, 100: 1210–1213.
Bevelacqua A., Corbo M., Campaniello D., D’Amato D., Gallo M., Speranza B., Sinigaglia M. (2011): Shelf life prolongation of fruit juices through essencial oils and homogenization: a review. In: Méndez A. (ed.): Science against Microbial Pathogens: Communicating Current Research and Technological Advances. Vol. 3, Microbi-ology Book Series. Badajoz, Formatex Research Center: 1157–1166.
Bhattacherjee A., Tandon D., Kumar D. (2011): Effect of pasteurization temperature on quality of aonia juice during storage. Journal of Food Science and Technology, 48: 269–273.
Bings N., Bogaerts A., Broekaert J. (2010): Atomic spec-troscopy: a review. Analytical Chemistry, 82: 4653–4681. Bragança C., Meinikov P., Zanoni Z. (2012): Trace elements
in fruit juices. Biological Trace Element Research, 146: 256–261.
Chang J., Wang F., Holly E. (2005): Vegetable and fruit intake and pancreatic cancer in a population-based case-control study in the San Francisco Bay Area. Cancer Epidemial Biomarkers, 14: 2093–2097.
Cindric I., Zeiner M., Kröppl M., Stingeder G. (2011): Com-parison of sample preparation methods for the ICP-AES
determination of minor and major elements in clarified apples juices. Microchemical Journal, 99: 364–369. Cisse M., Vaillant F., Perez A., Dornier M., Reynes M.
(2005): The quality of oranje juice processed by coupling crossflow microfiltration and osmotic evaporation. Inter-national Journal of Food and Technology, 40: 105–116. Echeverria G., Graell J., López M. (2002): Effect of
har-vest date and storage conditions on quality and aroma production of fuji apples. Food Science and Technology International, 8: 351–360.
FAO/WHO Codex Stan 247-2005. (n.d.): Codex General Standards for Fruit Juices and Nectars.
Fawole O., Opara U. (2013): Changes in physical properties chemical and elemental composition and antioxidant capacity of pomegranate (cv. Ruby) fruit at five maturity stages. Scientia Horticulturae, 150: 37–46.
Fernandes A., Santos G., Silva D., Sousa P., Maia G., Figue-iredo R. (2011): Chemical and physicochemical charac-teristics changes during passion fruit juice processing. Ciência e Tecnologia de Alimentos, 31: 747–751. Froes R., Neto W., Silva N., Naveira R., Nascentes C., Silva J.
(2009): Multivariate optimization by exploratory analysis applied to the determination of microelements in fruit juice by inductively coupled plasma optical emission spectrometry. Spectrochimica Acta Part B, 64: 619–622. Garcia E., Cabrera C., Sanchez J., Lorenzo M., Lopez M.
(1999): Chromium levels in potable water, fruit juices and soft drinks: influence on dietary intake. Science of the Environment, 241: 143–150.
Harmankaya M., Gezgin S., Özcan M. (2012): Comparative evaluational of some macro- and micro-element and heavy metal contents in commercial fruit juices. Envi-ronmental Monitoring and Assessent, 184: 5415–5420. Hseu Z. (2004): Evaluating heavy metal contents in nine
composts using four digestion methods. Bioresouce Tech-nology, 95: 53–59.
Jalbani N., Ahmed F., Kazi T., Rashid U., Munshi A., Kandhro A. (2010): Determination of essential elements (Cu, Fe and Zn) in juices of commercially available in Pakistan. Food and Chemical Toxicology, 48: 2737–2740. Keshani S., Luqman A., Nourouzi M., Russly A., Jamilah B.
(2010): Optimization of concentration process on pomelo fruit juice using response surface methodology (RSM). International Food Research Journal, 17: 733–742. Léchaudel M., Joas J. (2007): An overview of preharvest
fac-tors influencing mango fruit growth quality and postharvest behavior. Brazilian Journal of Plant Physiology, 19: 287–298. Mobhammer M., Stintzing C., Carle R. (2006): Evolution
of dfiferent methods for the production of juice concen-trates and fruit powders from cactus pear. Innovative Food Science and Emerging Technologies, 7: 275–287.
Morte E., Santos D., Castro J., Barbosa J., Teixeira A., Fer-nandes A., Korn M. (2008): Sample preparation for the determination of metals in food samples using spec-troanalytical methods- a review. Applied Spectroscopy Reviews, 43: 67–92.
Nascentes C., Arruda M., Nogueira A., Nóbrega J. (2004): Direct determination of Cu and Zn in fruit juices and bovine milk by thermospray flame furnace atomic absorp-tion spectrometry. Talanta, 64: 912–917.
Nienaber U., Shellhammer T. (2005): High-pressure pro-cessing of orange juice: combination treatments and a shelf life study. Journal of Food Science, 66: 332–336. Pennington J., Fisher R. (2010): Food component profile for
fruit and vegetable subgroups. Journal of Food Composi-tion and Analysis, 23: 411–418.
Ribeiro M., Nocl F., Cronin D., Lyng J., Morgan D. (2009): Shelf life and sensory evaluation of orange juice after exposure to thermosonification and pulsed electric fields. Food and Bioproducts Pocessing, 87: 102–107.
Ristic A., Savikin K., Jankovic T., Juranic Z., Menkovic N., Stankovic I. (2011): Biological activity and chemical composition of different berry juices. Food Chemistry, 125: 1412–1417.
Rodrigues S., Otero M., Alves A., Coimbra J., Coimbra M., Pereira E., Duarte A. (2011): Elemental analysis for categorization of wines and authentication of their certi-fied brand of origin. Journal of Food Composition and Analysis, 24: 548–562.
Rodushkina I., Magnusson A. (2005): Migration to orange juice in laminated paperboar packages. Journal of Food Composition and Analysis, 18: 365–374.
Ros M., Balissario Y., Iguaz A., López A. (2007): Quality and shelf life of oranje juice aseptically packaged in PET bottles. Journal of Food Engineering, 79: 234–242. Simpkins W., Louie H., Wub M., Harrison M., Goldberg
D. (2000): Trace elements in Australian orange juice and other products. Food Chemistry, 71: 423–433.
Szymczycha-Madeja A., Welna M. (2013): Evaluation of a simple and fast method for the multi-elemental analysis in commercial fruit juice samples using atomic emission spectrometry. Food Chemistry, 141: 3466–3472. Szymczycha-Madeja A., Welna M., Jedryczko D., Pohl P.
(2014): Developments and strategies in the spectrochemi-cal elemental analysis of fruit juices. Trends in Analytispectrochemi-cal Chemistry, 55: 68–80.
Tangahu B., Abdullah S., Idris H., Anuar N., Mukhlisin M. (2011): A review on heavy metals (As, Pb and Hg) uptake by plants through phytoremediaton. International Journal of Chemical Engineering, 2011, Article ID 939161. Tormen L., Torres D., Dittert I., Araújo R., Frescura V.,
Cur-tis A. (2011): Rapid assessment of metal contamination in commercial fruit juices by inductively coupled mass
spectrometry after a simple dilution. Journal of Food Composition and Analysis, 24: 95–102.
Versari A., Castellari M., Parpinello G., Riponi C., Galassi S. (2002): Characterisation of peach juices obtained from cultivars Redhaven, Suncrest and Maria Marta grown in Italy. Food Chemistry, 76: 181–185.
Wall M. (2006): Ascorbic acid, vitamin A and mineral com-position of banana (Musa sp.) and papaya (Carica papaya) cultivars grown in Hawaii. Journal of Food Composition and Analysis, 19: 434–445.
Received: 2014–09–18 Accepted after corrections: 2015–02–25
Corresponding author:
Dr Francisco J. A. Paula, CI&DETS, Polytechnic Institute of Viseu, Campus Politécnico, 3504-510 Viseu, Portugal; E-mail: [email protected]