A Work Project, presented as part of the requirements for the Award of a Master Degree Management from the NOVA – School of Business and Economics.
Sustainability Issues in Lithium-ion Batteries’ Supply Chain
João Lucas Fragueiro Pinto, 26049
A Project carried out on the Master in Management Program, under the supervision of Professor Paulo Faroleiro
1
Abstract
This Thesis assesses environmental, social and economic/supply chain sustainability issues associated with the Lithium-ion batteries lifecycle, as well as the application of multi-criteria decision analysis on sustainability issues. Additionally, it develops a multi-criteria decision model, based on diverse performance and social indicators, to be applied in the supply chain stages of such devices, to compare social issues exposure in a different alternative location, for three different critical materials, offering the possibility of evaluating and comparing specific supply chain configurations.
Keywords: Sustainability, Electric Batteries, Supply Chain, MCDA
This work used infrastructure and resources funded by Fundação para a Ciência e a Tecnologia (UID/ECO/00124/2013, UID/ECO/00124/2019 and Social Sciences DataLab, Project 22209), POR Lisboa (LISBOA-01-0145-FEDER-007722 and Social Sciences DataLab, Project 22209) and POR Norte (Social Sciences DataLab, Project 22209).
2
Introduction
The automotive industry is very relevant, worldwide. It has evolved in an upwards trajectory in different world regions: In Europe, region whose main driver of growth is precisely this industry, excluding the recession in the early 1990s and the financial crisis in 2009, the industry has been growing continuously for almost forty years (McKinsey & Company, 2019), accounting for approximately 12 million jobs (ACEA, 2014); In the US, where more than 8 million jobs are related to the automotive sector (ACEA, 2014), revenues and sales have recovered from the economic crisis; In China, country which has been the focus of considerable investments related to the automotive sector, the industry remains growing at a remarkable pace. (McKinsey & Company, 2016).
However, despite the good economic performance of the industry, it has always been associated with sustainability issues, with more emphasis on environmental concerns. (Ahmed Ali, Sapuan, Zainudin, & Othman, 2015) (Marsh, 2003). As a matter of fact, in 2017, in the US, the transportation sector represented 29% of the total Greenhouse Gas emissions (US EPA, OA, 2018).
Hereupon, one possible path to mitigate this problem can be the electrification of vehicles. In recent years, Electrical Vehicles industry is growing at a considerable pace: if, in 2016, less than 5 percent of commercialized vehicles were equipped with electrified-vehicle powertrains, nowadays, the industry expects this value to rise by more than 50 percent by 2021 (McKinsey & Company, 2017), as several car manufacturers have plans to increase the number of electric/hybrid vehicles or even plans to discontinue models without electrified-vehicle powertrains (Riley, 2019)(Volvo, 2019). One factor that enhances the growth of vehicle electrification and disruptive trends transforming the auto industry - such as shared mobility, connectivity, and autonomous driving (McKinsey & Company, 2017) - are customers’ conscience about the sustainability issues of the conventional vehicles, which generates pressures such as the ones discussed in the Literature Review. This increasing conscience is portrayed in the fact that, concerning Electric Vehicles’ (EV) buyers – the
3 stakeholders with more power to influence organizational approach to sustainability (McKinsey & Company, 2017) –, 87% consumers have a better image of a company that shows concerns for social/environmental issues (Komornicki, 2017).
However, electric vehicles and, especially, their electric batteries’ supply chains have their own sustainability issues. As a matter of fact, on one hand, these problems can be differentiated by its nature, being related with distinct sustainability’s dimensions, with social issues being the main focus of this paper, since they have been the least scrutinized. On the other hand, different supply chain stages/locations are associated with specific issues. Both these dynamics shall be the focus of this paper. Nevertheless, in order to make a proper assessment of sustainable issues related to the production of lithium-ion batteries, it is crucial to understand how these batteries are composed as well as to comprehend the status quo of the supply-chain of its several components.
The remainder of this paper is organized as follows: “Literature review” analyses Lithium-ion Batteries (LIBS) composition and supply-chain, defines sustainability and its dimensions, analyses publication on sustainability issues related with LIBS production and makes an assessment of the usage of Multi-Criteria Decision Modelling in the auto industry; “Preposition” concludes the literature review, introducing the model developed to fill the research gap; “Methodology” describes the procedures and steps that led to the creation of such model; “Results” assesses the outcome of the developed model; “Conclusion” draws the paper intakes and illation and, finally “limitations and future research” reveal aspects of the paper which can be enhanced and studies which could complement it.
Literature Review
Lithium-ion Battery Systems (LIBS) battery supply chain configuration (Olivetti, Ceder, Gaustad, & Fu, 2017) (Thies, Kieckhäfer, Spengler, & Sodhi, 2019) (Sun, Hao, Hartmann, Liu, & Zhao, 2019) (Australia Unlimited, 2018)
4
Battery Cell Composition
The main components in a lithium-ion battery are the battery cells, in which the energy is stored; the battery management system, which regulates the condition of the cells and the pack container and respective cooling system to isolate the internal components from the exterior effects. The focus of this paper will be on the battery cells, as they are the component whose production is, by far, more susceptible to sustainability issues due to the way it is composed: the battery cells consist of two electrodes (a cathode and an anode); a separator and a cell container, with the respective electric connectors. The electrodes are the most relevant elements of the battery cell, as they are the most determinant for both performance and cost of the battery. On top of that, and most importantly for this paper, for electric vehicle applications, they are derived, typically, in the case of the cathode, from critical minerals such as lithium, nickel, and cobalt.
Battery Cell Supply Chain Configuration
For the purposes of this study, the supply chain configuration of lithium-ion batteries shall be divided into three main stages: Mining, Refining, and Manufacturing, representing, respectively, the Upstream, the middle stream and the downstream.
The Mining stage refers to the process through which the raw materials for the batteries, i.e. the minerals, are extracted from nature. Those minerals can be found in different locations: Lithium is mainly produced in Australia, with Chile and Argentina also being relevant producers; The extraction of cobalt is highly concentrated in the Democratic Republic of Congo, a country that represents more than 50% of the worldwide production. Additional minor producers include China and Australia. Concerning Nickel, the global production is considerably dispersed, with the main producer being the Philippines, followed by many other producers such as Indonesia and Australia. The Refining Stage consists of the process of transforming the minerals into intermediate products, i.e. chemicals and elementary substances which are part of the cathode active materials and the
5 electrolyte. For all the minerals this paper will focus on, the refining worldwide is predominantly conducted by specialty chemical companies located in China. The Manufacturing Stage comprises the processes that transform the intermediate products in the end products, meaning electrode production; cell fabrication, formation, and aging; as well as pack assembly. Concerning the cell production, just as it was the case for the Refining stage, China has become the biggest player, whilst, with battery assembly, car manufacturers tend to proceed to it closer to the facilities where the cars are built, with the principal shares being China, United States, and Germany.
Sustainability
According to the Cambridge dictionary, Sustainability “is the quality of being able to continue over a period of time” (Cambridge Dictionary, 2019). Reformulating in a simple and broad idea and applying to development, as it was defined, in 1987, by the Brundtland Commission, “sustainable development is a development that meets the needs of the present without compromising the ability of future generations to meet their own needs” (United Nations, 1987).
Despite being, since its genesis, widely considered to be a vague term open to interpretations (Lélé, 1991), Sustainability is usually considered to be composed of three interdependent, although not mutually exclusive, main dimensions or Pillars, representing Environmental, Social and Economic factors. This three-part composition is also known as the “Three Bottom Line” approach (Elkington, 1998). The first dimension, environmental sustainability, the field with more literature coverage, refers to the preservation of natural capital (Goodland & Daly, 1996). In other to environmental sustainability to be attained, two basic principles must hold (Fritsch, Schmidheiny, & Seifritz, 1994): the rate to each renewable resources are consumed must not be higher than the one to each this resources are regenerated and the rate to each waste is emitted to the ecosystems must not be higher than the rate to each the respective ecosystem is able to assimilate the waste. The second pillar, social sustainability, the less studied field, can be defined as the maintenance of Moral and Human capital (Goodland & Daly, 1996). Furthermore, this capital demands maintenance and
6 renewal through equal human rights, community and cultural interaction. Otherwise, it will degenerate, just as physical capital does. Additionally, it is also related to the effects that generate phenomena experienced by a person or a group of people, causing, therefore, “social impact” (Macombe, Leskinen, Feschet, & Antikainen, 2013). Finally, economic sustainability is related to the maintenance of capital, meaning keeping it intact (Goodland & Daly, 1996). Is most often referred to in monetary terms. Moreover, it can also focus on the natural resources that generate physical inputs for the production process (Goodland, 1995).
Sustainability is applied to a vast set of areas such as Economics, Philosophy, and Science. In a business context, sustainability can be defined as “the pursuit of a business growth strategy that creates long-term shareholder value by seizing opportunities and managing risks related to the company’s environmental and social impacts” (Mitchell, Ray, Ark, 2015).
Sustainability and Supply Chains
Various corporations’ dimensions are associated with its ability to achieve sustainability, however, one dimension that is increasingly recognized as a key component of corporate sustainability is its supply-chain, since “companies are only as sustainable as its suppliers” (Krause, Vachon, & Klassen, 2009). According to Sisco, Chorn, Peder Michael Pruzan-Jorgensen (2011), to Supply-chain sustainability refers to the management of the different dimensional impacts associated with sustainability (environmental, social and economic), as well as developing and promoting good governance practices, throughout the goods and services’ lifecycles. The goal of supply chain sustainability is to generate, preserve and develop long-term environmental, social and economic value for all the stakeholders involved in the production and commercialization of goods and services.
Supply Chain sustainability Assessment Tool
As the focus of this paper will be the social dimension of supply chain sustainability, it is important to mention that several methods and tools have been developed in other to control or assess one’s
7 company social sustainability at different levels. One that stands out as being particularly relevant, as it is used in many of the papers analyzed in the rest of the literature review and in the model construction itself (in the Methodology section), is the Social Life Cycle Assessment (SLCA). SLCA can be described as a social impact assessment technique, aiming to evaluate social aspects of products and their potential beneficial or prejudicial impact, with generic and specific data, throughout their life cycle, which comprises all stages of its supply chain: extraction and processing of raw materials, manufacturing, distribution usage, reuse, maintenance, recycling and final disposal (Benoît & United Nations. Environment Programme, 2009).
Articles on Lithium-ion Batteries and Related topics
A comprehensive literature review was conducted by Agusdinata, Liu, Eakin, and Romero (2018) to access how the researches around the theme Lithium-ion batteries have been evolving over time, since the 1990s. The analyses, which involved 395 articles, concluded that, until 2012, the main research was focused on Environmental issues. Only afterward, Socio-economic studies emerged. Among this emerging literature, the three main categories were: socio-ecological consequences of mining activities and social justice issues on local societies; human health and potential toxicity concerns of battery cells for society and socio-economic benefits. Concerning the supply chain scope of the mentioned researches, literature’s main scope is dedicated to the production, more specifically, the manufacture of battery electrodes and end-use of Lithium-ion Batteries Systems.
LIBS Environmental Sustainability
Dehghani-Sanij, Tharumalingam, Dusseault, & Fraser (2019) carried out a study that made a thorough assessment of the different types of energy storage systems, including Lithium-ion batteries, focusing on the environmental implications of such devices and associated environment sustainability challenges. As far as what concerns LIBS, the main concerns are related to C02 emissions, with these types of batteries producing 70 kg of Co2 per kWh, which makes them the highest rank CO2-eq emissions producers among energy storage devices. These emissions are
8 distributed along the different stages of its supply chain, including recycling. Moreover, additional identified environmental issues are related to the possibility of corrosive battery electrolytes leaking after breaking during storage, use or transportation, or the possibility of dissolved metals, such as lead, becoming resident in water or soil.
In the same context as the previously referred article, Sullivan & Gaines (2010) evaluated the environmental impact of the production of such devices, through a Life Cycle assessment on the several supply chain stages of many types of batteries, including LIBS, achieving similar conclusions.
To complement environmental studies, Gemechu, Sonnemann & Young, (2015) proposes the inclusion of the Geological Risk indicator in the Life Cycle Assessment of electric batteries.
LIBS Economic and Logistic/Supply Disruptions Risks
Sun, Hao, Hartmann, Liu & Zhao (2019) developed an index of supply chain disruption probability – through supply chain concentration which and a Worldwide Governance Indicator –,considering the different stages of LIBS’s the supply chain, as well as different key materials (cathode oxide of cobalt, lithium, nickel, and magnesium). The research concluded that, for cobalt, the higher risk of disruption occurs in the first stage of the supply chain, i.e. the mining stage, while for Lithium nickel and magnesium the risk is higher in the downstream portion (refining and manufacturing). In addition, the study concluded that, overall, the supply risk is higher for cobalt, followed by Lithium and Magnesium, with Nickel being the material with the lower supply risk. Regarding the different supply chain stages, manufacturing presents a higher disruption risk followed by refining and mining.
Similarly to the previous study, Helbig, Bradshaw, Wietschel, Thorenz & Tuma (2019) assessed which factors may be related to LIB’s supply chain disruption, basing the evaluation on different energy storage devices and different key materials. The main factors identified were risk of supply
9 reduction, risk of demand increase, concentration risk and political risk. Furthermore, the idea of higher levels of risk associated with Lithium and Cobalt was corroborated.
Still related to supply chain disruption risk assessment, Graedel, Harper, Nassar, Nuss, & Reck (2015) performed a study on the case of several metals and metalloids, with the main identified causes being high geopolitical concentration, political instability and lack of suitable substitutes.
LIBS Social Sustainability
Thies, Kieckhäfer, Spengler & Sodhi (2019) presented a study that evaluated social hotspots across the Lithium-ion batteries supply-chain and discriminated them in three different dimensions: the portion of the supply chain; type of social issue risk and comparative risks in different supply chain configurations. Following this methodology, they were able to conclude, first and foremost, that, for all social issues analyzed, Chinese focused supply chain presents considerably more risk hours when compared with a Germany (western) focused configuration. Actually, the supply stages associated with occidental countries (battery cell production and battery assembly) only contributed to 1% of the total risk. Secondly, the paper concluded that mineral extraction and components production stages contribute the most to risk exposure. Finally, the study indicated that the risk level differs among different social issues, with differences up to the triple.
Another very insightful publication on the LIBS’ social issues is a technical report conducted jointly by Joint Research Centre, the European Commission’s science and knowledge service (2018) aiming to assess the social risks associated with the supply chain of raw materials in several economic sectors, such as mining and manufacture of non-metallic minerals, to both European and a set of non-European countries. To assess the supply risks, a set of social indicators were selected, related to working conditions, agents in the value chain and society. The analysis revealed social hotspots across the supply chain, identifying the sectors and locations that are generating the most negative social impact. Many relevant conclusions were drawn from this thorough study: First and foremost, the more concerning indicators are related with “fair salary”; “corruption”, “freedom of
10 association” and “health and safety”. Secondly, it was clear that specific regions are related to specific issues, such as South Africa with “Child labor”, China with “freedom of association and collective bargaining”. Finally, for almost all sectors covered by this study, the European Union represents significantly lower social risks when compared with other regions.
Continuing on social assessment publication, Amnesty International (2017) published a report which assessed the conditions in which Cobalt is being extracted in the country which represents the bigger share of cobalt production, Demo Rep Congo, achieving alarming results: many miners working without proper conditions, especially in illicit mines, without any government supervision or protection as well as without basic safety equipment as rudimental as masks or gloves, causing a continuous exposure to contaminated dust. This situation led to frequent cases of permanent health problems such as severe – and occasionally fatal – respiratory illnesses. More alarmingly, this work was found to be done also by children as young as seven years old. The paper also evaluated the level of compliance of 29 companies, in what regards the human rights due diligence suggested by the OECD (2016) to assess where the cobalt including in their operation has come from and the circumstances in which it was mined and traded. The study included companies from different stages of the supply-chain from refiners to “consumer-facing” brands, in which are included, most importantly Electrical Vehicles manufacturers such as BMW, Daimler, Fiat-Chrysler, General Motors, Renault, Tesla, and Volkswagen. To this regard, the results (which are an update from a previous identical study done two years before by the same organizations) which were partially obtained from direct questions to the different companies showed that none of the companies referred in the report are remotely close to complying with the aforementioned human rights due diligence on their cobalt supply chains.
Lastly, Reuter (2016) developed a methodology designed to assess different aspects of sustainability during the product design stage. The approach was applied to compare two different types of Lithium-ion batteries for electric vehicles.
11
Multi-Criteria Decision Analysis (MCDA)
MCDA can be described as techniques whose purpose is to help decision-makers dealing with complex decisions. Despite the existence of a wide variety of distinct particular MCDA approaches, the most common end purposes are related to the identification of a single most preferred option, in a given decision-making context; the ranking of the options and respective comprehensive evaluation or merely the distinction between acceptable or unacceptable alternatives (Communities, 2009).
MCDA approaches have been applied to an enormous set of different business areas such as finance/banking (Ferreira, Santos, Santos, & Spahr, 2014), governance/e-governance (Ramos, Vansnick, Costa-Lobo & Ramos, 2019) (Siskos, Askounis, & Psarras, 2014) or nuclear risk management(Morton, Airoldi, & Phillips, 2009).
In fact, Literature has become relatively extensive in what concerns the application of the Multi-Criteria Decision Analysis model to the context of supply-chain sustainability management, with more focus on the environmental and economic issues, as opposed to social matters.
MCDA Applied to Supply Chain Sustainability
Sarkis, (2003), used MCDA to develop a strategic decision framework, aiming to assist managerial decision making, enabling the evaluation of different alternatives concerning both performance indicators and green supply chain related criteria.
Similarly to the previous study, Chen, Shih, Shyur, & Wu (2012)developed Green supply chain management tool, based on different business functions (Green Purchasing, Design, Manufacturing, Marketing and service, and Green Strategy Alternatives) to be applied to the electronic industry, in order to solve selection problems and evaluate the impact in the business functions.
In another relevant publication, Chen, Wang, Yao, Li, & Yang (2018)developed a model to help in the decision-making process of supplier selection, taking into account social responsibility issues,
12 as well as economic, performance and environmental-oriented concerns. The proposed model is, then, applied to the Chinese food industry.
MCDA Applied to Supply Chain Sustainability in the Automotive Industry
MCDA approached have been also applied to sustainability issues in the automotive industry, as it is the case in a study conducted by Jasiński, Cinelli, Dias, Meredith, & Kirwan, (2018), in which it is conducted an evaluation of the security of several raw materials used in the automotive industry, based on a multi-criteria supply risk assessment model, allocating each material to a respective risk class.
In the next study, Kumar & Garg (2017) created a model to, managing uncertainty, identity, prioritize and evaluate social, environmental and economic indicators related with Sustainable Supply-Chain, with the intuit of enabling companies to create sustainability-oriented strategies and to implement them, following the prioritization of those indicators.
Finally, Stoycheva et al. (2018) applied MCDA as a tool to evaluate materials used by car manufacturers through sustainability performance criteria (based on the three-pillar approach to sustainability). This assessment is made for different sustainability objectives, meaning different weights concerning the different sustainability dimensions.
Research Gap/Proposition
The Literature review on the topic of social issues associated with LIBS production is conclusive, several sustainability issues emerge across its supply-chain. Such problems have been identified and their implications assessed. However, there is no literature on solution development. Consequently, in this paper, an MCDA approach will be developed, with the objective of creating a model based on social and performance indicators, to evaluate and rank different supply-chain stages alternatives. Logically, such a model’s intuit is to assist a given industry decision-makers managing the LIBS supply chain more sustainably.
13
Methodology
Indicator’s selection
The first step in the process of creating the proposed model was the definition of the indicators which, collectively, would generate a complete social assessment of a given product’s life cycle. In order to do so, two social databases were analyzed: Product Social Impact Life Cycle Assessment database (PSILCA) and Social Hotspot Database (SHSDB). Both these databases offer the possibility to have access to information on social aspects of products over their life cycles, providing data for a diverse set of indicators, in several industry sectors and different geographies (Psilca, 2018) (SHSDB, 2019). Even though these databases are not free of charge, the aforementioned article (Mancini, Eynard, Eisfeldt, Ciroth, Blengini, & Pennington, 2018) in which both were used, described which indicators they cover and how they are organized. In both databases, the data is arranged in a “tree-shaped” structure with three dimensions: The first dimension is “stakeholders”, such as “Workers”, “Local Communities”, “Value Chain Actors” and “Society” (for the case of the SHSDB); in the second level, each of the referred dimension is decomposed in a different set of impact categories, which are, in the third level, composed by different indicators. The decision was to adopt a structure similar to the one presented in the Social Hot Spot Database, which would aggregate nine impact categories combinedly composed by twenty-nine indicators. Given the fact that, as it was referred, the access to the databases was not granted, the data were individually sought in proper online sources, indicated in Appendix 1. Besides the social indicators, four performance indicators were also selected to be included in the model. The data source for these indicators was The 2019 Competitiveness Report (2019).
MCDA Selection
Once all the data was acquired, a specific multi-criteria decision analysis method had to be selected. Despite the Analytical Hierarchy Process (AHP) and Analytical Network Process (ANP) being the MCDA approaches most utilized for supply-chain applications (Chen, Shih, Shyur, & Wu, 2012)
14 (Zhang, 2016), the selected method was the Macbeth, due to several reasons: first and foremost, this method seemed more appropriate to cope with the complexity of the model to be designed, despite not being too complex to work with; on top of that, it is a tool that allows doing create numerical quantitative outputs with qualitative inputs, a feature that was later useful to cope with some lack of data; finally, although the complete version is not free of charge, a free version is available, which was the one applied to create the model. It is important no note, however, that the free version had a limitation that had a direct effect on the modeling process and the indicators included. As follows: Unlike the full version of the tool, the free version does not allow each model to have more than four indicators generation a model.
Modeling Stage (indicators)
Consequently, and in order not to overload the model, from the initial set of indicators, the sixteen more relevant were selected and configured in four groups (containing 4 indicators each) which were defined in such a way that the model would, despite having fewer variables, cover the best possible manner, the social issues which were proposed to be assessed. Each group of four indicators constituted a “sub-model” whose outputs were to be aggregated by the “overall model” in order to generate the final output. The sub-models and respective indicators are: Performance indicators – “Cost of doing business”, “Quality”, “Flexibility” and “Time to start a business”; Working Conditions Indicators – “Working time”, “Fatal Work Accidents”, “Non-Fatal Work Accidents” and “Industry Average Wage”; Societal Issues Indicators – “Corruption”, “Public Expenditure on Education”, “Literacy Rate” and Child Labour”; Freedom of Association and Collective Bargaining Indicators – “Right to strike”, “Right to Association” and “Right to Collective Bargaining”.
Modeling Stage (supply chain stage/materials)
Due to the referred model limitations, despite the existence of several key materials in LIBS, only the three most critical were incorporated in the model. Consequently, as the purpose of this model
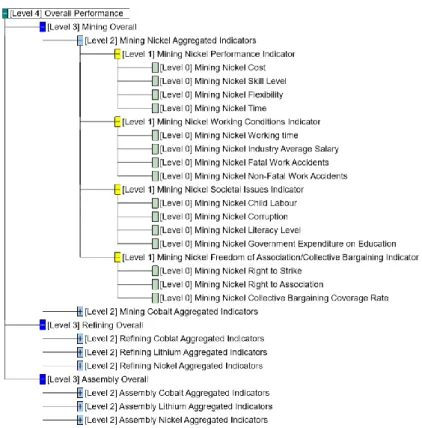
15 is to assess the social life cycle implication of the selected materials, Cobalt, Lithium, and Nickel, throughout the electric battery supply chain, the sub-model methodology was applied both to each supply chain stage (mining, refinery, and manufacturing) and to each critical material, generating an overall model configuration with four different levels: starting from the most broad level, the “overall performance” represents the overall score of a given supply chain configuration and it is composed by three sub-models, one for each supply-chain stage, which represent the score of a given supply chain configuration for that specific portion of the chain of processes (ex: Overall Mining). Each supply chain stage, by its turn, is composed of the three sub-models which represent the individual scores for a specific supply chain stage of a specific material (ex: Mining Nickel).
Figure 1 - Model Tree (Not fully decompressed)
Finally, each specific supply chain stage for a given material is divided among four different models which were already described in section in the previous section, which contains the defining criterion – indicators – (ex: Mining Nickel Performance Indicators). This generates a “value tree” of sub-models in which the decision variables of a given level Sub-model are the outcomes of the sub-models in the lower level (except the lower level sub-models whose variables are, as it was
16 referred, the indicators themselves). Figure 1 displays the model tree, not fully decompressed. The full model tree and sub-model identification can be found in Appendix 2.
Model’s Options
Once the model is designed, options must be introduced (in each sub-model) in order for them to be the object of the overall scoring. Each option represents, in this context, a supply chain geographical alternative for each stage and each of the materials. Hereupon, two alternatives were considered, the “current” and the “optimal”. The first one represents the supply chain configuration that is most used to produce Lithium-ion batteries and it is consistent to what was described in the Literature Review, with the mining of lithium being allocated to Australia, the extraction of Cobalt associated with Democratic Republic of Congo and The mining stage of Nickel allocated to the Philippines. Concerning the refining and manufacturing stage, China is the predominant location for all materials involved in the model. The second alternative consists of alternative regions which would presumably attenuate the social hotspot risk. Concerning the Mining stage and Refining stage, for all materials, the location chosen was Australia due to two main regions reasons: firstly, Australia possesses, for the three materials, reserves with dimension such that makes this country a viable option for these processes; Secondly, the Australian Government seems to be interested in attracting these kinds of activities to within its borders. It is important to notice that the sub-model “Mining Lithium” is not necessary as the most common country is Australia, which would be the alternative. Regarding the manufacturing stage, the idea was to allocate this activity to the country where the final vehicle was to be produced, assuming that this vehicle is being produced in a country that would represent lesser social risk than the one in the current supply chain configuration. For this specific model, the country chosen was Germany, as it is the bigger vehicle producer in Europe (Statista, 2019). With this configuration, for the refining and manufacturing stage, as the country options are the same for the three minerals, only one model per stage needs to be processed, as the
17 others will have the same results. A supply chain configuration of the option can be found in
Appendix 3.
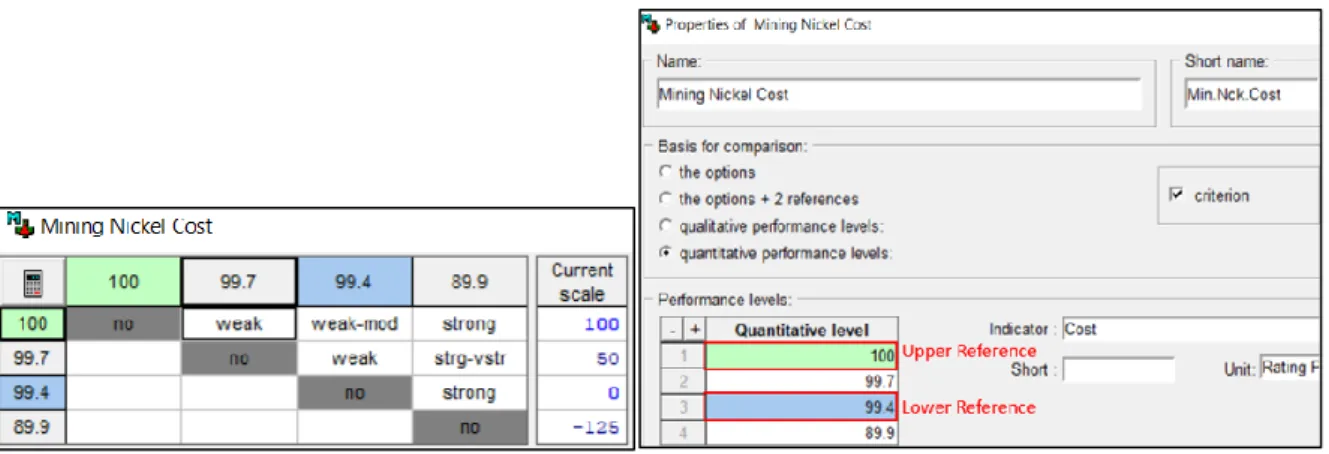
Following the introduction of the option, in each sub-model, depending on the material, supply chain stage and the indicators analyzed in the sub-model, the scoring of each option was due, as it is displayed in Figure 2. In Appendix 1, is displayed every indicator score for each country involved in the model.
Indicators Scoring
Performance levels: For the model be able to process the scores attributed to each section and come up to the option score for each sub-model, each indicator or defining criteria must be modulated. First and foremost, the basis of comparison must be selected. For all indicators, excluding Non-Fatal Work Accidents, the basis of comparison was “quantitative performance levels”, since the data collected was quantitative. Once this option is selected, the performance levels must be defined, including the “upper and lower references” which represent, in a simplified manner and respectively, a performance value above which the result is considered to be good and a performance which sets the minimum acceptable. For simplification, besides this upper and lower references, the score of each option was also added as a performance level, unless the option score and the upper or lower reference are the same, in which case no redundant performance level was added to the model. Figure 3 exemplifies the procedure for a given indicator.
Figure 2 - Option Scoring Example
Upper and lower references definition: The criteria for the definition of the Upper and Lower references differ between indicators. To exemplify, for the indicator “Fatal Work Accidents”, the Upper reference was the conceptual ideal solution in which no casualties would occur in the workplace, and the Lower reference was the world average number of casualties in work-related
18 accidents. Appendix 1 disclosures the upper and lower reference rationale for each of the indicators.
Figure 3 exemplifies the procedure for a given indicator.
Ranking within criteria: For the modeling of each indicator to be complete, it is mandatory to do a ranking within criteria, which consists in attributing a comparative evaluation between the defined performance levels, so that the model can interpret and give a final output score for each option in a given indicator. For every indicator, excluding “Government Expenditure on Education” and “Non-Fatal Work Accidents” (indicators furtherly explained in Appendix 1), the decision was to make this comparison assuming a proportionality in terms of performance level and score. Figure
4 exemplifies the procedure for a given model.
Figure 3 – Indicator Modulation Figure 4 - Ranking Within Criteria
Ranking between criteria: The final phase of the modeling stage is the ranking between criteria, in which it is possible to attribute different importance to the different indicators. This evaluation depends on one’s company objectives and priorities. For the purposes of this paper, equal weight was attributed to each indicator, in every model, as can be seen in Appendix 4.
Results
First Level Sub-Model: Starting with the analysis of the mining stage, for both Nickel and Cobalt, the “Optimal” option (Australia) revealed to be more socially sustainable, having positive results in all four sub-models, meaning that it complies with the acceptance level defined by the indicator’s “lower reference”. It is also pertinent to notice that for the “Working-Conditions” sub-model, this alternative achieved a result higher than 100, meaning that for these specific indicators, this supply
19 chain configuration has a higher overall performance, when compared with the “upper reference” requisites. Oppositely, the “Current” option (Philippines and Congo) achieved poor results, with negative outcomes in all sub-models, meaning that it does not comply with the “lower reference” overall performance level. Still concerning this supply stage, it is relevant to notice that the “optimal” option achieved higher results in the “Performance Indicators”, which reflect the ease of doing business.
Concerning the Refining stage, just as with the first stage, the “Optimal” option (Australia) attained better results in all four sub-models, despite some disparities: Although the “Optimal” configuration had a positive result in every sub-model, it did not achieve an overall outcome higher than the “upper reference” requisites in any category; contrarily to the Mining’s outcomes, the “Current” option (China) achieved a positive result in one sub-model “Societal Issues Indicators”.
Finally, in the assembly stage, the results were similar to the Refining stage: The “Optimal” option (Germany) achieved a better result in all sub-models. However, in this stage, the “Optimal” option did not have a positive outcome in the “Performance Indicators” sub-model. Furthermore, just as in the refining stage, the “current” option achieved a positive outcome in the “Societal Issues Indicators” sub-model.
Second and Third Level Sub-Model: Starting, once more, by the mining stage, the second level sub-model (which aggregate the individual indicators’ sub-models) reflect, as one would expect to analyze the results from the First level sub-model, that, for both the mining of Nickel and Cobalt, the “Optimal” option, corresponding to conducting the activities in Australia, is more socially sustainable than the “Current” option, which is associated with the Philippines and DR Congo, respectively. One can conclude that considering all materials in the model, that, overall, Mining is more sustainable in Australia, which is the outcome of the Third-level Sub-model (which aggregated the scored of each material).
20 Concerning the refining and manufacturing stage, since, for the three materials, the options are the same, as it was referred in the methodology, the results from the second and third sub-model are the same, and in line with the results from the mining stage: conducting these activities in Australia (Refining) and Germany (Manufacturing) is, more sustainable than doing them in China.
Fourth level Final Overall Model: The Overall model result is that a more western supply chain will be more socially sustainable than the current most common configuration for these practices.
Figure 5 displays an outcome example. The results for all models can be found in Appendix 5.
Figure 5 - Model Results Example Conclusion
The purpose of this paper was to assess social sustainability issues related to the production of LIBS batteries. In the paper development’s first stages, the Literature Review indicated that several sustainability issues arise from the different supply chain stages of such devices. Even though social issues are the ones that have been less targeted by researches, there is no room for doubt in what concerns their existence, especially in certain regions. In fact, the proposed model’s results were precisely aligned with such a premise, as, particularly in non-western regions, many different types of social issues arise from the production of LIBS components. However, the model also indicated that companies can, at the very least, attenuate these problems through sustainable supply chain management, reconsidering its suppliers or reconfiguration the locations of its operations, in order to generate a more western-oriented supply chain.
Limitations and Further Studies
Despite the benefits of the conducted model, some limitations affected its methodology and, if solved, the proposed model can be even furtherly enriched. First and foremost, the model would be
21 more user-friendly for its set up and interpretation of the software used was the full M-Macbeth version, to prevent the necessity of creating sub-models. Moreover, a full software version would not impose a limit on the number of variables, which was the case in the constructed model. Additionally, other critical materials such as magnesium and copper or additional supply chain stages related to reverse logistics (recycling) could be included in the model, without the creation of the new sub-models.
Concerning the gathered data, the model would be even more insightful if applied by a specific company, as it could module based on potential suppliers’ alternatives, enabling a much specific data collection. Concerning indicators themselves, a given company can define those which are more relevant for its business context, mission and value proposition as well as making the weighing between them accordingly.
Regarding the modeling stage, the ranking within criteria was done, as it was mentioned, following a direct proportion basis. However, it would add value if the weighing between scores in a given indicator, meaning the assessment the actual practical value of the different scores compared to each other was made by specialists who understand the indicators thoroughly and have experience and knowledge about its practical effects.
As this paper offered a methodology for supplier selection, it could be complemented with studies on how to, once the suppliers are selected and the supply chain composition is complete, coordinate it, aligning incentives and objectives, so that social sustainability can be pursued by every agent in every stage of the supply chain.
22
References
ACEA. (2014). “The Automobile Industry Pocket Guide”.
https://www.acea.be/uploads/publications/POCKET_GUIDE_2014_FINAL_102102.pdf Agusdinata, D. B., Liu, W., Eakin, H., & Romero, H. (2018). “Socio-environmental impacts of
lithium mineral extraction: towards a research agenda”. Environmental Research Letters, 13(12), 123001. https://doi.org/10.1088/1748-9326/aae9b1
Ahmed Ali, B. A., Sapuan, S. M., Zainudin, E. S., & Othman, M. (2015). “Implementation of the expert decision system for environmental assessment in composite materials selection for automotive components”. Journal of Cleaner Production, 107, 557–567.
https://doi.org/10.1016/j.jclepro.2015.05.084 Amnesty International. (2017). “Time to Recharge”.
https://www.amnesty.org/download/Documents/AFR6273952017ENGLISH.PDF Australian Bureau of Statistics, Australian Government. (2018). Retrieved from Abs.gov.au
website: https://www.abs.gov.au
Australia Unlimited. (2018). “The Lithium-Ion Battery Value Chain – New Economy Opportunities for Australia”.
https://www.austrade.gov.au/ArticleDocuments/5572/Lithium-Ion%20Battery%20Value%20Chain%20report.pdf.aspx
Benoît, C., & United Nations. Environment Programme. 2009. “Guidelines for social life cycle assessment of products”. Paris: United Nations Environment Programme.
Cambridge Dictionary. (2019). “SUSTAINABILITY”
https://dictionary.cambridge.org/pt/dicionario/ingles/sustainability
Carlos, Manuel, Ramos, I. A., & Vansnick, J.-C. (2019). “Multicriteria approach for strategic town planning: the case of Barcelos”. Core.Ac.Uk.
https://doi.org/oai:eprints.lse.ac.uk:22815
Chen, C.-C., Shih, H.-S., Shyur, H.-J., & Wu, K.-S. (2012). A business strategy selection of green supply chain management via an analytic network process. Computers & Mathematics with Applications, 64(8), 2544–2557. https://doi.org/10.1016/j.camwa.2012.06.013
Chen, Y., Wang, S., Yao, J., Li, Y., & Yang, S. (2018). Socially responsible supplier selection and sustainable supply chain development: A combined approach of total interpretive
structural modelling and fuzzy analytic network process. Business Strategy and the Environment, 27(8), 1708–1719. https://doi.org/10.1002/bse.2236
Communities. (2009). “Multi-criteria analysis: a manual”
https://www.gov.uk/government/organisations/ministry-of-housing-communities-and-local-government
Dehghani-Sanij, A. R., Tharumalingam, E., Dusseault, M. B., & Fraser, R. (2019). “Study of energy storage systems and environmental challenges of batteries”. Renewable and Sustainable Energy Reviews, 104, 192–208. https://doi.org/10.1016/j.rser.2019.01.023 Elkington, J. (1998). “Partnerships from cannibals with forks: The triple bottom line of
21st-century business”. Environmental Quality Management, 8(1), 37–51. https://doi.org/10.1002/tqem.3310080106
Ferreira, F. A. F., Santos, S. P., Santos, P. M. M., & Spahr, R. W. (2014). “How to create indices for bank branch financial performance measurement using mcda techniques: an
illustrative example”. Journal of Business Economics and Management, 15(4), 708–728. https://doi.org/10.3846/16111699.2012.701230
Fritsch, B., Schmidheiny, S., & Seifritz, W. (1994). “Towards an ecologically sustainable growth society: physical foundations, economic transitions, and political constraints”. New York: Springer.
23 Graedel, T. E., Harper, E. M., Nassar, N. T., Nuss, P., & Reck, B. K. (2015). “Criticality of
metals and metalloids”. Proceedings of the National Academy of Sciences, 112(14), 4257–4262. https://doi.org/10.1073/pnas.1500415112
Gemechu, E. D., Sonnemann, G., & Young, S. B. (2015). “Geopolitical-related supply risk assessment as a complement to environmental impact assessment: the case of electric vehicles”. The International Journal of Life Cycle Assessment, 22(1), 31–39.
https://doi.org/10.1007/s11367-015-0917-4
Global Partnership for Education. (2016). Retrieved from The Global Partnership for Education website: https://www.globalpartnership.org/
Goodland, R. (1995). “The Concept of Environmental Sustainability”. Annual Review of Ecology and Systematics, 26(1), 1–24. https://doi.org/10.1146/annurev.ecolsys.26.1.1
Goodland, R., & Daly, H. (1996). “Environmental Sustainability: Universal and
Non-Negotiable”. Ecological Applications, 6(4), 1002–1017. https://doi.org/10.2307/2269583 Helbig, C., Bradshaw, A. M., Wietschel, L., Thorenz, A., & Tuma, A. (2019). “Supply risks
associated with lithium-ion battery materials”. Journal of Cleaner Production, 221, 899– 903. https://doi.org/10.1016/j.jclepro.2019.03.062
ILOSTAT. (2018). Retrieved November 13, 2019, from ILOSTAT website: https://ilostat.ilo.org/ International Trade Union Confederation. (2019, December 18). Retrieved December 30, 2019,
from Ituc-csi.org website: https://www.ituc-csi.org/?lang=en
Jasiński, D., Cinelli, M., Dias, L. C., Meredith, J., & Kirwan, K. (2018). Assessing supply risks for non-fossil mineral resources via multi-criteria decision analysis. Resources Policy, 58, 150–158. https://doi.org/10.1016/j.resourpol.2018.04.011
Komornicki, S. (2017). Cone Communications. https://www.conecomm.com/research-blog/2017-csr-study
Krause, D. R., Vachon, S., & Klassen. (2009). “Special topic forum on sustainable supply chain management: introduction and reflections on the role of purchasing
management”. Journal of supply chain management, 45(4), 18–25. https://doi.org/10.1111/j.1745-493x.2009.03173.x
Kumar, D., & Garg, C. P. (2017). Evaluating sustainable supply chain indicators using fuzzy AHP. Benchmarking: An International Journal, 24(6), 1742–1766.
https://doi.org/10.1108/bij-11-2015-0111
Lélé, S. M. (1991). “Sustainable development: A critical review”. World Development, 19(6), 607–621. https://doi.org/10.1016/0305-750x(91)90197-p
Macombe, C., Leskinen, P., Feschet, P., & Antikainen, R. (2013). “Social life cycle assessment of biodiesel production at three levels: a literature review and development needs”. Journal of Cleaner Production, 52, 205–216. https://doi.org/10.1016/j.jclepro.2013.03.026 Mancini, L., Eynard, U., Eisfeldt, F., Ciroth, A., Blengini, G., & Pennington, D. (2018). “Social
Assessment of Raw Materials Supply Chains”. European Comission.
https://publications.jrc.ec.europa.eu/repository/bitstream/JRC112626/social_risk_technica l_report_third_review_round_final_18_01_19_online.pdf
Marsh, G. (2003). “Next step for automotive materials”. Materials Today, 6(4), 36–43. https://doi.org/10.1016/s1369-7021(03)00429-2
McKinsey. (2016). “Automotive revolution - perspective towards 2030 How the convergence of disruptive technology-driven trends could transform the auto industry.”
https://www.mckinsey.com/~/media/mckinsey/industries/high%20tech/our%20insights/di sruptive%20trends%20that%20will%20transform%20the%20auto%20industry/auto%202 030%20report%20jan%202016.ashx
McKinsey & Company. (2017). “Sustainability’s deepening imprint”.
https://www.mckinsey.com/business-functions/sustainability/our-insights/sustainabilitys-deepening-imprint
24 McKinsey & Company. (2017). “The automotive revolution is speeding up.”
https://www.mckinsey.com/industries/automotive-and-assembly/our-insights/the-automotive-revolution-is-speeding-up
McKinsey. (2019). “Race 2050 -a Vision for the European Automotive Industry”.
https://www.mckinsey.com/~/media/mckinsey/industries/automotive%20and%20assembl y/our%20insights/a%20long%20term%20vision%20for%20the%20european%20automot ive%20industry/race-2050-a-vision-for-the-european-automotive-industry.ashx
Mitchell, C., Ray, R., & Ark, B. (2015). “The Conference Board CEO Challenge: Creating Opportunity out of Adversity – Building Innovative, People-Driven Organizations”
https://www.conference-board.org/publications/publicationdetail.cfm?publicationID=2888¢erID=0 Morton, A., Airoldi, M., & Phillips, L. D. (2009). Nuclear Risk Management on Stage: A
Decision Analysis Perspective on the UK’s Committee on Radioactive Waste Management. Risk Analysis, 29(5), 764–779. https://doi.org/10.1111/j.1539-6924.2008.01192.x
OECD. (2016). “OECD Due Diligence Guidance for Responsible Supply Chains of Minerals from Conflict-Affected and High-Risk Areas”. https://www.oecd.org/daf/inv/mne/OECD-Due-Diligence-Guidance-Minerals-Edition3.pdf
Olivetti, E. A., Ceder, G., Gaustad, G. G., & Fu, X. (2017). “Lithium-Ion Battery Supply Chain Considerations: Analysis of Potential Bottlenecks in Critical Metals”. Joule, 1(2), 229– 243. https://doi.org/10.1016/j.joule.2017.08.019
Psilca. (2018). Retrieved December 30, 2019, from Psilca.net website: https://psilca.net/ Reuter, B. (2016) “Assessment of sustainability issues for the selection of materials and
technologies during product design: a case study of lithium-ion batteries for electric vehicles”. International Journal on Interactive Design and Manufacturing
(IJIDeM), 10(3), 217–227. https://doi.org/10.1007/s12008-016-0329-0 Riley, C. (2019). “The race to the electric car is just getting started.”
https://edition.cnn.com/interactive/2019/08/business/electric-cars-audi-volkswagen-tesla/ Sarkis, J. (2003). A strategic decision framework for green supply chain management. Journal of
Cleaner Production, 11(4), 397–409. https://doi.org/10.1016/s0959-6526(02)00062-8 Schwab, K. (2019). The Global Competitiveness Report 2019. Retrieved from World Economic
Forum website:
http://www3.weforum.org/docs/WEF_TheGlobalCompetitivenessReport2019.pdf SHDB. (2019). Retrieved December 30, 2019, from SHDB website:
https://www.socialhotspot.org/about-shdb.html
Sisco, C., Chorn, B., Peder Michael Pruzan-Jorgensen, United Nations, & Global Compact. (2011). “Supply chain Sustainability: a practical guide for continuous improvement”. New York: United Nations Global Compact.
Siskos, E., Askounis, D., & Psarras, J. (2014). “Multicriteria decision support for global
e-government evaluation”. Omega, 46, 51–63. https://doi.org/10.1016/j.omega.2014.02.001 Statista |Passenger car production by country 2018. (2018). Retrieved December 30, 2019, from
Statista website: https://www.statista.com/statistics/226032/light-vehicle-producing-countries/
Stoycheva, S., Marchese, D., Paul, C., Padoan, S., Juhmani, A., & Linkov, I. (2018). Multi-criteria decision analysis framework for sustainable manufacturing in automotive
industry. Journal of Cleaner Production, 187, 257–272. https://doi.org/10.1016/j.jclepro.2018.03.133
Sullivan, J. L., & Gaines, L. (2010). “A review of battery life-cycle analysis: state of knowledge and critical needs”. https://doi.org/10.2172/1000659
25 Sun, X., Hao, H., Hartmann, P., Liu, Z., & Zhao, F. (2019). “Supply risks of lithium-ion battery
materials: An entire supply chain estimation”. Materials Today Energy, 14, 100347. https://doi.org/10.1016/j.mtener.2019.100347
Thies, C., Kieckhäfer, K., Spengler, T. S., & Sodhi, M. S. (2019). “Assessment of social sustainability hotspots in the supply chain of lithium-ion batteries”. Procedia CIRP, 80, 292–297. https://doi.org/10.1016/j.procir.2018.12.009
Transparency International e.V. (2000). Transparency International - The Global Anti-Corruption Coalition. Retrieved from Transparency.org website: https://www.transparency.org/ University of Amsterdam – ICTWSS (2019). Retrieved from Uva-aias.net website:
http://uva-aias.net/en/ictwss
United Nations. (1987). “Our Common Future – Report of the World Commission on Environment and Development”.
https://sustainabledevelopment.un.org/content/documents/5987our-common-future.pdf US EPA, OA. (2018). “Sources of Greenhouse Gas Emissions”. US EPA.
https://www.epa.gov/ghgemissions/sources-greenhouse-gas-emissions
Volvo. (2019). “Electrification”. https://group.volvocars.com/company/innovation/electrification World Bank Group - International Development, Poverty, & Sustainability. (2016). Retrieved
from World Bank website: https://www.worldbank.org/
Zhang, J. (2016). Weighing and realizing the environmental, economic and social goals of tourism development using an analytic network process-goal programming approach. Journal of Cleaner Production, 127, 262–273.
26
Appendixes
Appendix 1 – Indicators and respective Country score, Lower/Upper, Sources and additional considerations
Concerning the Indicator “Non-fatal accidents”, the most recent year with data for all countries is 2002, which implies a significant time gap, therefore, instead of considering the specific data for that given year, a qualitative indicator was created through the creation of three different levels. Despite some possible evolution in the data from 2002 to the present year, most likely, the countries remain at the same level to which they were associated with the model.
27 Concerning the indicator “Government Expenditure on Education (%)”, It was not considered to be linear (as all other indicators were). Additionally, due to economic convergence dynamics, which are not the scope of this paper, the level of optimal Government Expenditure on Education differs from country to country. Regardless, OECD countries were taken as reference for the upper and lower references. It is also important to stress that the OECD Average as upper reference was, arguably, corroborated by the fact that it is very similar (difference of 0.5%) to average government expenditure on education considering the top 10 countries with better education (Partnership for education). For values higher than the upper reference, the non-linear variable set up in the performance levels implies a decrease in the score.
30 Appendix 3 – Model Options Supply Chain Configuration
31 Appendix 4 – Ranking Between Criteria
32 Appendix 5 – All models’ results
Model 1 – Mining Nickel Performance Indicator
Model 2 – Mining Nickel Working Conditions Indicator
Model 3 – Mining Nickel Societal Issues Indicator
Model 4 – Mining Nickel Freedom of Association and Collective Bargaining Indicator
33 Model 6 – Mining Cobalt Working Conditions Indicator
Model 7 – Mining Cobalt Societal Issues Indicator
Model 8 – Mining Cobalt Freedom of Association and Collective Bargaining Indicator
Model 9 – Refining Cobalt Performance Indicator
34 Model 11 – Refining Cobalt Societal Issues Indicator
Model 12 – Refining Cobalt Freedom of Association and Collective Bargaining Indicator
Model 13 – Assembly Cobalt Performance Indicator
Model 14 – Assembly Cobalt Working Conditions Indicator
35 Model 16 – Assembly Cobalt Freedom of Association and Collective Bargaining Indicator
Model 17 – Mining Nickel Aggregated Indicators
Model 18 – Mining Cobalt Aggregated Indicators
Model 19 – Refining Cobalt Aggregated indicators
36 Model 21 – Mining Overall
Model 22 – Refining Overall
Model 23 – Assembly Overall