UNIVERSIDADE DE ÉVORA
SCHOOL OF SCIENCE AND TECHNOLOGY
DEPARTAMENT OF PHYSICS
Modelization and Characterization of Photovoltaic
Panels
Md Tofael Ahmed
Supervisor: Mouhaydine Tlemçani, Ph.D.
Co-supervisor: Teresa Cristina de Freitas Gonçalves, Ph.D.
Masters in Solar Energy Engineering
Dissertation
Modelização e Caracterização de Panéis Fotovoltaicos
Dissertação realizada em regime de coorientação sob orientação do
Doutor Mouhaydine Tlemçani
e sob orientação do
Doutora Teresa Cristina de Freitas Gonçalves
Respetivamente, Professor Auxiliar e
Professor Auxiliar
Departamento de Física Escola de Ciências e Tecnologia
i
ABSTRACT
This work presents the characterization and modelization of photovoltaic panels in order to study their behaviors. Its purpose is to obtain an enhanced and more efficient parameters model of PV. It describes and implements their physical modeling and mathematical modeling. The effects of external and internal parameters variation on the panel is analyzed and briefly discussed. The produced model can be used for measuring and understanding the actions of photovoltaic cells for certain changes and parameters extraction. The white noise effect and its related output characteristics are explained. The curve fitting approximation with different polynomial method is shown. A non-iterative MPPT algorithm is proposed and implemented also. The simulation is achieved by using MATLAB and SIMULINK programming. An experimental work is also done in order to get the closure and insight about the produced model and to decide upon the validity of the discussed model and algorithm.
iii
RESUMO
O presente trabalho consiste na modelação e caracterização de painéis fotovoltaicos para estudar os seus comportamentos. Neste trabalho, propõe-se obter uma estimativo eficiente dos parâmetros que caracterizam o painel fotovoltaico. A modelação física e matemática do painel é descrita e implementada. O efeito que a variação dos parâmetros internos e externos apresenta é analisado e discutido. O modelo construído poderá ser utilizado para obter e compreender a descrição das células fotovoltaicas para determinadas variações, e para a obtenção de parâmetros. O efeito do ruído branco gaussiano e a potência resultante que lhe está associada são analisados. É implementado um ajuste da curva característica com diferentes métodos polinomiais. As simulações são realizadas recorrendo a programação em MATLAB e SIMULINK. É realizada uma experiência laboratorial como forma de conclusão da aplicação do modelo, de forma a poder analisar a validação do modelo e do algoritmo estudados.
v
ACKNOWLEDGMENTS
I would like to sincerely thank all of the people who directly or indirectly contributed to make this dissertation.
Foremost, I would like to express my sincere gratitude and thanks to my supervisor Professor Dr. Mouhaydine Tlemçani for his continuous support by providing great contribution, suggestion and motivation which are the main pillars of making the dissertation successful. His guidance helped me in all the time of research and writing of this thesis. I could not have imagined having a better advisor and mentor for my research. I also like to express my gratitude to my co-supervisor Professor Drª. Teresa Gonçalves for the continuous support of my masters study and research, for her patience, motivation, enthusiasm and immense knowledge. It is a great pleasure working with her.
A very special thanks goes to Professor Dr. António Heitor Reis for all of his unforgettable help in every steps of my masters study.
I also gratefully thank to the Erasmus Mundus ‘LEADER’ project for the funding of the work, ICT (Institute of Earth Sciences) of University of Évora for the help and space provided to enable the work. I am very thankful to André Albino, Masud R. Rashel, Ana Foles, Germilly Barreto, Isaias Gomes, Fahad Israr, Sergio Aranha and all other friends and colleagues who have motivated and supported me during the work.
Finally, my deepest gratitude goes to my parents, my wife Tania Tanzin Hoque and all of the family members for their extraordinary support and constant encouragement.
vii
C
ONTENTS
List of Figures ...ix
List of Tables ...xiii
Nomenclature...xv
Acronyms ... xvii
Chapter 1. INTRODUCTION ... 19
1.1 INTRODUCTION ... 19
1.2 LITERATURE REVIEW ... 23
1.3 AIM OF THE DISSERTATION ... 25
1.4 OUTLINE OF THE DISSERTATION ... 26
Chapter 2. PHYSICAL & MATHEMATICAL MODEL ANALYSIS OF PV PANEL ... 27
2.1 PHOTOVOLTAIC SYSTEMS & TECHNOLOGIES ... 27
2.1.1 Modeling of PV Systems ... 28
2.1.2 Solar PV Cell Characteristics ... 28
2.2 SEMICONDUCTOR & ITS PROPERTIES ... 29
2.2.1 Types of Semiconductors ... 29
2.3 SEMICONDUCTOR DIODES ... 40
2.3.1 Types of Semiconductor Diodes ... 41
2.3.2 Ideal Diode ... 41
2.3.3 I-V Characteristics of Junction Diodes ... 43
2.3.4 The Effects of Photovoltaic System ... 46
2.4 SOLAR CELL TECHNOLOGY ... 48
2.4.1 The Working Principles of a Solar Cell ... 49
2.5 PV CELL MODELS ... 51
2.5.1 Important Parameters of the Model ... 52
2.5.2 PV Cell Ideal Model ... 54
2.5.3 The single diode simple model ... 56
2.5.4 The Single Diode Full Model (Five-parameter model) ... 57
viii
Chapter 3. MEASUREMENTAND CHARACTERIZATION OF A PV PANEL ... 61
3.1 MODELING THE PV SYSTEM ... 61
3.1.1 Characterization of a PV Cell ... 61
3.1.2 Parameters Extraction of a PV Cell ... 65
3.2 PARAMETERS VARITION EFFECTS ANALYSIS ... 66
3.2.1 Simulation Parameters ... 66
3.2.2 Solar Radiation Variation Effects ... 69
3.2.3 Temperature Variation Effects ... 73
3.2.4 Series Resistance Variation Effects ... 76
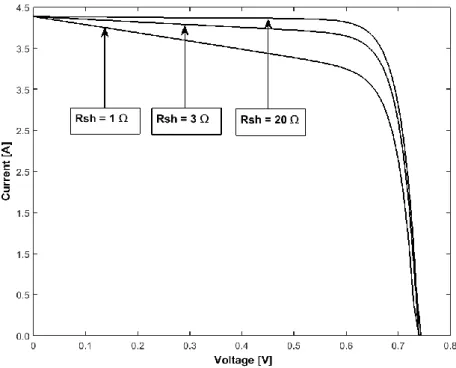
3.2.5 Shunt Resistance Variation Effects ... 79
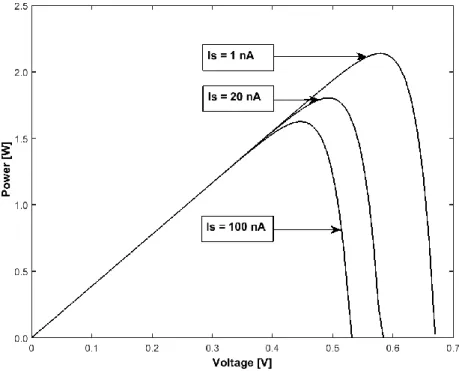
3.2.6 Saturation Current Variation Effects ... 82
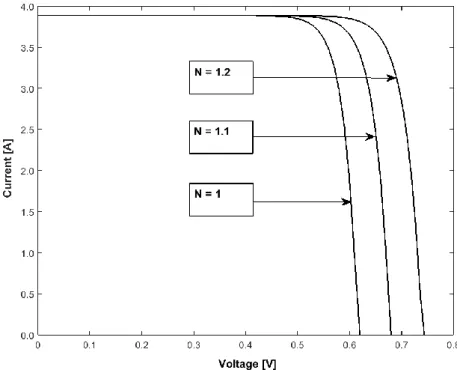
3.2.7 Ideality Factor Variation Effects ... 85
3.2.8 Simulation Parameters ... 88
3.2.9 I-V Curve (Current-Voltage) curve of a PV Cell ... 89
3.2.10 P-V Curve (Power-Voltage) curve of a PV Cell ... 90
3.2.11 Solar Radiation Variation Effects ... 91
3.2.12 Temperature Variation Effects ... 92
3.3 SIMULINK MODEL ... 94
3.3.1 Simulink Output... 94
3.3.2 Simulation Output ... 100
3.4 MEASUREMENTS WITH DATA ACQUISITION SYSTEM... 102
3.5 EXPERIMENTAL RESULT ANALYSIS ... 107
Chapter 4. NOISE ANALYSIS, CURVE FITTING AND NON-ITERATIVE MPPT ALGORITHM ... 113
4.1 NOISE ANALYSIS ... 113
4.2 CURVE FITTING APPROXIMATION ... 124
4.3 NON-ITERATIVE MPPT ALGORITHM ... 129
Chapter 5. CONCLUSION ... 142
Bibliography ... 145
ix
LIST OF FIGURES
Figure 1.1 – Total energy production by 2015 statistics ... 19
Figure 1.2 – Map of the World solar energy ... 21
Figure 1.3 – Solar installed capacity by region ... 22
Figure 1.4 – Solar cell commercial production per technology ... 23
Figure 2.1 – Classification of Photovoltaic Systems Technology ... 27
Figure 2.2 – A typical structure of a c-Si solar cell ... 32
Figure 2.3 – Power conversion efficiency as a function of semiconductor band gap ... 33
Figure 2.4 – The energy band diagram of a semiconductor ... 34
Figure 2.5 – Intrinsic Semiconductor energy band diagram ... 36
Figure 2.6 – Intrinsic energy band diagram (a) 0K (b) Temperature > 0K ... 36
Figure 2.7 – Extrinsic Semiconductor temperature conductivity with carrier concentration ... 38
Figure 2.8– Classification of Semiconductors ... 39
Figure 2.9 – Symbol for diode ... 40
Figure 2.10 – A Shockley diode ... 41
Figure 2.11 – Symbol of Shockley diode ... 42
Figure 2.12 – Circuit symbol of a diode ... 42
Figure 2.13 – Diode characteristics (a) Real diode (b) Ideal diode ... 43
Figure 2.14 – i-v characteristics of a diode ... 44
Figure 2.15 – i-v characteristics of a diode with all regions ... 45
Figure 2.16 – Photovoltaic effect principles ... 47
Figure 2.17 – Industrial level silicon solar cell ... 48
Figure 2.18 – Idealized solar cell structure Band diagram at the (a) open circuit conditions (b) Short circuit conditions ... 50
Figure 2.19 – (a) Photon Absorption (b) Thermalised part ... 51
Figure 2.20 – Ideal model of PV cell equivalent circuits ... 55
Figure 2.21 – Four-parameter model of PV cell equivalent circuit ... 56
Figure 2.22 – Five-parameter model of PV cell equivalent circuit ... 58
x
Figure 3.1 – Single diode cell equivalent circuit ... 62
Figure 3.2 – I-V curve of a solar photovoltaic cell ... 68
Figure 3.3 – P-V curve of a solar photovoltaic cell ... 68
Figure 3.4 – I-V curve for different solar radiation ... 70
Figure 3.5 – P-V curve for different solar radiation ... 72
Figure 3.6 – I-V curve for different cell temperature ... 74
Figure 3.7 – P-V curve for different cell temperature ... 76
Figure 3.8 – I-V curve for different Series Resistance ... 77
Figure 3.9 – P-V curve for different Series Resistance ... 78
Figure 3.10 – I-V curve for different shunt resistance ... 80
Figure 3.11 – P-V curve for different shunt resistance ... 81
Figure 3.12 – I-V curve for different saturation current ... 82
Figure 3.13 – P-V curve for different saturation current ... 84
Figure 3.14 – I-V curve for different diode ideality factor ... 85
Figure 3.15 – P-V curve for different diode ideality factor ... 87
Figure 3.16 – I-V curve of a solar photovoltaic cell ... 89
Figure 3.17 – P-V curve of a solar photovoltaic cell ... 90
Figure 3.18 – I-V curve for different solar radiation ... 91
Figure 3.19 – P-V curve for different solar radiation ... 92
Figure 3.20 – I-V curve for different cell temperature ... ..93
Figure 3.21 – P-V curve for different cell temperature ... ..93
Figure 3.22 – The main interface of the simulink PV system ... ..95
Figure 3.23 – Overall view of the PV system ... ..95
Figure 3.24 – The simulink diagram of the PV module ... ..96
Figure 3.25 – The simulink diagram of solar charge controller ... ..97
Figure 3.26 – The simulink diagram of management system ... ..97
Figure 3.27 – The simulink diagram of the used battery ... ..98
Figure 3.28– The simulink diagram of the loads with output power ... ..99
xi
Figure 3.30 – I-V curve from the simulink result... 100
Figure 3.31 – P-V curve from the simulink result ... 101
Figure 3.32 – Parts of a DAQ System ... 102
Figure 3.33 – Data Acquisition Model ... 102
Figure 3.34 – Signal Label Application Diagram ... 103
Figure 3.35 – NI USB-6009 Signal Labels ... 103
Figure 3.36 – NI USB-6008/6009 Signal Descriptions ... 104
Figure 3.37 – Used Function generator ... 104
Figure 3.38 – Circuit making ... 104
Figure 3.39 – Output figure I-V curve from the data acquisition system (Without Light) ... 105
Figure 3.40 – Output figure I-V curve from the data acquisition system (With Light) ... 106
Figure 3.41 – Signal generator ... 106
Figure 3.42 – GPIB Interface (NI) ... 107
Figure 3.43 – The used lamp as the source... 107
Figure 3.44 – The used PV module for experiment ... 108
Figure 3.45 – First output I-V curve from the PV system ... 108
Figure 3.46 – First output P-V curve from the PV system ... 109
Figure 3.47 – Second output I-V curve from the PV system ... 110
Figure 3.48 – Second output P-V curve from the PV system ... 111
Figure 3.49 – Comparison between two I-V curves ... 111
Figure 3.50 – Comparison between two P-V curves ... 112
Figure 4.1 – I-V curve of a solar photovoltaic cell ... 113
Figure4.2 – P-V curve of a solar photovoltaic cell ... 114
Figure 4.3 – Obtained I-V curve from experimental data ... 115
Figure 4.4 – Obtained P-V curve from experimental data ... 115
Figure 4.5 – I-V curve with noised data ... 117
Figure 4.6 – I-V curve with noise measured data ... 117
Figure 4.7 – P-V curve of noised data ... 118
xii
Figure 4.9 – I-V curve of noised data ... 120
Figure 4.10 – I-V curve with noised measured data ... 121
Figure 4.11 – P-V curve of noised data ... 121
Figure 4.12 – P-V curve with noised measured data ... 122
Figure 4.13 – I-V curve with 4th order polynomial fitting ... 124
Figure 4.14 – I-V curve with 4th order polynomial fitting ... 125
Figure 4.15 – P-V curve with 4th order polynomial fitting ... 125
Figure 4.16 – P-V curve with 4th order polynomial fitting ... 126
Figure 4.17 – I-V curve with 8th order polynomial ... 126
Figure 4.18 – I-V curve with 8th order polynomial fitting ... 127
Figure 4.19 – P-V curve with 8th order polynomial ... 127
Figure 4.20 – P-V curve with 8th order polynomial fitting ... 128
Figure 4.21 – MPP curve of a PV cell ... 129
Figure 4.22 – MPP curve of a PV cell from measured data ... 130
Figure 4.23 – Flowchart of MPP non-iterative method ... 131
Figure 4.24 – MPP curve of a PV cell obtained by non-iterative method ... 132
Figure 4.25 – MPP curve of a PV cell obtained by non-iterative method ... 133
Figure 4.26– MPP comparison for both side values ... 133
Figure 4.27 – MPP comparison for both side measured values ... 134
Figure 4.28 – Obtained MPPT from left side points ... 135
Figure 4.29 – Obtained MPPT using left side points from measured data ... 136
Figure 4.30 – MPP comparison for left side values ... 137
Figure 4.31 – MPP comparison for left side measured values ... 138
Figure 4.32 – Obtained MPPT from right side points ... 139
Figure 4.33 – Obtained MPPT from modified right side points ... 140
xiii
LIST OF TABLES
Table 2.1: Physical properties of a c-Si solar cell ... 31
Table 3.1: Typical Parameters ... 66
Table 3.2: Parameters Specifications ... 67
Table 3.3: Result Analysis of different Solar Radiation variation (I-V Curve) ... 71
Table 3.4: Result Analysis of different Solar Radiation variation (P-V Curve) ... 72
Table 3.5: Parameters Specifications ... 73
Table 3.6: Result Analysis of different temperature variation (I-V Curve) ... 75
Table 3.7: Result Analysis of different Shunt resistance variation (I-V Curve) ... 80
Table 3.8: Result Analysis of different Shunt resistance variation (P-V Curve) ... 81
Table 3.9: Result Analysis of different saturation current variation (I-V Curve) ... 83
Table 3.10: Result Analysis of different saturation current (P-V Curve) ... 84
Table 3.11: Result Analysis of different saturation current variation (I-V Curve) ... 86
Table 3.12: Result Analysis of different ideality factor (P-V Curve) ... 87
Table 3.13: Parameters Specifications ... 88
Table 3.14: Properties of used solar cell ... ..96
Table 3.15: Properties of used battery ... ..98
Table 3.16: Properties of used appliances ... 100
xv
NOMENCLATURE
CO2 Carbon dioxide [ppm]
GaAs Gallium arsenide [g/cm3] HgTe Mercury Telluride [g/cm3]
Ge Germanium [g/cm3] ZnS Zinc Sulfide [g/cm3] Cu2O Cuprous Oxide [g/cm3] NA Acceptor atoms [-] ND Donor atoms [-] D Diffusion coefficient [-] L Length [m]
EG Band gap energy [eV]
n Refractive index [-]
Ev Valence band [-]
Ec Conduction band [-]
Eg Energy gap [eV]
Τ Lifetime [s]
ni Intrinsic semiconductor
K Boltzmann constant [JK-1]
EF Fermy energy [eV]
h Planck´s constant [J.s] mh Effective mass of a hole [kg]
me Effective mass of na electron [kg]
Vt Thermal voltage [V]
Is Saturation current [A]
Iph Photo Current [A]
Ir Irradiance [Wm-2]
Iph,ref Referred photo current [A]
Tamb Ambient temperature [ºC]
Rs Series Resistance [Ω]
Voc Open circuit voltage [V]
xvi Rsh Shunt Resistance [Ω]
Imp Current at maximum point [A]
Vmp Voltage at maximum point [V]
N Diode ideality factor [-] Pmp Power at maximum point [W]
Ki Temperature coefficient [A/ºC]
Tnom Nominal temperature [ºC]
4th Fourth [-]
GREEK LETTERS
μ Diffusion mobility [-] hv Photon energy [J] α Absorption coefficient [-] Tα´ Relative temperature coefficient [ºC-1]
T
xvii
ACRONYMS
PV Photovoltaic
P&O Perturb and Observe
MPPT Maximum Power Point Tracking
MPP Maximum Power Point
NOCT Nominal Operating Cell Temperature
FF Fill Factor
DAQ Data Acquisition
DC Direct Current
NI National Instrument
USB Universal Serial Bus
19
Chapter 1.
I
NTRODUCTION
1.1
I
NTRODUCTIONThe capacity of a physical or biological system for change in a quantity is termed as Energy. The forms of energy can be mechanical energy, electrical energy, chemical energy, light energy etc. For every human activity it is required energy. For the growth of new industries and latest technologies the demand of energy is increasing. The dominant source of today’s energy is coal, oil and gas which are known as fossil fuels. Those sources of fossil fuels are being used traditionally from ancient time. Due to the increasing demand, after the World War II the nuclear energy started as an alternative and new source of energy [1].
The total primary energy production by 2015 is presented on Figure 1.1; it is found that the global primary production increases by 2015 is 0.8 % [2]. If we look at the figure we see that the energy production has an increasing tendency from the year 2000 to 2015. Nonetheless, the consumption is also increasing day by day.
20 In a statistics it is found that the world population will reach up to 10 billion in 2050 [1]. It is important to assure the high living standard by economical growth of the world growing population. For that we have to produce more energy by creating other sources. Now a days the major issues in the world are energy crisis and climate change. The change in climate and other environmental issues are occurring due to the use of fossil fuels in the industry mainly.
In order to reduce those problems we have to look for the renewable and sustainable energy production systems. Introducing and developing new energy producing systems can overcome the ongoing and upcoming problems. These sources of energy are very clean, abundant, and economical and they do not have any harmful impact on the environment as those sources do not emit CO2 gases [3].
The renewable energy sources are solar, wind, hydro geothermal, tidal and biomass energies. They are contributing with 22% to the total energy production in the world [1]. The important issues like global warming, environmental pollution, energy crisis and reduction of fossil fuels as energy can be solved through the development of sustainable energy systems. These energy sources are considered green, environment friendly and inexhaustible from the point of view of human civilization.
The main advantages of these energy sources over the traditional ones are reflected in a healthy effect on climate, no carbon emission and creation of new employment for the people. That’s why these sources of energy are growing rapidly. The energy production by this way can provide security of energy supply as consumers do not have to be dependent on any other source rather than natural resources [1].
Figure 1.2 shows the map of solar energy of the world. It indicates the sunlight intensity of the countries and continents in the world. Currently, China is considered the best country currently among all renewable energy investment ones. On the other side, because of the available sunlight, India has a great potential in the solar energy production. Some other countries are also on the top are Sweden, Denmark, Philippines, Brazil and the United States of America [4]. In a research it is found that the light amount the sun emits to the Earth is equivalent to the total energy consumed by us in a year [3]. The sun delivers 1.2×10¹⁴ kW power on Earth which is about 10000 times more than the present energy consumption.
21
Figure 1.2: Map of the World solar energy. [5]
The main benefit of the solar energy production is that it can occur without any consumption of fossil fuels, harmful noise and without any negative impact to the environment.
To ensure future carbon emission reduction and a sustainable environment for humankind we need to use the solar energy in electricity production. It also can be used for cooling, heating, lighting, transportation and environmental cleaning. It can also be used for drying of food, rice, green house production, etc. It is found that the global average solar radiation, per m2/year can produce the same amount of energy as 200 kg of coal, 140 m3 of natural gas or a barrel of oil.
By the end of 2015, global installed capacity of solar-powered electricity reached around 227 GWe. The powered electricity installed capacity is increasing exponentially. The solar-powered electricity production is 1% of the all electricity used globally. The leading countries in solar energy technologies are Germany, China, Italy and the United States. There are two main types of solar energy technologies: photovoltaic energy and thermal energy [5].
Solar energy electricity production can be obtained by two processes:
º Direct electricity conversion from sunlight by using semiconductor devices named solar cells.
º Heat accumulation in solar collectors.
Nonetheless, the electricity production and use of solar energy depends on the availability of solar resource and solar installed capacity.
22 Figure 1.3 shows the Solar installed capacity by region. The top value is from Europe with 43.7%, then East-asian countries with 35.2%. The next regions are North America, south East Asia and pacific, south and central Asia, Africa, Latin America & the Caribbean and Middle East and North Africa.
Figure 1.3: Solar installed capacity by region. [5]
Photovoltaic technology has been developed in recent years. The reason for the rapid growth of solar photovoltaic technology is that it is long lasting, maintenance free and environment friendly. Even though there is variability in solar radiation and environmental parameters which causes random power output, it is becoming more and more popular due to its flexibility [6]. The technological and environmental benefits are a blessing for the humankind. A photovoltaic (PV) system converts electricity using PV cells. The grouping of cells may be from panels or arrays in the system. The main unit of a PV system is the photovoltaic cell.
There are three types of solar photovoltaic cells in the market today. They are monocrystalline silicon, polycrystalline silicon and thin film technology. The monocrystalline silicon cell is the traditional technology in the solar PV system; monocrystalline modules are formed by assembled cells and those are produced by cutting a piece of continuous crystal.
The composition of polycrystalline solar cell is almost the same as monocrystalline except that instead being grown into a single crystal, it is melted and poured into a mold.
23 The thin films cells are known as amorphous silicon, which means they are not crystalline. The active material can be silicon or may be a more exotic material like cadmium telluride for example. By using plastic glazing it can be more lightweight and flexible. The commercial production of solar cells is shown in the figure 1.4. From the chart we can see that monocrystalline and polycrystalline are the most produced solar cells.
Figure 1.4: Solar cell commercial production per technology. [1]
1.2LITERATUREREVIEW
Energy is a basic need for civilization and for the development of the society. In the book of Zeman [1] the increasing demand of energy, the primary and traditional source of energy, the prediction of upcoming renewable energy demand and the vast usefulness of the energy are explained clearly.
In order to have a clear idea about the current situation of energy production we studied the report from Enerdata [2]. The advantages of using renewable energy sources and disadvantages of using fossil fuels are stated in the work of Pranahita et al [3]. They [3]- [7] also discussed about the huge scope of solar energy in the Earth. The report of ‘International Energy Partnership’ [4] mentions the top countries with potential solar energy production. Before
24 starting the study and characterization of PV cell it is important to have wide idea about different types of cell. The types are explained in the report of REN 21 [5].
In chapter 2 we analyse and discuss mainly photovoltaic systems & technology, the PV system classification and modelling and solar PV characteristics. Sera [8], Tarek et al [9]and, Ma et al [7] describe different types of cell models like, for example, single diode model and double diode model.
We discuss semiconductor and its properties also in chapter 2. In NCERT report [10] semiconductor is discussed and in Zeman’s book [11] they mention the typical structure of a solar cell. In the paper of Hu [12] they explain electrons and holes in semiconductor and in William et al [13] they clarify the p-n junction of solar cells. In the paper of Lu [14] various types of diodes, its applications and relationship with I-V and P-V characteristics are described.
After analyzing the different types of models we discuss the various external and internal parameters of the PV cell. All parameters are explained briefly in the paper of Tian et al [15], Masters and Gilbert [16] and Soto et al [17]. For PV cell modeling purpose it is necessary to know the parameters and its characteristics. In the paper of Rodrigues et al [18] they analyze the PV cell ideal model, several parameters variation effects and also the single diode simple model. Before starting the characterization we started to analyse different types of PV cell models. In this paper of Dolara [19] the single diode simple model is characterized, I-V characteristics of that model are presented and different physical models are compared.
In chapter 3 we discuss the PV system modelling, PV cell characterization, parameters extraction, and parameters variation effect with simulated and measured data. In the paper of Ahmed et al [20], Salmi et al [21], Ahmed et al [22] the single diode model of PV cell is used to characterize the solar photovoltaic cell. We explain the reason for using a numerical solution for modelling we start with the mathematical model and then figure out the parameters extraction from five parameters model. A vast parameters extraction process is discussed in this paper of Sera et al [23].
Then, we describe the parameters variation effects on solar photovoltaic cell. Firstly, we considered the external parameters for simulation purpose like variation of solar radiation and temperature. The external parameters variation effects are specifically stated in the paper of Mostafa and Naderi [24] , in Salim et al [25] and Islam et al [26] paper. We present a brief study and simulation of internal parameters variation effects on a PV cell also. Chenni et al [27],
25 Longatt and Francisco [28], Kachiya and Lokhande [29], Ahmed et al [20], Salmi et al [21] discuss in detailed the MATLAB modeling for various external parameters. We consider two numerical solution and its characteristics for the model. In the paper of Ana et al [30] the various characteristics for convergence speed optimization of iterative methods are described.
In order to obtain the I-V and P-V curve from measured data, we worked with a Data Acquisition System (DAQ) (using signal generator) and a General Purpose Interface Bus (GPIB). We took two samples in order to have more accuracy on measuring. We obtained related output figures characteristics using MATLAB from measured data.
In chapter 4, we discuss noise analysis for different situations of a PV cell, curve fitting approximation by more than one polynomial fitting method and, more importantly, we discuss and use a non-iterative MPPT algorithm method. Ahmed et al [31] describe the noise data approximation on various conditions and curve fitting of different order of a PV cell. Esram and Chapman [32] discuss different Maximum Power Point Tracking (MPPT) techniques. All the techniques are taken by reviewing the earliest literature.
In the paper of Hamidon et al [33] perturb and observe (P&O) MPPT algorithm in MATLAB with photovoltaic array modelling is described. Ahmed et al [34] describe a non-iterative algorithm for MPPT finding of a PV cell. MPPT finding by positioning the points on power-voltage curve is also discussed.
1.3 AIM OF THE DISSERTATION
The aim of this dissertation is to contribute to the research and development of the solar photovoltaic system technology. The main purpose is to increase the effective efficiency of PV panels by adding new features and making significant changes in the solar photovoltaic technology. The characterization and modelization of PV modules, important to increase the effectiveness of their devices, is the main motivation of the dissertation. A proposal and implementation of maximum power point tracking (MPPT) algorithm is discussed in order to track the maximum power point (MPP) for having an efficient PV technology.
26 1.4 OUTLINE OF THE DISSERTATION
The dissertation is structured in five chapters organized as follows:
In Chapter 1, a general introduction of renewable energy and specifically solar photovoltaic system are presented with statistical data. A brief literature review is given and explained.
Chapter 2 presents an overview of PV systems and technologies with its modelling and cell
characteristics. Semiconductor properties, the PV effects with solar cell technology and several mathematical and physical model of PV cell are discussed here.
Chapter 3 gives the outline of measurement and characterization of PV panels. PV system
modelling with description of characterization is described here. Parameters variation effect for several parameters like solar radiation, temperature, series resistance, shunt resistance and diode ideality factor is shown. Measurement with data acquisition and an experimental test results are considered for the characterization.
Chapter 4 is composed of noise analysis, curve fitting method and MPPT algorithm. Noise
effects on I-V and P-V curves are analysed. A curve fitting algorithm with several polynomial methods is used. A non-iterative MPPT method is proposed and implemented here.
In Chapter 5 the main conclusions are presented. Future research and improvement with suggestions are proposed.
27
Chapter 2
.
P
HYSICAL
&
M
ATHEMATICAL
M
ODEL
A
NAL
YSIS
OF
PV P
ANEL
2.1 PHOTOVOLTAIC SYSTEMS& TECHNOLOGIES
Photovoltaic systems are the composition of several interconnected components. They are designed to fulfill specific purposes like powering small devices in off-grid solar system where electricity (grid line) is difficult to access. Also, they are used to feed the electricity into the main distribution grid [35]. According to the use of solar photovoltaic system, they can be classified into two different types: grid-connected solar PV system and stand-alone solar PV system. The other general subtypes are described and classified in the figure 2.1. The significant difference between the two types is that in a stand-alone system the photovoltaic energy and load demand are in phase but in a grid-connected one they are not in phase. Grid-connected systems are divided into direct and indirect systems; stand-alone systems are divided into with storage, without storage and hybrid system. In stand-alone systems, batteries are used for storage mostly; hybrid systems use other power sources like wind or diesel generator in combination with photovoltaic system.
Figure 2.1: Classification of Photovoltaic Systems Technology. Photovoltaic Systems Grid-conneted Systems Directly Connected to Grid Connected via House Grid Stand-alone Systems With Storage
Appliances Ac Stand-alone
Small Applications
Dc Stand-alone
Without Storage Systems Hybrid
With Wind Turbine With Diesel Generator With other cogeneration Engines
28
2.1.1 Modeling of PV Systems
To predict the behavior and power output of a PV cell, modeling is mostly necessary and greatly important. The prediction is required in a PV system for various internal and external parameters conditions [8]. The environmental parameters like irradiance and temperature are considered external parameters.
Wind, humidity, dust can also be considered as environmental parameters in a greater context. Attention is given mostly on the behavior of the current-voltage (I-V) and power-voltage (P-V) curve in order to achieve the maximum output power. The main purpose of modelling is to produce I-V and P-V curves, obtaining maximum power output using a generalized model, module effectiveness on a PV system, its characterization and analysis of the performance under different PV panel behaviors.
2.1.2 Solar PV Cell Characteristics
The basic unit of an electrical energy production system using solar energy is termed as solar cell. It produces electrical energy without using any intermediate process. The working procedure of a solar cell depends on the photovoltaic effect. Hence, a solar cell is also known as photovoltaic cell. The electricity production procedure of PV cell relies on the photoelectric effect and the key ingredient of a solar cell is the semiconductor. The mostly used semiconductor for PV cell is silicon.
The basic properties of silicon that makes it the main component of a solar cell are the metal properties and some of those of an electrical insulator. Now a-days, almost all the solar cells electricity production mechanism; like absorption of photons that results in the generation of the charge carriers, and subsequent separation of the photo-generated charge carriers depend on the semiconductors materials.
All the semiconductors materials used to convert photon energy into electrical energy have advantages and drawbacks. The most important parts of the solar cell are discussed in the next part.
29 2.2 SEMICONDUCTOR& ITS PROPERTIES
The materials whose electrical properties lie between conductors and insulators are known as semiconductors. Silicon and Germanium are the best examples of semiconductor. A semiconductor can be defined in terms of energy bands. In semiconductor materials have almost an empty band and almost filled valence band with a very narrow energy gap separating the two bands [10] .
2.2.1 Types of Semiconductors
The best-known semiconductors types are explained next:
2.2.1.1 Elemental Semiconductors
The element silicon (Si) is the best known semiconductor. It is the prototype of a large class of semiconductors with similar crystal structures like the Germanium (Ge). It is surrounded by four nearest neighbor atoms (each atom is said to be four-fold coordinated) resulting in a tetrahedron form. The mainstay of the electronics industry and the cornerstone of modern technology are formed by the tetrahedral bonded semiconductors [36].
2.2.1.2 Binary Compounds
Elements from the groups III and V of the periodic table (such as GaAs) are responsible for forming compounds and have similar properties to their group IV counter-parts. From the group IV elements to the III-V compounds, the bonding becomes partly ionic due to the transfer of electronic charge from the group III atom to the group V atom [36]. There are significant changes in the semiconductor properties due to ionicity causes. The effects of the ionicity are mainly that it increases the Coulomb interaction between the ions and also the energy of the fundamental gap in the electronic band structure. In the II-VI compounds (for example ZnS) the ionicity becomes even larger and more important; as a consequence of the larger ionicity, most of the II-VI compound semiconductors have bandgap larger than 1 eV. Mercury telluride (HgTe) is an exceptional compound semiconductor, which has actually a zero bandgap (or semimetal) similar to gray tin. For the potential application of displays and lasers the large band gap like II-VI compound semiconductors are used. Among the I-VII compounds semiconductors many of them are regarded as insulators rather than semiconductors.
30
2.2.1.3 Oxides
Most oxides are found as good insulators but some like CuO and Cu2O are very well known
semiconductors. Though cuprous oxide (Cu2O) is considered as mineral (cuprite) it is also a
classic semiconductor with extensive semiconductor properties. As oxide semiconductors are not well understood with regard to their growth process, they have a very limited scope of applications now a-days [36]. With the exception in the II-VI compound zinc oxide (ZnO), their main application is as a transducer or as an ingredient of adhesive tapes and sticking plasters. With the discovery of superconductivity in many oxides of copper the situation has changed.
2.2.1.4 Layered Semiconductors
Many semiconductors like lead iodide (PbI2), molybdenum disulfide (MoS2) and gallium selenide
(GaSe) are classified according to their layered crystal structures. Typically there is a covalent bonding within the layers much stronger than the van der Waals forces between the layers. These layered semiconductors are very important and interesting due to the quasi-two-dimensional behavior of electrons in the layers [36]. With the process of intercalation the interaction between layers can be modified; the intercalation states by incorporating foreign atoms between the layers in a process.
2.2.1.5 Organic Semiconductors
There are many organic compounds which are considered semiconductors like, for example, polyacetylene [(CH2)n] and polydiacetylene. Though organic semiconductors are not yet used in
electronic devices, but they have great possibilities for future applications. The main comparison between organic and inorganic semiconductor is that the organic can be easily fitted to the applications. For example, some compounds that contains conjugate bonds, such as –C=C-C=, have large optical nonlinearities and therefore may have important applications in optoelectronics [36]. Another advantage is that, by changing their chemical formulas, the band gap of these compounds can be changed more easily than the inorganic semiconductors to suit the application.
2.2.1.6 Magnetic Semiconductors
There are many compound semiconductors which contain both semiconducting and magnetic properties like, for example, europium (Eu) and Manganese (Mn). They contain magnetic properties due to their magnetic ions. These magnetic semiconductors include EuS and alloys.
31 The latter compounds exhibit different magnetic properties like ferromagnetism and antiferromagnetism. The magnetic alloys semiconductors which contain lower concentrations of magnetic ions are known as dilute magnetic semiconductors [36]. Because of the alloys potential applications they recently became attract and were given much attention. The Faraday rotations of these alloys are larger than those of the nonmagnetic semiconductors and it can be up to six orders; as a result of those properties these materials can be used as optical modulators based on their large magneto-optical effects.
2.2.1.7 Other Miscellaneous Semiconductors
There are some other semiconductors that cannot be classified in accordance with the above-explained ones. SbSI can be a good example of it; it exhibits Ferro-electricity at low temperatures [36].
There are compounds with the general formula I-III-VI2 and II-IV-V2 crystalline in the chalcopyrite
structure. For example AgGaS2 is interesting for its nonlinear properties, CuInSe2, useful for solar
cells. Other groups of compound semiconductors have many interesting properties but they were not given much attention due to their limited applications. The existence of those semiconductors with interesting properties shows that the future of the field of semiconductor physics has plenty of room for growth and expansion. Table 2.1 shows the physical properties of the c-Si solar cells.
Table 2.1: Physical properties of a c-Si solar cell.
Name Description Unit
Doping Type p-type N/A
Thickness 300 [μm]
Area 10 × 10 or 12.5 × 12.5 [cm2]
Top side doping n+ type N/A
Back side doping p+ type N/A
Reduced thickness 250 [μm]
32 The most important and used semiconductor for a solar cell is the crystalline (c-Si) cell, and, presently, it is dominating the PV market. It is preferred over others due to its simple structure and it is a good example of a typical solar cell structure [11].
Figure 2.2 it explains the physical properties of a c-Si solar cell. On the top which has front contact of metal grid, there are serial connections to the back contact of the next cell. Then there is an antireflection coating which is in blue color. There are n-type and p-type layer which consists of p-n junction in contact with the back contact.
Figure 2.2: A typical structure of a c-Si solar cell [11].
Solar cells consist of two layers and they are top and bottom metallic grid. The bottom metallic grid can be an electrical contact which is responsible for the collection of the separated charge carriers and make a connection with the cell to a load. In order decrease the reflection of sunlight from the cell, usually a thin layer is used as an antireflective coating which covers the topside of the cell. With the purpose of protecting the cell from the effects of the external environment while operating it is required to attach material in the both side of the cell. The material can be a glass sheet or other type of transparent material for encapsulating.
For the thin film solar cells the deposited layers for constituting the cell are on a substrate carrier. A large range of low-cost substrates for example glass sheet like, for example, metal or polymer foil are used when the processing temperature is low during the deposition of the layers.
As already mentioned, the most widely used PV material is the c-Si solar cell and it is the first successful solar cell made. In order to explain the semiconductor properties that are related to basic solar cell operation it is important to use c-Si. The purpose of explaining is to have
33 knowledge and basic understanding of how solar cells based on other semiconductor materials work. The main semiconductors parameters that are responsible for the design, objectives, performance and efficiency of the solar cell are [1]:
(i) The concentrations of doping atoms determine the width of the space-charge region of a junction. The concentrations of doping atoms are classified into two different types: that one; that donates free electrons is called donor atoms, ND, and that one that
accepts electrons is known as acceptor atoms, NA.
(ii) Transport carriers characterization of charge carriers due to drift and diffusion is caused due to mobility, μ, and diffusion coefficient, D respectively.
(iii) The characterization of the recombination-generation processes happen due to the lifetime, τ, and diffusion length, L, of the excess carriers.
(iv) The absorption ability for visible and other types of solar radiation of a semiconductor is characterized by the band gap energy, EG, absorption coefficient, α, and refractive index,
n.
Semiconductor bandgap and solar cell efficiency figure is presented on Figure 2.3:
34 The conductivity of a material depends on the value of band gap energy. The concept of energy bands is important to describe the conductivity, semi-conductivity and non-conductivity of a material. Generally, the electrons have the tendency to fill up the low energy bands first. The more completely a band is filled, the lower energy they have. Most of the energy band in a semiconductor will be totally filled at absolute zero but, the energy bands at higher level are totally empty basically [38]. Close to the totally empty and totally filled part there are two bands that are nearly empty and nearly filled.
The top nearly filled is known as valence band, the lowest nearly empty band is known as conduction band. The gap between the two bands is known as band gap. In the totally filled band there is no flow of current because there is no net velocity. On the other side, the totally empty band does not contribute to current conduction. So, these are the reasons for the contribution of current flows in a semiconductor between valence band and conduction band. Figure 2.4 presents the energy band diagram, where Ev is the valence band, Ecis the conduction band andEg is the energy gap.
Figure 2.4: The energy band diagram of a semiconductor [12].
The band gap energy is defined by the difference between the conduction band and the valence band as shown in equation 2.1:
g c v
E = E - E (2.1)
The band gap energy is important for semiconductor materials. For the silicon it is about 1.1 eV. The electrons in the conduction band are conduction or mobile electrons and the electrons in the valence band are in covalent bonds. The band gap energy has strong influence and hold on the characteristics of the semiconductor devices. It can be shown with measurement of the absorption of light by the semiconductor as a function of the photon energy, hv. The absorption
35 of light depends on the difference between photon energy and band gap energy. The light is tightly absorbed when photon energy is larger than band gap energy. Electron-hole pair is created by the consumption of the absorbed photon [12].
The semiconductors have two types usually. Those are:
(1) Intrinsic or pure semiconductors.
(2)Extrinsic or impure semiconductors.
Extrinsic semiconductors are classified into two parts:
(i) N-Type Semiconductor. (ii) P-Type Semiconductor.
(1) Intrinsic Semiconductor
The semiconductors that do not contain impurities are intrinsic semiconductors. It means that an intrinsic semiconductor is one that is in its extremely pure form. This type of semiconductor is chemically pure, meaning that it’s free of impurities and undoped. They do not contain electrons and holes as well. It is also known as i-type semiconductor. In this type of semiconductor, no electron is available at absolute zero temperature. Examples of such semiconductors are: pure germanium and silicon that have forbidden energy gaps of 0.72 eV and 1.1 eV, respectively.
Due to the very small energy gap many electrons that gains sufficient energy can jump across the small gap between the valence and conduction bands in room temperature. The identification symbol of intrinsic semiconductor is ni which refers it as the intrinsic carrier
density.
Figure 2.5 describes the energy band diagram of an intrinsic semiconductor at room temperature. The two levels are the conduction band and the valence band. There is a level between these two levels called Fermi level.
36
Figure 2.5: Intrinsic Semiconductor energy band diagram.
Figure 2.6 describes the energy band diagram for an intrinsic semiconductor at 0K and at greater than 0K temperatures. The two energy bands are the conduction band and the valence band. Between these two bands there is a gap called forbidden energy gap.
Figure 2.6: Intrinsic energy band diagram (a) 0K (b) Temperature > 0K [13].
At 0K there is no movement of the electron from one band to another because there is not sufficient energy to move the electron and it cannot break the bonding of energy level. If we look at the figure (b) we can see that few electrons move from valence to the conduction band; this happens due to the input temperature because the temperature make the electrons excite, break the energy bonding and move to the conduction band, thus generating free empty spaces. This means that in the intrinsic semiconductor temperature has a great influence and the intrinsic carrier has great dependence on the temperature as well. The intrinsic carrier density temperature dependence is dominated by the exponential dependence on the band gap. The
37 temperature dependence of the effective densities of states and of energy band gap should be considered also. There is also a temperature dependence on the effective masses but it is not considered here as it is too small compared to the others.
The charge carrier densities in intrinsic semiconductors can be mathematically given by equations 2.2 and 2.3 where
c
N = the effective densities if states in the conduction band.
v
N = the effective densities of states in the valence band.
k = 1.38 × 10⁻²³ JK-1 is the Boltzmann constant T = the temperature
F
E = the Fermi energy.
Ev = the energy level of valence band.
Ec = the energy level of conduction band. h = 6.624 × 10⁻³⁴ Js is the Planck constant.
h
m = the effective mass of a hole.
2 F c e i c c 3 E - E 2 π m kT 2 n = N exp where, N = 2 kT h (2.2) 2 v F h i v v 3 E -E 2 π m kT 2 p = N exp where, N = 2 kT h (2.3)
38 In conclusion we can say that it is very difficult to make an intrinsic semiconductor. For constructing such a semiconductor we need highly pure materials.
(2) Extrinsic Semiconductor
An extrinsic semiconductor is created by doping of an intrinsic semiconductor. Doping is the introduction of impurity atoms that can add electrons or holes doping [12]. The properties of the extrinsic semiconductor are:
I. The number density of electrons is not equal to the number density of holes. II. It is introduced with the process of doping.
III. In this type of semiconductor the electrical conductivity is high.
IV. The amount of impurity and the temperature of the semiconductor define the electrical conductivity.
V. At room temperature the conductivity is very low.
Extrinsic Semiconductor Temperature variation of Conductivity is shown in Figure 2.7:
39 Extrinsic semiconductors are divided in two kinds:
1. n-type semiconductor
This is the type of semiconductor that provides extra electrons to the host. An n-type dopant is called donor. Those are group V impurities such as Antimony, Phosphorous, Arsenic etc. An n-type dopant possesses five valence electrons and each atom tries to have a covalent bonding with five lattice atoms. This leaves an excess electron for every impurity atom in group IV matrix.
2. P-type semiconductor
A p-type semiconductor is produced by adding an acceptor impurity like gallium, boron, or indium to an intrinsic semiconductor. A p-type dopant is called acceptor. A p-type dopant possesses three valence electrons and each atom tries to have covalent bonding with three host atoms. The unmade bond that it leaves behind creates an excess hole for every impurity atom in group IV matrix. The main production of a p-type semiconductor occurs with doping an intrinsic semiconductor. P-type has holes dominate conduction process.
A classification of semiconductors is presented in figure 2.8:
Figure 2.8: Classification of Semiconductors.
Semiconductor
Intrinsic Extrinsic
n-type
40 2.3 SEMICONDUCTOR DIODES
One of the simplest and most useful of all semiconductors is diode. For a wide range of applications many types of diodes are used. A semiconductor diode device has a fundamental two-terminal electronic element similar to a resistor in linear circuits. It conducts the current in only one direction. We know that the current-voltage (I-V) relationship of a resistor is linear according to the description of Ohm’s law. The I-V characteristic of a diode is depended on operating region and it is nonlinear also. The semiconductor diode is sometimes called junction diode because the diode is produced by making a junction between p-type and n-type semiconductors.
Figure 2.9: Symbol for diode.
Figure 2.9 presents a simple diode symbol. It states the diode sign and direction; it also reflects the positive type (p-type) and negative type (n-type) of the diode.
In order to have an extensive idea about diode it is useful to have an idea of diode ideal characteristics. The diode that has ideal characteristics is ideal diode. However, the physical diodes do not behave as ideal diodes; we cannot use the mathematical relationships except in simple circuits for circuit analysis purposes. The rectification is a process of converting the ac signals to dc signals and it is an important application of diodes.
There are various kinds of diode already. The different types of diodes emphasize different aspects of a diode often by geometric scaling, doping level, and the right electrodes. Next section describes shortly all the types of semiconductor diodes.
41
2.3.1 Types of Semiconductor Diodes 2.3.1.1 Normal Diode
These types of diodes are usually made of doped silicon or, more rarely, germanium. Previously cuprous oxide and later selenium were used before the development of modern silicon power rectifier diodes. They have less efficiency and much higher forward voltage drop, typically 1.4-1.7 V per cell [40].
2.3.1.2 Shockley Diode
The first semiconductor device was the Shockley diode; it is also known as PNPN diode. The gate terminal is disconnected and is equal to a thyristor without a gate. The diode can only conduct by providing forward voltage because there is no trigger input in it.
If we turned it ‘ON’ then it stays on; when turned ‘OFF’ then stays off. The two operating principles are conducting and conducting. The diode conducts with less voltage in the non-conducting state. A Shockley diode is represented in Figure 2.10:
Figure 2.10: A Shockley diode.
The main applications of Shockley diode are trigger switches for SCR and it acts as relaxation oscillator.
The symbol of Shockley diode is presented in the figure 2.11.
42
Figure 2.11: Symbol of Shockley diode.
2.3.1.3 Photodiode
Normally all types of semiconductors are dependent on optical charge carrier generation. Most semiconductors are packaged in light blocking material due to its optical carrier generation and typically it is an undesired effect. Photo diodes are packaged in materials that allow light to pass as the diodes are intended to sense light. The use of photodiode is considered in solar cell, in photometry or in optical communications. With the linear array packaging or dimensional array packaging multiple photo diodes can be packaged in a single device [14].
2.3.2 Ideal Diode
A simplest nonlinear element is an ideal diode. It is the combination of a p-n junction in where the p-type to n-type material is considered to occur instantaneously. It is also known as abrupt junction. We ignore the effect of the depletion region and the built-in voltage when assuming a diode as an ideal diode. The terminal which has positive voltage is called anode and the terminal which has negative voltage is called cathode. The current is always considered to flow from anode to cathode and usually the passive sign convention is used in the circuit symbol. Figure 2.12 presents the diode circuit symbol:
We can see that the diode has two terminals are anode and cathode. The diode is forward biased if the positive polarity is at the anode and diode is conducting. The diode is reverse biased and is not conducting if the polarity is at the cathode and it is not conducting.
43
2.3.2.1 Ideal Diode Characteristics
Normally an ideal acts like as switch, when it is forward biased then it acts like a closed switch and when it is reverse biased it act like a open switch. The current-voltage (I-V) characteristics are the most important relationship for the ideal diode.
B An ideal diode is the simplest two-terminal device Anode: the positive terminal Cathode: the negative terminal
(a) (b)
Figure 2.13: Diode characteristics (a) Real diode (b) Ideal diode.
Figure 2.13 (a) shows the real diode characteristics and figure 2.13 (b) shows the ideal diode. They are very close to each other and a very good approximation to the actual diode can be represented by the ideal diode.
This simplified real diode given model is very useful in the case of fast approximate analysis and provides a very helpful introduction to diode circuit analysis
2.3.3 I-V Characteristics of Junction Diodes
The current-voltage (I-V) characteristics of a junction diode depend on the diode saturation current, ideality factor and its thermal voltage. And there is an exponential form in the diode I-V characteristics.
44 B Diode Current: s t v i = I exp - 1 nV (2.4)
Is: It is diode saturation current and proportional to diode area.
n
: It is the diode ideality factor which varies between 1 and 2. Vt: It is the thermal voltage and it is equal to room temperature.
Figure 2.14 shows the i-v characteristics of a diode in both forward and reverse region.
Figure 2.14: i-v characteristics of a diode [14].
B Diode is in forward-biased region when v>0
- The associated resistance of the diode in the forward biased region is zero and there will be a replacement with a short by the diode. The ideal curve of forward-biased diode has infinite slope.
B Diode is in reverse-biased region when v<0
- The associated resistance of the diode in the reverse biased region is infinity and there will be a replacement with an open by the diode. The ideal curve of reverse-biased diode has slope of zero.
B Diode is in breakdown region whenv < -VZK.
45
Figure 2.15: i-v characteristics of a diode with all regions [14].
2.3.3.1 Diode Forward-biased Region
The junction of a diode is said to be forward biased when we connect p-type region of a junction with positive terminal and n-type region of a junction with negative terminal of the voltage source. The characteristics of diode forward biased region are as follows:
B The I-V relationship of simplified forward-biased region:
For a given forward voltage:
T
v nV s
i I exp (2.5)
For a given forward current:
t s I v = n V ln I (2.6)
B The I-V relationship due exponential term
For cut-in voltage: i= 0 while v < 0.5 V.
For whole conduction: 0.6V < v < 0.8 V.
2.3.3.2 Diode Reverse-biased Region
The junction of a diode is said to be reverse biased when we connect p-type region of a junction with negative terminal and n-type region of a junction with positive terminal of the voltage source. The characteristics of diode reverse biased region are as follows:
46 B Diode reverse current is denoted by i and it can be written by the following equation:
s
iI .
B Practically it is found that Isis smaller than reverse current.
B It is also found that reverse current increases a little with the reverse bias. B Reverse current is not dependent of reverse bias theoretically.
B There is temperature dependence of the reverse current. It is seen that for every 10ºC of temperature rises reverse current increases almost double.
2.3.4 The Effects of Photovoltaic System
Power generation cannot be risen itself with the collection of light-generated carriers. The main path of generating power is to generate voltage with generated current. The photovoltaic effect is responsible to generate voltage in a solar cell. The effect that is based on the conversion of sunlight to electricity is the photovoltaic (PV) effect. We can describe it as the close contact between two dissimilar materials that produces electricity or voltages while the sunlight strikes on it. Simply, it can be described as follows: when the pure energy light strikes a PV cell it transmits the amount of energy necessary for the negatively charged atomic particles, which are known as electrons, to be easily freed [41]. The voltage or photovoltage is created by acting a built-in-potential barrier in the cell. The direct conversion of sunlight into electricity can be an appropriate definition of the photovoltaic effect, which is responsible for all of its uses. The basic principles that posses the photovoltaic effects are:
A junction in photovoltaic system can be obtained by generating charge carriers. The charge carrier generation happens by the photon absorption.
In the junction, the following separation processes of the photo-generated charge carriers occur.
At the terminals of the junction the collection of the photo-generated charge carriers is completed and that is the main important part.
47 In a photovoltaic system the sunlight strikes the crystal (for example silicon or germanium). In this type of crystals we know that the electrons are not usually free and, as a result, they cannot move from one atom to another within the crystal. With the striking of the light some of the electrons become free from the bonded situation by using the gained energy.
There are two types of junction in a system one is positively charge and another is negatively charged. The free electrons can easily jump to another junction more freely; then, on the other side, they can make bonding by positive and negative charge very easily.
The photovoltaic effect continues till the sunlight is provided to the cell. In a solar power system, the current is used to measure the incident light brightness level or as a power source in an electrical circuit. An image of the photovoltaic effect is given figure 2.16:
Figure 2.16: Photovoltaic effect principles. [42]
The effects of photovoltaic mainly work with a material to convert sunlight into electrical energy. In order to be able to produce electrical energy it is required to follow few conditions and work in accordance with it. Through the promotion of higher levels of energy the incident photons must be absorbed and it is the first criteria for the electricity generation. In order to have electrical current it should have an internal electrical field that is able to accelerate the promoted electrons in a particular direction.
48 2. 4 SOLAR CELL TECHNOLOGY
The main and only way of producing electricity by sunlight is through the photovoltaic effect and the device is used to produce electricity is usually called solar cells. The source of energy is the sunlight which is free and abundant. It is found that the intensity of the sunlight in the Earth is about one thousand watts per square meter. For this reason to produce sufficient electric energy the occupying area by the solar cells has to be large enough.
For the commercial purpose the costs must also be considered; the decision should be taken based on the costs per unit of electricity. The photovoltaic system also has installation and operating costs.
Figure 2.17: Industrial level silicon solar cell. [43]
Solar cells are found economically competitive among alternative energy sources as that are already being used in terrestrial applications. Among other renewable energy sources, the solar energy will be cheaper and easier to implement in future. There will be rapid expansion of solar energy market in renewable energy sector if the technological development occurs.
If we want more development and advancement in the sector, some tasks to be completed. Mainly, we have to look for higher efficient solar cell because current cell are not so efficient. Another thing is that the production costs of cells and, modules, installation costs and other equipment are very expensive; we should look for the low cost instruments and installation costs for the solar energy production.

![Figure 2.3: Power conversion efficiency as a function of semiconductor band gap [37].](https://thumb-eu.123doks.com/thumbv2/123dok_br/15757214.1074385/37.892.214.682.715.1050/figure-power-conversion-efficiency-function-semiconductor-band-gap.webp)

![Figure 2.18: Idealized solar cell structure Band diagram at the (a) open circuit conditions (b) Short circuit conditions [38]](https://thumb-eu.123doks.com/thumbv2/123dok_br/15757214.1074385/54.892.200.700.190.445/figure-idealized-structure-diagram-circuit-conditions-circuit-conditions.webp)