Cross-company customer churn prediction in telecommunication: A
comparison of data transformation methods
Adnan Amin
a,, Babar Shah
b, Asad Masood Khattak
b, Fernando Joaquim Lopes
Moreira
c, Gohar Ali
d, Alvaro Rocha
e, Sajid Anwar
aaCenter for Excellence in Information Technology, Institute of Management Sciences, Peshawar 25000, Pakistan bCollege of Technological Innovation, Zayed University, United Arab Emirates
cREMIT, IJP, University of Portucalense & IEETA, University of Aveiro, Portugal dCollege of Information System, Sur University, Oman
eDepartment of Informatics Engineering, University of Coimbra, Portugal
A R T I C L E I N F O Keywords: Churn prediction Cross-company Data transformation Box-cox Rank Log Z-Score A B S T R A C T
Cross-Company Churn Prediction (CCCP) is a domain of research where one company (target) is lacking enough data and can use data from another company (source) to predict customer churn successfully. To support CCCP, the cross-company data is usually transformed to a set of similar normal distribution of target company data prior to building a CCCP model. However, it is still unclear which data transformation method is most effective in CCCP. Also, the impact of data transformation methods on CCCP model performance using different classifiers have not been comprehensively explored in the telecommunication sector. In this study, we devised a model for CCCP using data transformation methods (i.e., log, z-score, rank and box-cox) and presented not only an ex-tensive comparison to validate the impact of these transformation methods in CCCP, but also evaluated the performance of underlying baseline classifiers (i.e., Naive Bayes (NB), K-Nearest Neighbour (KNN), Gradient Boosted Tree (GBT), Single Rule Induction (SRI) and Deep learner Neural net (DP)) for customer churn pre-diction in telecommunication sector using the above mentioned data transformation methods. We performed experiments on publicly available datasets related to the telecommunication sector. The results demonstrated that most of the data transformation methods (e.g., log, rank, and box-cox) improve the performance of CCCP significantly. However, the Z-Score data transformation method could not achieve better results as compared to the rest of the data transformation methods in this study. Moreover, it is also investigated that the CCCP model based on NB outperform on transformed data and DP, KNN and GBT performed on the average, while SRI classifier did not show significant results in term of the commonly used evaluation measures (i.e., probability of detection, probability of false alarm, area under the curve and g-mean).
1. Introduction
In the last decade, the companies are moving towards the new technological paradigms in order to progressively eliminate the barriers in information transformation (Ferreira, Moreira, & Seruca, 2017; Henriette, Feki, & Boughzala, 2015). This technological shift allowedthe companies for integration of technological innovations such as So-cial technologies, Mobile connectivity, Cloud computing and Big Data analytics (Uhl & Gollenia, 2016). Such business practices can establish a link to the significant competitive advantage in the current digital age for competitive companies, in particular, the telecommunication ser-vice based companies. The digitalization of the business practice in the
world by 2020 will be more than double of an existing initiative (i.e., from 22% to 50%), a major portion of which will be from the tele-communication sector. Changes in technological innovation and cus-tomer demands in this field (i.e., digital transformation) are very fierce. In order to realize customers’ digital transformation, not only technical excellence, but also co-created through close partnership with people in each industry are required (Garrido-Moreno & Padilla-Meléndez, 2011; Takeuchi, 2016). Since all the data related to the business customers areusually stored and organized in Customer Relationship Management (CRM) (Bull, 2010; Reychav & Weisberg, 2009).
CRM is a comprehensive strategy for developing, organizing and strengthening loyal and long-lasting customer relations and is
A. Amin et al.
extensively applied in the telecommunication sector (Vafeiadis, Diamantaras, Sarigiannidis, & Chatzisavvas, 2015). The importance of CRM is obvious, given the reason that the cost of the new customer acquisition is Five to Six times more than retaining the existing cus-tomer based on the historical data stored in the companies’ CRM (Vafeiadis et al., 2015; Verbeke, Dejaeger, Martens, Hur, & Baesens,2012). Furthermore, CRM can tackle the research challenges related tothe business analytics, which is increasingly becoming important in rapidly changing in a competitive business environment (Nam, Lee, & Lee, 2018; Reychav & Weisberg, 2009). Therefore, it’s obvious to tel-ecommunication companies’ decision makers that the customers’ his-torical data stored in CRM database can be used to analyze customer’s behavior for retention purposes by developing predictive models (Tao & Rosa Yeh, 2003). Concretely, in Customer Churn Prediction (CCP) a model allows the estimation of probability for future customer churn on the basis of the historical knowledge of the customer (De Caigny,Coussement, & De Bock, 2018). Customer churn not only affects the company reputation in the existing customer but also in public view (Adnan Amin et al., 2016; Amin, Al-Obeidat et al., 2017).
Various Machine Learning (ML) techniques such as Rough set theory (Amin, Anwar et al., 2017; Amin, Shehzad, Khan, Ali, & Anwar, 2015), Naïve Bayes and Bayesian network (Kirui, Hong, Cheruiyot, & Kirui,2013), Genetic algorithm (C.Pendharkar, 2009), and Ensemble learning technique (Idris, Iftikhar, & Rehman, 2017), have been proposed which can efficiently predict the customers as churn or non-churn in the tel-ecommunication companies using CRM data. However, most of these conventional techniques were applied to a single company (i.e., we called it within-company), where enough data is available for the training and testing purpose of the CCP model. In practice, newly de-veloped and small-scale companies do not contain sufficient historical data to construct predictive models; therefore, the prediction models for customer churn are hardly possible for these types of companies (Au,Chan, & Yao, 2003). Fortunately, researchers have introduced a cross-company prediction technique which is needed when the target com-pany does not have sufficient historical data to build a CCP model (Zhang, Keivanloo, & Zou, 2017). In this way, CCCP can be an alter-native method to handle the bottleneck in Within Company Churn Prediction (WCCP).
As discussed earlier, the CCCP model is built using the training data of one company and applied to the target data of another company (Zhang et al., 2017); however, Cross-company predictive models ex-perience great challenges, such as (i) to deal with the heterogeneity between the training and target data (Zhang, Audris, Ying, Foutse, &Ahmed, 2013), and (ii) dataset migration problem (i.e, moving datafrom one location to another usually required extra steps to transform according to the target source) between the cross-companies (Li,Huang, Wang, & Fang, 2017). Therefore, in such cases, the predictionsmostly result in poor performance (Poon, Bennin, Huang, Phannachitta,
& Keung, 2017). In order to address the aforementioned issues, the researchers have focused on the data transformation (DT) methods. There are several DT methods such as the log, rank, z-score, min-max, and arcsine; however, researchers widely applied specifically the log, z-score and rank DT methods in various domains, such as software me-trics normality and maintainability (Zhang et al., 2013, 2017), defect prediction (Fukushima, Kamei, Mcintosh, Yamashita, & Ubayashi, 2014; Peters, Menzies, Gong, & Zhang, 2013; Zimmermann, Nagappan, Gall, Giger, & Murphy, 2009), and dimensionality reduction (Danubianu, Stefan, & Gheorghe Pentiuc Dragos, 2012; Zimmermannet al., 2009).
DT methods when applied in both source and target company data, have the potential to mitigate the aforementioned issues. Also, DT methods can improve the prediction performance as observed in our previous work (Adnan et al., 2018) in which we have applied only two DT methods (e.g., rank and log), the single classifier (e.g., Naïve Bayes) and WCCP. This study is the extension of our previous work which represents a more comprehensive and extended study by applying four
DT methods namely: log, rank, box-cox and z-score, and multiple state-of-the-art classifiers (i.e., KNN, NB, GBT, SRI, and DP), leading to producing multiple models through different iterations of the applica-tion of classifiers on the said datasets obtained from the log, rank, box-cox, and z-score. Accordingly, we study the following research ques-tions:
RQ1: What is the effect of DT methods (i.e., Log, Rank, Box-Cox, and Z-Score) on data normality in CCCP?
RQ2: What impact does the DT method has in the performance of different classifiers?
RQ3: Do the application of different DT methods exhibits significant performance difference?
The rest of the paper is organized as: Section 2 presents the cus-tomer churn, CCP modeling and four studied transformation methods. The evaluation measures and evaluation setup of the proposed study are presented in Section 3. The results and comparison are briefly ex-plained in Section 4. The contribution to existing knowledge, implica-tions to practice, future direction, and threats to the validity of the proposed work are discussed in Section 5. We conclude the proposed study in Section 6.
2. Customer churn and CCP modeling
Customer churn is one of the most common application for the ML in the services based industry; in particular, the telecommunication sector. Due to passionate competition and high costs associated with new customer acquisition as compared to retention of the existing customer (Liu, Guo, & Lee, 2011), many competitive businesses (i.e., telecommunication is on top) are looking for developing Customer Churn Prediction (CCP) and retention strategies using ML (Culbert, Fu,Brownlow, & Chu, 2018). While there is no standard accepted defini-tion for customer churn it is generally considered as the contract ter-mination (financial relationship) between the customer and a business (Popovic & Basic, 2009). CCP modeling refers to the statistical and computational procedures used to derive hidden customer behavior from the CRM. The main purpose of the CCP modeling is to prioritize the relationships and marketing strategies to entice the riskiest custo-mers to stay with the company or keep using the service or package (Charles, Guandong, James, & Bin, 2017; Culbert et al., 2018).
CCP is an important research area for businesses and marketing which helping in automation to prevent customers who are likely to churn. For those businesses as it is important to retain existing custo-mers for the following reasons (De Caigny et al., 2018; Deng, Lu, Wei, & Zhang, 2010): (i) best companies are focusing on their customer needsinstead of acquiring new customers because they rely on long-term relationships with their existing customers (loyal), (ii) customer churn influence other people within their social network to adapt the same churn behavior, (iii) loyal customers’ effects on both the maximum the profit and minimize the cost because loyal customer buy more and can do company’s marketing by positive word of mouth in their social network.
The literature highlights a great diversity of ML and data mining techniques for CCP. Among these are Decision tree, Logistic regression and Random forests (De Caigny et al., 2018; Höppner, Stripling,Baesens, & Verdonck, 2017; Nisha, 2016), Support vector machine(Dong, Suen, & Krzyzak, 2005; Farquad, Ravi, & Raju, 2014; He, Shi,Wan, & Zhao, 2014; Renjith, 2017; Wang, Zhang, & Yu, n.d.), Activelearning (Jamil & Khan, 2016; Verbeke, Martens, Mues, & Baesens,2011),Rough set theory (Amin et al., 2016; Amin, Anwar, Adnan, Khan, & Iqbal, 2015), Negative correlation learning (Rodan, Fayyoumi, Faris, Alsakran, & Al-Kadi, 2015), Dynamic networks (Óskarsdóttir, Van Calster, Baesens, Lemahieu, & Vanthienen, 2018), AdaBoost ensemble techniques (Idris et al., 2017), Sequential pattern mining (Culbert et al., 2018), Recursive PARTioning (RPART) (Vafeiadis et al., 2015), Genetic algorithm (Amin, Khan, Ali, & Anwar, 2014; Amin, Rahim, Ali, Khan, &Anwar, 2015), Sociometric theory (Uros, Mitja, & Andrej, 2015), and
A. Amin et al.
Artificial neural network (Kasiran, Ibrahim, Syahir, & Ribuan, 2014; Tsai & Lu, 2009; Zakaryazad & Duman, 2016). The aforementioneddiscussion shown the importance of CCP as it is very beneficial assets of competitive businesses and equally important for various domain, such as; Banking sector (Chitra & Subashini, 2011; He et al., 2014; Oyeniyi &Adeyemo, 2015), Financial services (Charles et al., 2017; He et al., 2014),Social networks (Maria, Verbeke, Sarraute, Baesens, & Vanthienen, 2016; Óskarsdóttir et al., 2017; Verbeke, Martens, & Baesens, 2014), Online gaming industry (Kawale, Pal, & Srivastava, 2009; Suznjevic, Stupar, & Matijasevic, 2011), Human resource man-agement (Saradhi & Palshikar, 2011), Telecommunication sector (Aminet al., 2018; Amin, Al-Obeidat et al., 2017; Muhammad et al., 2017; Óskarsdóttir et al., 2018), retailer & E-Commerce (Renjith, 2017; Subramanya & Somani, 2017), Insurance company (Soeini & Rodpysh, 2012),Pay-TV (Jonathan Burez & Van den Poel, 2007; Garc´ıa, Nebot, & Alfredo, 2013), Question & Answer forum (Dror, Pelleg, Rokhlenko, & Szpektor, 2012),and superannuation service (Culbert et al., 2018).
CCP models are usually solely evaluated based on their predictive performance in which the models show the ability to correctly identify customer churns and non-churns separately and accurately (De Caignyet al., 2018). Recent studies in the field have focused on the class im-balance techniques namely SMOTE (Chawla, Bowyer, Hall, &Kegelmeyer, 2002), MTDF (D.-C. Li, Wu, Tsai, & Lina, 2007), ICOTE (Ai et al., 2015), MWMOTE (Barua, Islam, Yao, & Murase, 2014), ADASYN(H. He, Bai, Garcia, & Li, 2008), TRkNN (M. Tsai & Yu, 2016), and Cube (Deville & Tille, 2004) for improving the prediction performance of CCP in the telecommunication sector because research identified a bias to-wards the majority class (Culbert et al., 2018; Burez & Van den Poel, 2009). A number of studies have focused on the comprehensibility ofthe CCP model for customer retention management where they try to know why the customers are churning (De Bock & Van den Poel, 2012; De Caigny et al., 2018; Verbeke et al., 2011).
It is clear from the above-mentioned discussion that CCP is a serious problem for the competitive sectors. Therefore, the research community has focused this problem and proposed various studies in several im-portant domains. However, these proposed studies are mostly for WCCP. On the other hand, none or less focus has been given to handle customer churn problem by utilizing the advantages of CCCP. The contributions of this paper are relevant to both practitioners and aca-demia and to the best of our knowledge, this paper is the first study that deeply articulates a CCCP in the telecommunication domain using DT methods. The next subsection provides detail on the WCCP and CCCP concepts.
2.1. WCCP and CCCP
WCCP: within-company customer churn prediction allows compe-titive companies to take advantage of early conventional churn pre-diction techniques where it might be more cost-effective because CCP models are built with within-company data i.e., available in the local CRM (Peters et al., 2013). In WCCP, the dataset is comprised of multiple independent and one depended variable (e.g., the class attribute or sometimes called it the prediction attribute or target attribute). The depended variable holds labels or values, which indicate whether cus-tomers are churn or non-churn. The predictive model is trained on the local data of the company using one or more state-of-the-art classifi-cation algorithms (Tim, Jeremy, & Art, 2007), then a new unseen in-stance is assigned a label as churn or non-churn through the already trained classifier. However, a major limitation of WCCP is where there is a lack of availability of data for companies that are either newly established or does not have historical data due to some any other reason. The lack of availability of data hinders the building/training of the prediction model (Poon et al., 2017). To handle the limitation of WCCP, the research community has introduced cross-company con-cepts.
CCCP: When the data can be shared between companies, where a
matured company data is used as training set and the data of such company which is lacking historical data, consider for test set (Poonet al., 2017). In CCCP, the target data acquired from such company which possesses no or less historical data or a company is newly es-tablished, while the source data is obtained from the mature company or the company which has enough historical customer data. CCCP has advantages over WCCP in terms that the new company may take ben-efits from the experiences gained by the older company. However, it is also reported that the performance of CCCP was either very poor or inconclusive (Kitchenham, Emilia, Guilherme, & Travassos, 2007). Si-milarly, according to Poon et al., 2017, cross-company predictions mostly shown poor performance in the final result. Additionally, Zhang et al., 2013 have also reported that cross-company experiences a greatchallenge to deal with the heterogeneity between the source and target company data. One major issue is datasets shifting between the source and target companies which create a problem during the training and testing process by ML techniques (Turhan, Tosun Mısırlı, & Bener,2013).
Recently, various studies (Amin, Al-Obeidat et al., 2017; Li et al.,2017) successfully implemented the cross-company concept where the target company was unable to provide sufficient data for ML classifier’s training phase. Z. He, Fengdi, Ye, Mingshu, & Qing, 2012 has reported that finding the most suitable training data to show the same patterns within the target company can obtain more suitable results. Ad-ditionally, Zhang, Audris, Iman, & Ying, 2014 reported that if DT is applied on both the training and target datasets, it will have the ability to handle the heterogeneity between the shared companies datasets. In the literature, researchers widely used rank and log transformations to improve the performance of the classifier in the source and target companies’ datasets (Zhang et al., 2017). Therefore, in this study, we have presented an exploratory work to observe if using multiple dif-ferent DT methods, that retain distinct properties, are beneficial to CCCP. The subsection provides the detail about these DT methods.
2.2. DT methods
Different DT methods retain the information of the original dataset from the different perspectives, particularly in the cross-company set-ting (Zhang et al., 2017). Therefore, we have used different DT methods to implement the CCCP concepts using multiple classifiers in the tele-communication companies.
Log data transformation: it is a mathematical procedure that
calcu-lates the natural logarithm of all attributes in the source and target datasets. It is one of the widely used DT methods in software defect prediction (Tim, Alex, & Justin, 2007). Due to its ease of use, the log DT method is very popular which has created its vulnerability of being commonly used. Its common use has led to its incorrect interpretation, even by the most experts. For instance, the two-sample t-test is com-monly applied to compare the means of two independent samples (approx. normally distributed) data, but many researchers take this critical assumption without considering to verify the underlying as-sumption. Thus, proper use of the log DT method allowed to transform skewed data and follows a normal or near to normal distribution which conforms the data normality (Feng et al., 2014). The literature revealed that the log DT method is widely applied in developing cross-company prediction models (Tim, Alex et al., 2007). This DT method restricted to only transform the numerical values that are higher than zero (0), due to the limitation of ln(x) function. In case the data variable contains zero, a constant is commonly added, such as ln(x+1) functions. An-other solution to deal with zero is to replace all the zero values by
0.00001. We can use the following often used log DT method equation:
Log(x) = ln(x+1) (1)
where x is zero value of any attribute in a given dataset.
any
A. Amin et al.
variable in a given dataset by their statistical calculated rank’s value. This DT method is recommended to deal with such type of data values which contain heavy-tailed distributions or high kurtosis (Bishara & Hittner, 2015). It is observed from the literature in prediction modeling that the rank DT method can improve the performance of ML classifier (e.g., Naïve Bayes algorithm; Zhang et al., 2017). Furthermore, it has been successfully used to mitigate the heterogeneity of source data across the companies in cross-company prediction models (Zhang et al.,2014). In this study, we followed the study (Zhang et al., 2017) to transform the original values of each attribute in a given dataset into ten (10) ranks, using every 10th % (percentile) of the corresponding attribute’s values, the equation can be defined as;
1, if x [0, Q1]
{2, 3, .….,9}
Rank ( x) = k , if x [Qk 1, Qk], k
10, if x [Q9 + ] (2)
where Qkis the k×10 percentile of the corresponding metric in the
combination (union) of the source and target companies data and sign is actually representing the infinity symbol.
Box-Cox data transformation: it belongs to the family of the power
transformation method. As we have discussed the case of incorrect in-terpretation of the log DT method (misuse of log method), similarly, Box-Cox DT method can be misused by applying this DT method without even being aware of the proportionality assumption which is required for the core inference (Feng et al., 2014). The Box-Cox DT method can be mathematically expressed as;
Box Cox ( x, ) = x 1 if 0 =0
ln(x ) if
(3)
Where is the configuration parameter, and x is the value of any at-tribute in a given dataset.
This method is usually applied for data transformation of the at-tributes that used a power law distribution. Thus, this DT method is suggested to use for increasing the variance of homogeneity to improve the precision of estimation resulting in the simplifying the proposed models as well (Zhang et al., 2017).
Z-score data transformation: the procedure of this DT method for
normalizing the data is a familiar statistical data transformation method used in various domains including neuroimaging, psycholo-gical, pattern recognition, and many others. This z-score DT method process can be easily applied to more large and complex dataset (Cheadle, Vawter, Freed, & Becker, 2003). The z-score DT method in-dicates that how many samples in a dataset, through standard devia-tions, is above or below the mean. The formula is given below.
x sample mean
ZScore
=
sample dtandard deviation (4)
where x is a value of an attribute which to be transformed by Eq. (4). 3. Empirical setup
In this section, we will describe the subject datasets, then, we will present the proposed CCCP model for this study, followed by state-of-the-art evaluation measures.
3.1. Subject datasets
In this study, we choose two publicly available datasets, which are widely used for CCP problem in the telecommunication sector. These publically available datasets are chosen to make sure that the proposed study may be reproducible and verifiable by the research community in the same domain. In addition, it can provide a simple comparison to other existing studies. Table 1 describes the detail of the subject data-sets.
Table 1
Description of Subject datasets.
Description Subject Dataset-1 Subject Dataset-2
Independent variables 20 250
Dependent variables 1 1
Class Labels {0,1} {0,1}
Total Number of samples 3333 18000
No. of churn samples 14% 12.44%
No. of non-churn samples 85% 87.55%
Role in the proposed study Target dataset Source dataset
Source of the dataset URLa URLb
ahttp://www.sgi.com/tech/mlc/db last access: Dec 30, 2017 01:30 pm. b http://pakdd.org/archive/pakdd2006/competition/overview.htm Last
Access:Dec 30, 2017. 3.2. Data preparation
We consider the subject datasets (described in Table 1) where da-taset-1 is used as target company dataset and the dataset-2 is used as source company dataset. For the reason, the dataset-1 has less number of samples and attributes as compared to the source company dataset. On the other hand, the source company dataset contained 15760 cus-tomers are non-churn and 2240 customers are churn, while in the target company dataset, there are 2850 customers as churn and 483 customers are non-churn. During the data preparation phase, we have applied the following important steps:
- Ignored all those attributes for which the corresponding attribute in the source-target companies datasets are not available,
- Ignored all unique values attributes in the subject datasets, - To handle the naming conflicts of the attributes in the subject
da-tasets, we assigned arbitrary titles to all the mapped attributes be-cause the cross-company datasets different attributes name might be used for the same dimension (Rahm & Do, 2000).
- To avoid redundancy between the attributes in the source and a target companies dataset, Feng Zhang et al (Zhang et al., 2017) ap-plied Spearman’s p-value statistical test to measure the correlation of attributes. Similarly, we have measured the correlation between the attributes of the subject datasets using Spearman’s correlation sta-tistical approach (Sheskin, 2007), On the one side, we select only those attributes which are correlated with each other in the subject datasets while on the other side, we removed those attributes that were more robust to outliers and preferred in the presence of ties within each subject datasets. For this purpose, we have followed the suggestion provided in the study (Adnan et al., 2018). For example, in source dataset attributes such as; Avg_Mins with Avg_Mins_local and Avg_Call with Avg_call_local have shown a strong correlation with each other within the subject dataset. Therefore, we have not considered Avg_Mins and Avg_Call attributes and vice versa,
- Included manually the derived attributes in the target dataset based on the domain expert opinion, which match the attribute in the source dataset. For example, attributes Avg_mins_intran and
Avg_call_intran exist in the source company dataset, but similar
at-tributes do not exist in the target company dataset. In such a si-tuation, if this attribute contains any value then we considered the customer has the international plan, which corresponds to the at-tribute Intl_Plan in the target dataset.
- The continuous-valued attributes were normalized into discrete valued attributes as it can significantly improve the performance of the classification in ML (Amin, Anwar et al., 2015). We have used approximate equal frequency discretization technique for con-verting continuous-values into discrete-values because this method is easy to implement and has almost linear computing complexity on both small and large size datasets (Jiang et al., 2009). The final list of selected attributes with titles provided in Table 2.
A. Amin et al.
Table 2
Reflects the list of finally selected attributes.
NEW TITLE SOURCE COMPANY FEATURES TARGET COMPANY FEATURES
A LINE_TENURE ACCOUNT B VAS_GPRS_FLAG VMAIL_PLAN C STD_PAY_AMT TOT_CHARGES D AVG_MINS_LOCAL MINS E AVG_MINS_INTRAN CALLS F AVG_CALL_INTRAN INTL_MINS G PLAN_INTRAN INTL_CALLS H CUSTOMER_TYPE INTL_PLAN
I CLASS (CUSTOMER_TYPE) CLASS (CHURN)
3.3. Evaluation measures
The confusion matrix is usually applied to evaluate the performance of the binary classification or predictive classifiers and prediction models. It contains the following corresponding measures; (i) True Positive (TP): customer churn that has been correctly predicted, (ii) True Negative (TN): customer non-churn has been correctly predicted,
(iii) False Positive (FP): customer non-churn that has been incorrectly predicted to be customer churn, and (iv) False Negative (FN): customer churn that has been incorrectly predicted to be customer non-churn. The computed values of these measures (e.g., confusion matrix) further used in the base evaluation measures (Probability of detection, prob-ability of false alarm, area under the curve and G-mean) which selected for this study.
Since the subject datasets are unbalanced in terms of customer churn and non-churn, and we have followed of the suggestions in (Tim,Alex et al., 2007)and (Tim, Alex et al., 2007),therefore, we have not used state-of-the-art evaluation measures (i.e., accuracy and precision). In this study, we used the following performance metrics for evaluating the performance of the classifiers.
- The probability of detection (POD): It is an evaluation measure that is used for measuring the accuracy of correct prediction of customer churn in this study. The value of the POD should be as high as possible while the ideal value is when the POD is equal to 1. Mathematically it can be expressed as:
POD = TP
(5)
TP + FN
- The probability of false alarm (POF): It is an evaluation measure that is used for measuring the false alarm or an error for incorrect prediction of customer churn in this study. Thus, a CCCP should have the lower POF value as much as possible (the lowest value POF = 0 is an ideal case). It can be defined as:
POF = FP
(6)
FP + TN
- The area under the curve (AUC): it is the area under the receiver operating characteristic curve, thus the value of the AUC is not dependent on any cut-off value. On the other hand, precision, false positive rate, balance, and f-measures are depended on the cut-off value which is applied to calculate the TP, TN, FP, and FN (Zhang et al., 2017). The advantage of the using AUC as base evaluation measures is that it provides a single measure for the overall POF and POD performance of a prediction model since it incorporates both values. The higher the value of AUC shows the best performance result. It is defined as:
AUC =
1 + POD POF
2 (7)
- G-Mean (GM): It is suggested that precision is not more appropriate measure (Tim, Alex et al., 2007; Tim, Alex et al., 2007) while measure is based on precision and recall; therefore, f-measure is not considered in this study as a main evaluation measure. Instead, the G-mean (Shuo & Xin, 2013) is more appropriate to use as a per-formance measure reported in (Poon et al., 2017). The GM formula is defined below.
GM = POD (1 POF) (8)
3.4. Empirical setup
To empirically validate the proposed approach, we conducted ex-tensive experiments by comparing the credibility of the proposed CCCP model. With the three research questions mentioned earlier in Section 1,we presented an empirical setup for the proposed study. We haveconducted a series of experiments using log, rank, box-cox, and z-score DT methods for data normality and built the CCCP model with multiple state-of-the-art ML and data mining techniques (NB, KNN, GBT, SRI, and DP).
The proposed study integrated its CCCP model separately built with log, rank, box-cox, and z-score DT methods providing us the trans-formed datasets. After applying the DT methods, we applied the dis-cretization process to discretize a large number of values allowing for small value(s) to be part of a discrete group. Finally, we got a trans-formed dataset which has an observable impact on the improvement of the classification performance.
Approach: To evaluate the performance of the proposed model, an
empirical setup and experiment were conducted for a better comparison of all the DT methods. Firstly, a raw model was built without applying any DT methods on any attributes of the subject datasets. This was followed by the creation of models using each DT methods (i.e., log, rank, box-cox, and z-score) by using Eq. (1) (for log model), Eq. (2) (for rank DT based model), Eq. (3) (for box-cox DT based model) and Eq. (4) (for z-score DT based model) on each attribute of the subject datasets. This resulted in five baseline models. Then we separately performed the data discretization process on each of the obtained datasets from above five baselines models using different cross-family classifiers listed in Table 3. The source company prepared dataset is used as a training set while the target company prepared dataset is considered as test set data. Fig. 1 illustrates the overall empirical design and setup.
Baseline Classifiers: In order to address the RQ2, we introduce a more elegant approach of applying different classifiers selected from different model type or family. Then we used these arbitrary selected cross-families classifiers separately in the CCCP models construction process. Table 3 provides a description of the baseline classifiers.
Validation method: we used k-fold cross-validation method for CCCP model evaluation because it is commonly used in applied ML to Table 3
List of baseline predictive cross-family classifiers.
Key Classifiers Model type Description
KNN K-Nearest Lazy KNN based prediction on an explicit NB
Neighbor
Bayesian
similarity measure
Naïve Bayes NB returns the prediction model using
GBT Gradient Boosted Trees
estimated normal distribution GBT belongs to the Trees structure SRI
Trees
Rules
family classifier.
Single Rule SRI returns a best conjunctive rule for
DP
Induction
Neural Nets
binary prediction problem.
Deep Learner The deep predictive learner is a neural network family classifier.
A. Amin et al.
Fig. 1. Visualization of the overall CCCP using data transformations methods.
Table 4
The performance of Baseline classifiers on RAW data.
Without DT Methods Classifiers POD POF GM AUC
RAW NB 0.149 0.124 0.255 0.51
RAW KNN 0.136 0.146 0.235 0.49
RAW GBT 0.176 0.131 0.293 0.52
RAW SRI 0.063 0.153 0.118 0.45
RAW DP 0.105 0.145 0.187 0.48
compare and identify the best prediction model. It is easy to implement and generally have a lesser bias than other validation methods. This method has a single parameter k that refers to the number of folds that a given dataset is to be split out. We set the following properties for applying k-fold cross-validation resampling procedure:
- Shuffle randomly the samples in the subject datasets. - Assign the value to k = 10 which split the dataset into 10 folds. - Then select the stratified property for splitting the subject datasets
samples into 10 folds where each fold has the same ratio of ob-servations with a given categorical value.
Finally, in order to address the three research questions (discussed in section 1, we have carried out a certain number of experiments.
We conducted the first experiment without applying any DT methods on the subject datasets and built a raw CCCP model. The baselines classifiers in raw CCCP model were trained on source com-pany dataset and tested on target comcom-pany dataset. Table 4 takes into account the findings, which were achieved from raw CCCP model.
In the second experiment, we have designed log DT based CCCP models in which we used to preprocess data, which we obtained from
A. Amin et al.
the baseline approach (as discussed earlier in Section 3.4). Then sepa-rately built CCCP models based on the obtained dataset which were transformed by log DT method, further the cross-company data were used as training set and target data used as a test set for validating the performance of classifiers. Table 5 reflects the performances of all CCCP models using Log DT methods.
We conducted another experiment in which the subject datasets were transformed based on the rank DT method. The classifiers of CCCP model was trained on the cross-company dataset and tested with the target-company dataset. The performances of all the classifiers are given in Table 6.
In one more experiment, the Box-Cox DT method is applied to the subject datasets to transform and prepared all data for CCCP models. Then all the baseline classifiers are evaluated in CCCP models. Table 7 provides the detail on the performance of baseline classifiers using state-of-the-art evaluation measures.
In the final experiment, the subject datasets were preprocessed and transformed through z-score DT method. A separate CCCP model was built through a baseline classifier on the z-score transformed datasets. All the classifiers were trained and tested through the cross-company and target-cross-company datasets, respectively. The performance evaluation of the baseline classifiers is given in Table 8.
4. Results
In this section, we explore the results obtained in Section 3, and provide a brief discussion. We structure the discussion according to the three RQs described in Section 1. In order to report RQ1 (What is the effect of DT methods (i.e., Log, Rank, Box-Cox, and Z-Score) on data normality in CCCP?), we applied Log, Rank, Box-Cox and Z-Score DT methods on the subject datasets. We used the following normality measurements (i.e., Skewness and Kurtosis) which is commonly used in the data normality test (Zhang et al., 2017) using the SPSS toolkit1.
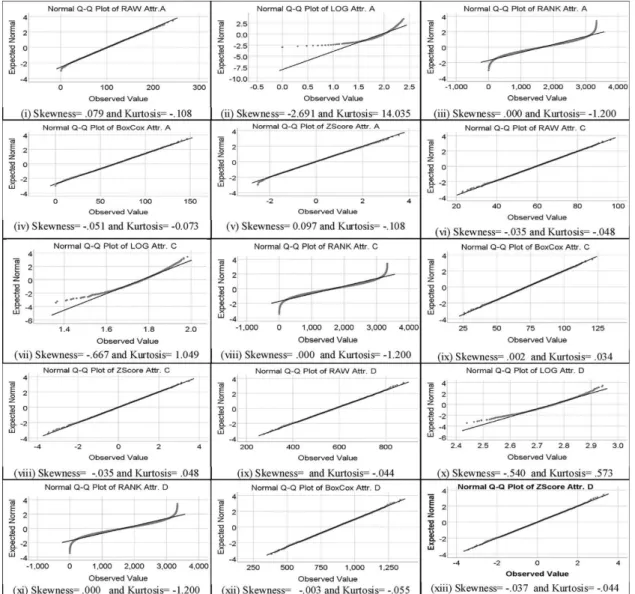
Skewness: it is computing the level of symmetry in the probability distribution of the values of each attribute in the subject datasets. The obtained skewness level can be either positive or negative. The positive skewness indicates a long tail to the right side while the negative skewness indicates a long tail to the left side of the data distribution, and zero (o) represents the equal or balanced tails on the left and right sides. Although, the ideal level of skewness can start from the -0.80 to 0.80; but an appropriate range for skewness fall between -3 and +3.
Kurtosis: it is computing the measure of the width of the peak (peaks) in the probability distribution of the values in each attribute of the subject datasets. The measure of the kurtosis can be either positive or negative where positive sign reflects a more acute peak, and the negative sign indicates the lower wider peak. The normal curve is leptokurtic which is highly arched at the mean with the short tails while the acceptable range is between -10 and +10 for kurtosis2. However, the kurtosis ideal value is zero (0).
In order to determine the data normality, the Q-Q (quantile-quan-tile) plot helps to visually assess the probability of data normality. Fig. 2 shows that data in some cases is normally distributed (i.e., iv, v, vi, viii, xii, xiii, xiv, xvii, xix, xxvi) and in some cases it’s not (i.e., ii,vii, xi, xvi, xxi, xxi, xxv, xxvii, xxviii, xxix. Also, we can easily see in Fig. 2 (Attr. A) that raw data have skewness 0.079 and kurtosis −0.108 which are an acceptable sign of data normality. On the other hand, when applied with log DT method on the same attribute (Attr. A), it produced skewness and kurtosis values in at log DT method are -2.691 and 14.035, respectively. Hence, by comparing raw versus log transforma-tion, it is clear that log DT method has not increased the data normality in this particular case. But it is not the case for the rest of the DT
1 https://www.ibm.com/analytics/data-science/predictive-analytics/spss-statistical-software
2 https://www.sciencedirect.com/topics/neuroscience/kurtosis
Table 5
Log DT method based CCCP model.
DT Methods Classifiers POD POF GM AUC
LOG NB 0.149 0.124 0.255 0.51 LOG KNN 0.136 0.146 0.235 0.49 LOG GBT 0.169 0.139 0.283 0.51 LOG SRI 0.063 0.182 0.118 0.44 LOG DP 0.198 0.133 0.323 0.53 Table 6
Rank DT method based CCCP model.
DT Methods Classifiers POD POF GM AUC
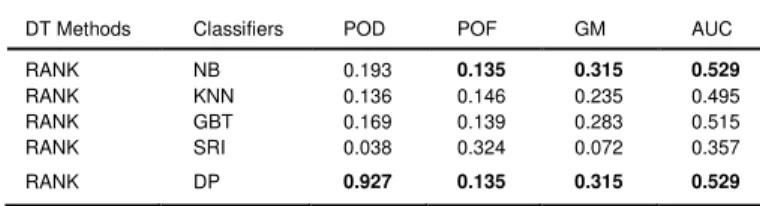
RANK NB 0.193 0.135 0.315 0.529 RANK KNN 0.136 0.146 0.235 0.495 RANK GBT 0.169 0.139 0.283 0.515 RANK SRI 0.038 0.324 0.072 0.357 RANK DP 0.927 0.135 0.315 0.529 Table 7
Box-Cox DT method based CCCP model.
DT Methods Classifiers POD POF GM AUC
BoxCox NB 0.149 0.124 0.255 0.513 BoxCox KNN 0.136 0.145 0.235 0.495 BoxCox GBT 0.176 0.131 0.293 0.522 BoxCox SRI 0.064 0.153 0.118 0.455 BoxCox DP 0.071 0.145 0.132 0.463 Table 8
Z-Score DT method based CCCP model.
DT Methods Classifiers POD POF GM AUC
Z-Score NB 0.086 0.167 0.157 0.459
Z-Score KNN 0.085 0.166 0.155 0.460
Z-Score GBT 0.072 0.173 0.133 0.449
Z-Score SRI 0.167 0.087 0.283 0.541
Z-Score DP 0.08 0.160 0.146 0.460
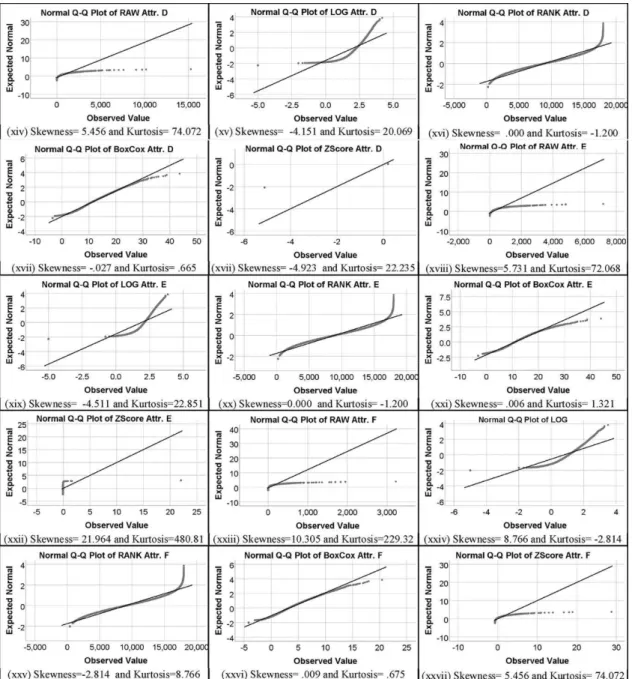
methods because Z-Score DT method increased the data normality when applied on the same attribute as compared to the rest of all with and without DT methods (i.e., raw). Similarly, we can see from Fig. 2 that in some cases DT methods improved the data normality and in some cases, it did not. Additionally, we have also visualized the per-formance of the DT methods in boxplot graphical tools. Fig. 2 illustrate the data normality using the normal Q-Q plot for each attribute and each target DT methods.
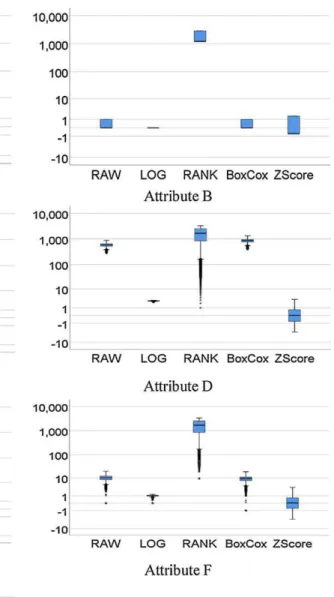
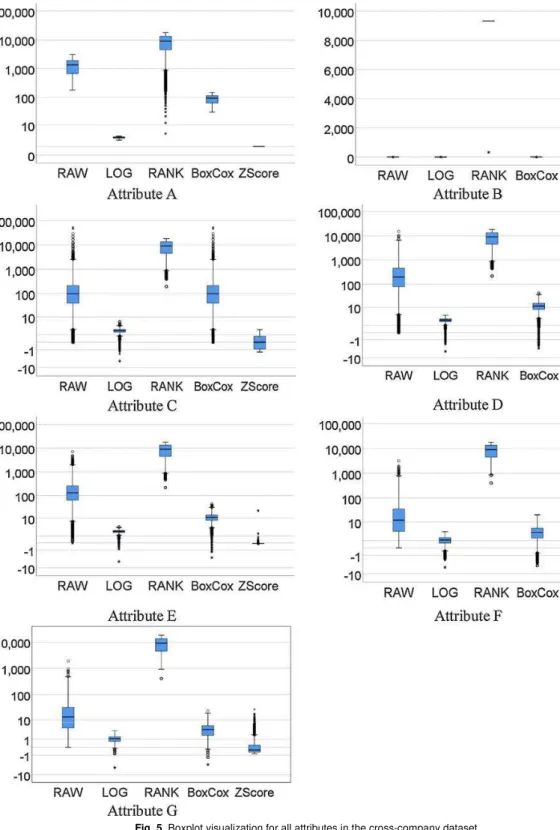
Fig. 3 represents the visualization of the impact of DT methods using boxplot for target-company datasets. A highly skewed data displayed reasonable symmetry in its box and whiskers with many other values as outliers as these values are beyond the whisker on any side of the box.
Similarly, we have also included the graphical representation of the data normality Q-Q plot for cross-company datasets in Figs. 4 and 5 visualize their results in the boxplot. This easily finds and show the unusual data samples in each attribute which are beyond the whisker on any side. It can be observed from Fig. 4 (cross-company dataset) that DT method (i.e., Rank) significantly increase and improve the data normality because before the data transformation the skewness and kurtosis values were 5.456 and 74.074, respectively. These values of skewness and kurtosis in an attribute, such as Attri-D clearly indicates that both skew and kurtosis are not appropriate and which are not acceptable and thus these values are far beyond the normal ranges. But after applying DT methods not all but some significantly improve the data normality, such as Rank DT method obtained skewness value 0.000 an ideal value, and kurtosis value of -1.200 (shown in a normal
A. Amin et al.
range called Platykurtic curve).
To address the RQ2 (What impact does the DT method has in the performance of different classifiers?), we follow series of experiments and studied five classifiers namely: NB, KNN, GBT, SRI and DP classi-fiers. To investigate if our techniques can improve the performance of CCCP, we evaluated baseline classifiers by four commonly used eva-luation measures (i.e., POD, POF, GM and AUC).
Initially, we tested baseline classifiers without any DT method ap-plied to the subject datasets. Table 4 reflects the results obtained from the experiments. The classifier NB obtained the lowest POF value of 0.124 and GBT classifier obtained POD measure value very close to 1 (e.g., 0.176). However, overall the GBT outperformed when compared to the rest of target classifiers because it also achieved the best results in term of AUC = 0.52 and GM = 0.293. From this perspective, we can observe that the GBT classifier has shown best performance on pre-dicting the correct customer churn, while the NB classifier performed well in prediction of the incorrect customer churn.
In the second experiment, we tested baseline classifiers on the subject datasets which were transformed through log DT methods. Table 5 describes the results achieved from the experiments. In this experiment, DP classifier obtained the highest values for POD = 0.198, GM = 0.323 and AUC = 0.53. However, in third experiment both the classifiers (i.e., NB and DP) performed similarly in terms of GM, AUC and POF, while overall DP classifier outperformed when compared to the rest of classifiers because it has shown higher ability to correctly
predict the customer churn (i.e., POD = 0.927 which is close to the ideal case). In fourth experiment, it is observed that CCCP model based on GBT classifier has obtained the best performance among all the baseline classifiers on subject datasets transformed through Box-Cox DT method. However, in this experiment, the NB classifier also reflects better performance in terms of showing less error for incorrect pre-diction of customer churn as it achieved the lowest POF. Finally, the last experiment evaluated the performance of all classifiers where Z-Score DT method was applied on subject datasets. The SRI based CCCP model outperformed in terms of all evaluation measures in the final experiment.
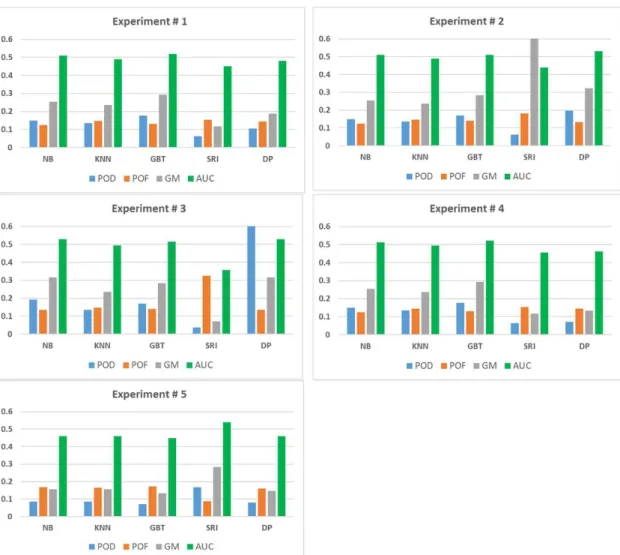
Fig. 6 is a pictorial representation of the performances of all baseline classifiers and DT methods in terms of target evaluation measures (as discussed earlier).
In order to address RQ3 (Do the application of different DT methods exhibits significant performance difference?), Fig. 7 depicts the ob-tained values of the primary evaluation measure (i.e., AUC) for dif-ferent DT methods which were applied to the subject datasets in tele-communication companies. It is clear from the Fig. 7 and Table 5–8 that the application of the DT methods exhibits significantly different per-formance because NB overall the best on Log, Rank, and BoxCox (i.e., 0.51, 0.513, and 0.529 respectively) while it is also investigated that NB does not produce a good result in Z-Score (i.e., 0.459). Similarly, SRI shows worst performance on Log, Rank, and BoxCox but it is also ob-served that SRI can outperform in Z-Score (i.e., AUC 0.541) where the
A. Amin et al.
Fig. 2. (continued) rest of the baseline classifiers do not perform well. So it is clear that
the application of different DT methods exhibits significantly different performance which ultimately reported to RQ3.
5. Discussion
In this section, we present contributions to existing knowledge and the implications of our findings for practice and future research efforts. Finally, we conclude this section with threats to validity.
5.1. Contribution to the existing knowledge
The major contributions of the proposed study are as following: (i) to the best of our knowledge, this is the first study on CCCP using the DT methods (i.e., log, rank, box-cox, and z-score) in the tele-communication sector, (ii) proposed to use the parameter for: (a) to replace all the zero values attribute by 0.00001 in log DT method, (b) by applying 10th percentile DT method the source-target companies data is transformed into more appropriate transformation, and (iii) we recommend to use the NB classifier because on the average NB classifier best performed on DT methods in CCCP in the target domain.
5.2. Implications for practice
Our results have several implications for the practice of cross-company churn prediction in the telecommunication cross-company using data transformation methods. Firstly present work is an extension of our previous work (Adnan et al., 2018) wherein it has brought sistency to our mentioned previous work. The extension and con-sistency are reflected through an empirical indication and implications for the development of the CCCP model in the telecommunication in-dustry as the existing studies (see Section 2) mostly are designed for WCCP. Our finding suggests that a company, lacking the required data for the classifier’s learning purpose due to any reason (as discussed earlier), can use the data from a mature company to predict customers churn successfully.
Secondly, the importance of this study can be viewed from a report (Takeuchi, 2016) that by 2020 digitalization of business practices will double as compared to the existing initiative from 22% to 50%. Therefore, the implication of this study also provides methodological practices that can establish a connection to the significant advantage in the existing and future data transformation methods for the tele-communication companies.
Thirdly, data needs to be considered from the researcher’s per-spective as well because cross-company data should be managed in a
A. Amin et al.
Fig. 3. Boxplot visualization for all attributes in the target-company dataset. pattern that can be more common for empirical analysis and develop-ment
of CCCP models in the future. For this reason, we applied DT methods (i.e., log, rank, box-cox, and z-score) in cross-company of telecommunication sector that takes account of such practice. This will provide the researcher’s a blueprint for using cross-company data in the target company. It is important to note that DT methods do not lose the information of the original data in cross-company context (Zhang et al., 2017). Our results of DT methods shed light on the data normalizationin general and specifically, our approach provides a clear picture of the expected scientific consequences of increased in data normality. Gen-erally, it can be expected that improving normality in cross-company data will lead to an increase in the performance of the predictive model. However, it can also be noticed that it is not possible to bring uniform improvements in normalization as observed during the second
experiment depicted in Table 5. The experiment reveals that the per-formances of the baseline classifiers have not shown uniform im-provement. Rather it has improved some classifiers (e.g., NB) while other (e.g., SRI) performance has not improved at all, leading to var-iation in improvement in the data normality due to data transformation. This can report to RQ1.
Similarly, our findings suggest that it is not a necessary condition for DT methods to increase the data normality in every data samples. Hence, such an implication also supports RQ1. In most cases, the DT methods can increase the data normality which can achieve improve-ment in the CCCP performance but it is also found (see Section 4 and Fig. 4) that it is not true for all the DT methods. For example, the Z-score DT method based CCCP model neither reduced the classifier’s error rate nor obtained more improvement in transformation. In Section
A. Amin et al.
4,the results are obtained by following the recommended evaluation measures (i.e., skewness and kurtosis) used in the study (Zhang et al., 2017).
Fourthly, this study investigated the performance of cross-family (Bayesian, Lazy, Trees, Rules-based and Neural Nets) baseline classifiers (i.e., NB, KNN, GBT, SRI, and DP) in term of POF, POD, AUC, GM evaluation measures. The finding of this study also provides direction for evaluating the impact of DT methods, in practice, in the perfor-mance of different cross-family baseline classifiers. From this perspec-tive, we have observed that overall on the average the NB classifier based CCCP model achieved higher performance (see Table 4–8 and Fig. 7) as compared to the rest of the target classifiers. Furthermore, theresults also show that NB is not a good choice to apply on such data which is transformed with the z-score DT method. On the other hand, the z-z-score DT method exceptionally suites the SRI classifiers in CCCP model because the rest of all the classifiers do not obtain good results.
Additionally, from a data management perspective, an important question had always been as to what extent one should use the different classifiers and how many for better CCCP. Our empirical evaluation
setup tested alternative baseline classifiers which were originated from cross-family classifiers and successfully experimented with different sets of DT methods. We suggest to pick the single best classifier and DT method before deploying a final CCCP model in telecommunication sector and discard all the rest of approaches used in this study in series of experiments.
With respect to the area of future directions, we suggest to focus on the following directions; (i) we recommend to experiment with our technique/ model and to apply ensemble learning methods, (ii) it can be worth studying to make an alternative approach or to apply the same approach when building predictive models for domains other than the telecommunication, (iii) another opinion would be to consider other evaluation measures for measuring the data normality and validating the predictive model.
5.3. Threats to validity
In this section, we present the threats to the validity of the proposed study in the following important term:
A. Amin et al.
Fig. 4. (continued) - External validity: We only considered the two benchmark
pub-lically available datasets related to the telecommunication sector. The dataset-1 is used as a training set for cross-company and da-taset-2 is used as a target-company dataset. Hence, our empirical results may not be generalized to all the companies within or outside the target domain. We could have used dataset-2 as cross-company and dataset-1 as target-cross-company. In such a situation, the generated results might have been different. Nonetheless, replication of the proposed CCCP model using more datasets of different companies may provide more fruitful results.
- Baseline classifiers: We arbitrarily selected five classifiers from cross-families model types to evaluate the performance of the pro-posed model. However, using different classifiers instead of our baseline classifiers could show different results.
- Internal validity: For most parameters, the defaults of Rapidminer studio educational 8.1.001 are used for baseline classifiers, while for discretization by frequency, the bin size was empirically evaluated and the optimum value (i.e., bin size = 3) was obtained from the series of testing values. Different value for bin size or any other discretization method may yield different results.
6. Conclusion
CCCP is still a challenging and rapidly growing problem in general for competitive businesses and specifically for the telecommunication companies. It is due to the heterogeneity between the cross-company and target-company datasets. In this paper, four different data trans-formation methods namely log, rank, box-cox, and Z-score, were applied to introduce a CCCP predictive model based on multiple clas-sifiers (e.g., NB, KNN, GBT, SRI, and DP) belonging to different ML predictive classifier’s families (e.g., Bayesian, Lazy, Trees, Rules-based and Neural Nets). The proposed study not only presented a CCCP model for telecommunication sector where one company is lacking historical data, is newly established, or have recently started using CRM or have lost data due to any reason that also investigated the performances of multiple classifiers and data transformation methods in the target do-main. The empirical results show that in most cases the data transfor-mation methods increased the data normality by improving the classi-fiers performances. Tables 4–8 illustrate the results obtained by all the classifiers on transformed data with different DT methods. Further, it is observed that NB classifier, based on different DT methods, achieved
A. Amin et al.
Fig. 5. Boxplot visualization for all attributes in the cross-company dataset.
the highest AUC values 0.51, 0.51, 0.513 in raw, log, and Box-Cox, respectively, as compared to the rest of the classifiers. It is also in-vestigated that single rule induction (SRI) classifiers achieved the maximum performance (i.e., AUC value 0.541) in single DT method (i.e., Z-Score) and has obtained the lowest level of performance (i.e., AUC values 0.45, 0.44, 0.357, 0.455 in raw, log, rank and box-cox, respectively) when compared to the rest of the classifiers in all other DT methods. While DP and GBT classifiers performed on average in all the DT methods. Moreover, we have also revealed that SRI based CCCP model did not achieve best results in terms of evaluation measure POD
which means it cannot improve the accurate prediction of the correct customer churns. Additionally, from the experiments, we have observed that the Z-Score based data transformation cannot receive better results in POD across all the classifiers while POF measures values, in most cases, is higher than the POD values. It is showing that Z-Score based data transformation neither achieve the best result in improving the classifier prediction performance nor obtained the best result in redu-cing the error when compared to the rest of the methods. For the future direction, we recommend to experiment with our technique/ model and to apply ensemble learning methods. In addition, it can be worth
A. Amin et al.
Fig. 6. Performance evaluation of all the baseline classifiers on various DT methods applied on subject datasets.
Fig. 7. Comparison of all baseline classifiers on primary evaluation measures.
studying to make an alternative approach or to apply the same ap-proach when building predictive models for domains other than the telecommunication.
References
Adnan, A., Babar, S., Asad Masood, K., Thar, B., Hamood ur Rahman, D., & Sajid, A.
(2018). Just-in-time customer churn prediction: With and without data transformation.
IEEE CEC 2018, Rio De Janeiro, Brazil1–7.
Ai, X., Wu, J., Sheng, V. S., Zhao, P., Yao, Y., & Cui, Z. (2015). Immune centroids over- sampling method for multi-class classification. Lecture Notes in Computer Science
(Including Subseries Lecture Notes in Artificial Intelligence and Lecture Notes in Bioinformatics), 9077, 251–263. https://doi.org/10.1007/978-3-319-18038-0_20. Amin, A., Anwar, S., Adnan, A., Nawaz, M., Alawfi, K., Hussain, A., & Huang, K.
(2016). Customer churn prediction in the telecommunication sector using a rough set ap-proach. Neurocomputing, 237, 242–254.
https://doi.org/10.1016/j.neucom.2016.12.009.
Amin, A., Al-Obeidat, F., Shah, B., Adnan, A., Loo, J., & Anwar, S. (2018). Customer churn prediction in telecommunication industry using data certainty. Journal of Business Research, 1(1), 1–12. https://doi.org/10.1016/j.jbusres.2018.03.003. Amin, A., Khan, C., Ali, I., & Anwar, S. (2014). Customer churn prediction in
tele-communication industry: with and without counter-example. In A. Gelbukh, F. C. Espinoza, & S. N. Galicia-Haro (Vol. Eds.), Nature-Inspired Computation and Machine
Learning: vol. 8857, (pp. 206–218). Cham: Springer. https://doi.org/10.1007/978- 3-319-13650-9_19 MICAI. Lecture Notes in Computer Science.