Validation of Automated Protein
Annotation
Francisco M. Couto
M´
ario J. Silva
Pedro M. Coutinho
DI–FCUL
TR–05–24
December 2005
Departamento de Inform´
atica
Faculdade de Ciˆ
encias da Universidade de Lisboa
Campo Grande, 1749–016 Lisboa
Portugal
Technical reports are available at http://www.di.fc.ul.pt/tech-reports. The files are stored in PDF, with the report number as filename. Alternatively, reports are available by post from the above address.
Validation of Automated Protein Annotation
Francisco M. Couto
∗†M´
ario J. Silva
†Pedro M. Coutinho
‡∗
Contact author: [email protected]
†
Departamento de Inform´
atica, Faculdade de Ciˆ
encias, Universidade de Lisboa, Portugal
‡Architecture et Fonction des Macromol´
ecules Biologiques, CNRS, Marseille, France
December 2005
Abstract
Given the large amount of data stored in biological databases, the management of uncer-tainty and incompleteness in them is a non-trivial problem. To cope with the large amount of sequences being produced, a significant number of genes and proteins have been functionally characterized by automated tools. However, these tools have also produced a significant number of misannotations that are now present in the databases.
This paper proposes a new approach for validating the automated annotations, which uses the large amount of publicly available information to compare automated annotations with pre-existing curated annotations. To test the proposed approach, we developed a novel unsupervised method for filtering misannotations provided by automated annotation systems.
We evaluated our method using the automated annotations submitted to BioCreAtIvE, a joint evaluation of state-of-the-art text-mining systems in Biology. The method scored each of these annotations and those scored below a certain threshold were discarded. The results have shown a small trade-off in recall for a large improvement in precision. For example, we were able to discard 44.6%, 66.8% and 81% of the misannotations, maintaining 96.9%, 84.2%, and 47.8% of the correct annotations, respectively. Moreover, we were able to outperform each individual submission to BioCreAtIvE by proper adjustment of the threshold.
These results show the effectiveness of our approach in assisting curators of large biological databases in the use of contemporary tools for automatic identification of annotations.
1
Introduction
The large amount of biological data available nowadays has transformed the traditional way of conducting research and development in the life sciences. Traditional functional characterization of genes and proteins cannot cope with the large amount of sequences being produced. Therefore, a significant number of genes and proteins have been functionally characterized by automated tools that extrapolate functional annotations from similar sequences. However, these tools have also produced a significant number of misannotations that are now present in the databases [11]. Some of these tools have been extrapolating new annotations from misannotations and are therefore spreading the errors. This happens because most databases do not distinguish between extrapolated and curated annotations. Functional characterization is not normally linked to the experimental evidence that substantiates it, which makes the judgment about what is correct difficult. Some biological databases annotate genes or proteins with statements that describe their biological role. Sometimes these annotations are stored as fuzzy statements that are domain-knowledge specific and context dependent. However, the research community has made an effort for developing and using ontologies to annotate genes and proteins [21]. One of the major efforts in Molecular Biology, for constructing an ontology of broad scope and wide applicability, is the GO (Gene Ontology) [4]. GO provides a structured controlled vocabulary of gene and protein biological roles, which can be applied to different species [12]. GO organizes the concepts as a DAG (Directed Acyclic Graph), one for each aspect. GO has three different aspects: molecular function, biological process and cellular component. These aspects allow the annotation of the activity or function of a protein at different levels.
Many databases are using GO terms to annotate their proteins. For example, the GOA (Gene Ontology Annotation) database provides GO annotations to supplement the UniProt (Universal Protein Resource) [8]. UniProt is a universal repository of protein sequence and functional data [2]. GOA provides high-quality manual GO annotations, but manual curation is a time-consuming task that currently covers only about 2.6% of UniProt. The manual processing capacity for gene and protein characterization is overloaded by the increasingly larger amounts of literature to analyze. Thus, the GOA database mainly consists of automated annotations that have a lower quality than manual annotations.
This paper proposes a new approach to validate the automated annotations and therefore improve their accuracy. The approach uses the large amount of publicly available information to compare automated annotations with preexisting curated annotations. The manual annotation process done by curators, which also use preexisting annotations as a guide to evaluate automated annotations, inspired this approach. The underlying intuition is that automated annotations having similar curated annotations should also be correct. By similar annotations, we mean annotations with similar proteins and similar GO terms. This is supported by the dogma of Molecular Biology, which postulates that proteins with similar sequence should also perform similar biological activities [16].
Based on the proposed approach, we developed CAC (Correlate the Annotations’ Components), a novel heuristic method to discard misannotations identified by automated systems. CAC takes advantage of publicly available domain knowledge to score each automated annotation according to previously curated annotations. CAC requires minimal human intervention, since it avoids the complexities of creating rules and patterns covering all possible cases or creating training sets that are too specific to be extended to new domains [20]. Besides avoiding direct human intervention, automatic collected domain knowledge is usually much larger than manually generated domain knowledge and does not become outdated, since public databases can be automatically tracked for updates as they evolve.
An example scenario where automated annotation systems produced a significant number of misanno-tations was BioCreAtIvE (Critical Assessment of Information Extraction systems in Biology). We applied CAC to all the annotations submitted to BioCreAtIvE, and CAC was able to obtain a good accuracy by dis-carding a significant number of these misannotations. The results obtained by CAC in this task demonstrate the efficiency and feasibility of the proposed approach.
The remainder of this paper is organized as follows. Section 2 describes BioCreAtIvE and discusses the results obtained by its participants. Section 3 describes CAC in detail. Section 4 presents the experimental evaluation of CAC using the annotations submitted to BioCreAtIvE. Section 5 discusses the obtained results. Finally, Section 6 expresses our main conclusions.
Algorithm 1: CAC Input: apredicted, an annotation predicted by an automated system;
Acurated, set of previously curated annotations.
Output: conf idence ∈ [0, +∞], confidence score of the predicted annotation. 1: conf idence(apredicted) = 0
2: (gpredicted, ppredicted) = apredicted
3: Gcurated= {g : ∃p (g, p) ∈ Acurated}
4: for all gcurated∈ Gcurated do
5: Pcurated= {p : (gcurated, p) ∈ Acurated}
6: geneSim = geneSim(gpredicted, gcurated)
7: propSim =P
pcurated∈PcuratedpropSim(ppredicted, pcurated) 8: conf idence(apredicted) + = geneSim × propSim
9: end for
10: SG = similarGenes(gpredicted, Gcurated)
11: conf idence(apredicted) =
conf idence(apredicted)
SG
2
BioCreAtIvE
Most of the information discovered in Molecular Biology has been mainly published in biological and biomed-ical scientific literature. The application of text-mining tools to this literature started a few years ago [1]. Since then, the interest in the topic has been steadily increasing, motivated by the vast amount of articles that curators have to read in order to keep up with progress in a specific area [9]. One of the most important applications of text-mining tools is the automated annotation of genes and proteins.
Most of the manual annotation process done by the GOA team involves analyzing the literature, which is a painful and hard task, even to an expert. Thus, the GOA team accepted to take part in BioCreAtIvE, to access the ability of text mining-systems for assisting curators in the annotation of UniProt proteins to GO terms [14]. BioCreAtIvE was a challenging evaluation that compared the performance of different text-mining systems in solving common tasks using the same corpus. The tasks addressed meaningful challenges for text-mining systems and at the same time real problems of Biology. The biologically realistic scenarios posed additional difficulties for the participants, which resulted in less successful performances than to the ones obtained in the Genomics TREC 2004, a similar challenging evaluation [13]. The subtask 2.2 of BioCreAtIvE aimed at predicting GO annotations to human proteins from 200 new full-text articles from the “Journal of Biological Chemistry.” Each participant could submit three different sets of predictions to test the parameters of his system. Overall, there were 18 sets of submitted annotations that were individually evaluated.
For each scientific article, the participants had to submit the list of annotations predicted by their system and evidence text for each annotation. Three curators of the GOA team manually evaluated each predicted annotation and respective evidence [7]. They evaluated if the predicted GO term assignment was correct, or close to what a curator would choose. Sometimes, the GO term was in the correct lineage, but the curators considered it as incorrect because it was too generic or too specific. The GO term assignment may have been correct, but it was only considered a correct submission when the evidence text supported it.
However, the predictions to this subtask had unacceptable levels of accuracy. The participant with the best accuracy identified 6% of all the correct annotations found by all the participants, and only 35% of his predictions were correct. The task addressed by BioCreAtIvE is representative of the complexities that have to be faced in real biological research environments. Without improvements, such automated systems are unhelpful to curators [18]. Therefore, techniques that could achieve good solutions to validate the automated annotations and improve their accuracy are much needed.
3
CAC
This section describes CAC, a heuristic method to discard misannotations provided by automated annotation systems. CAC assumes that an annotation is correct when there is at least a preexisting curated annotation composed by a similar gene (or protein) and a similar property. CAC considers an annotation as a pair (g, p), where g is a gene (or a protein) and p a biological property. For example, the annotations submitted to BioCreAtIvE were composed by a UniProt protein and a GO term that are instances of gene and property, respectively.
CAC assigns a confidence score to apredicted, an annotation predicted by an automated system given as
input. CAC also receives as input Acurated, a set of preexisting curated annotations collected from public
databases, e.g. GOA.
CAC starts by assigning a zero confidence score to the predicted annotation (line 1 in Algorithm 1). Next, CAC collects all the genes in the set of curated annotations (line 3). For each curated gene, CAC collects the properties annotated to it (line 5). Next, CAC calculates the similarity between the curated and the predicted genes (line 6), and calculates the similarity between the predicted property and each property annotated to the curated gene (line 7). CAC increments the confidence of the predicted annotation by the product of the gene similarity and the sum of all property similarities (line 8). Thus, the confidence only increases if both the gene similarity and at least one property similarity are larger than zero, i.e., if they are similar genes and have been annotated with at least one similar property.
However, the Acurated set can contain groups of similar genes that are over-represented. In this case,
the predicted annotations that contain genes with a large number of similar curated genes will tend to have higher confidence scores. To overcome this problem, CAC calculates the number of curated genes similar to the predicted gene (line 10), and employs it as a damping factor (line 11). This factor reduces the impact of the amount of similar curated genes in the confidence score calculation.
CAC returns a confidence score of apredicted being correct. To filter the annotations predicted by an
automated system, CAC scores each predicted annotation and discards those scored below a confidence threshold (CT ). We are able to trade precision against recall by manipulating CT . Raising CT increases precision and decreases recall, lowering CT has the opposite effect.
CAC cannot score annotations without similar curated annotations. When the given predicted annotation has no similar curated genes (SG = 0), CAC assigns a confidence score of +∞ to it. This means that the predicted annotation will never be filtered independently of the threshold used. Therefore, CAC does not discard new knowledge; instead it gives the curators the opportunity to manually verify these potentially novel annotations.
3.1
Gene Similarity
The most popular way to calculate the similarity between two genes is by comparing their sequence [3]. However, sequence similarity is not the only kind of structural similarity that can be computed between proteins. Family similarity is also a structural similarity of a higher level than sequence similarity. Each family describes a set of related proteins that can have identical molecular functions, are involved in the same process, or act in the same cellular location. Classifying proteins in families has been a common technique to organize them according to their biological role. For example, the most successful large-scale effort for increasing the coverage of GO annotations within the UniProt database is based on the exploitation of family annotations [8]. Unlike standard sequence similarity methods, family categorization is normally based on experimental results about protein domains, which represent some evolutionarily conserved structure and have implications on the protein’s biological role.
We implemented geneSim as the number of shared Pfam families. Pfam is a structural classification scheme, which provides a set of protein domains and families, designed for well-established uses, including genome annotation [5]. The UniProt database provides family assignments, where each protein is assigned to a set of Pfam families
3.2
Property Similarity
CAC assumes that two properties are similar if one of them subsumes the other or if they have a common parent in the functional classification scheme, e.g. GO. To calculate the degree of similarity between prop-erties, CAC can use a semantic similarity measure that combines the structure and content of an ontology with statistical information from corpus [19]. Recent projects investigated the use of semantic similarity measures over GO [17, 10]. Their results demonstrated the feasibility of a semantic similarity measure in a biological setting.
We implemented propSim using the measure proposed by Jiang&Conrath, which is one of the most efficient semantic similarity measures [15, 6]. Jiang&Conrath defined the semantic distance of two concepts in a corpus as the difference between their information content and the information content of their most informative common ancestor. The information content of a concept is inversely proportional to its frequency in the corpus. Concepts that occur very often in the corpus have low information content. For example, the stop words (such as “the”) that occur very often in text normally provide little semantic information. We calculated the information content of a GO term as the number of proteins annotated with it. For the most informative common ancestor of two GO terms, we selected the ancestor of both terms having the largest information content.
3.3
Example
In the subtask 2.2 of BioCreAtIvE, the participants annotated the protein “Lipid phosphate phosphohydrolase 1” to the GO terms “membrane” and “mRNA metabolism.” However, only the assignment of “membrane” is correct. Below we describe the results obtained by CAC for these two annotations.
The protein “Lipid phosphate phosphohydrolase 1” belongs to the “PF01569” family. For the annotation of this protein to “membrane,” CAC found 91 curated proteins from the “PF01569” family (geneSim = 1) that were annotated to similar GO terms (propSim > 0) in GOA. From these 91 proteins, 21 were annotated to the same term. For example, the protein “Lipid phosphate phosphohydrolase 2” belongs to the “PF01569” family (geneSim = 1) and is annotated to “membrane” and “integral to membrane,” which results in propSim = 1.445297776. The confidence score resulted from these 91 proteins is 53.09, but since the “PF01569” family contains 630 proteins (SG = 629), CAC returned 53.09
639 ≈ 0.08.
On the other hand, for the annotation of the protein “Lipid phosphate phosphohydrolase 1” to “mRNA metabolism,” CAC found only one curated protein (“HH1165”) from the “PF01569” family (geneSim = 1) that was annotated to a similar GO term (“metabolism”) (propSim = 0.1) in GOA. Thus, in this case CAC returned 6390.1 ≈ 0.0002.
4
Evaluation
We tested if CAC could effectively discard the misannotations submitted to BioCreAtIvE independently of their evidence text. CAC scored each submitted annotation individually (apredicted), using the GOA
annotations as the curated set of annotations (Acurated). The annotations submitted to BioCreAtIvE
and the GOA annotations are publicly available on the web at http://www.pdg.cnb.uam.es/BioLINK/ workshop_BioCreative_04/results/data and ftp://ftp.ebi.ac.uk/pub/databases/GO/goa/UNIPROT/ gene_association.goa_uniprot.gz, respectively. However, in the publicly available information there is no reference to the author of each annotation submitted to BioCreAtIvE. It is not even possible to know which annotations were submitted by the same system.
We decided not to increase the confidence of a predicted annotation based on curated annotations to the same protein, i.e., we discarded the protein gpredictedfrom Gcurated. This way, we restrict CAC to score each
predicted annotation based only on curated annotations to similar but distinct proteins. This restriction ensures a fair evaluation of CAC by checking if CAC copes with proteins having no previously curated annotations.
The restriction increased the number of proteins for which it was not possible to obtain similar proteins, i.e., having SG = 0. Although, only 455 out of the 3740 predicted annotations did not have a similar protein in the December 2004 release of GOA. These novel annotations have a precision of 7%, i.e., only 32 of them were correct. The assumption that supports CAC is not applicable to these novel annotations, thus scoring
Table 1: Statistics of the three sets of annotations created according to the number of similar curated proteins per annotation (SG). For each set, the table shows the number of annotations, the number of distinct predicted proteins, and the maximum, minimum and average of SG.
Set #annotations #proteins max(SG) min(SG) SG
Set-1 1135 30 583 5 223.7841
Set-2 1101 25 1762 613 1077.7221
Set-3 1049 22 11605 1855 3098.9790
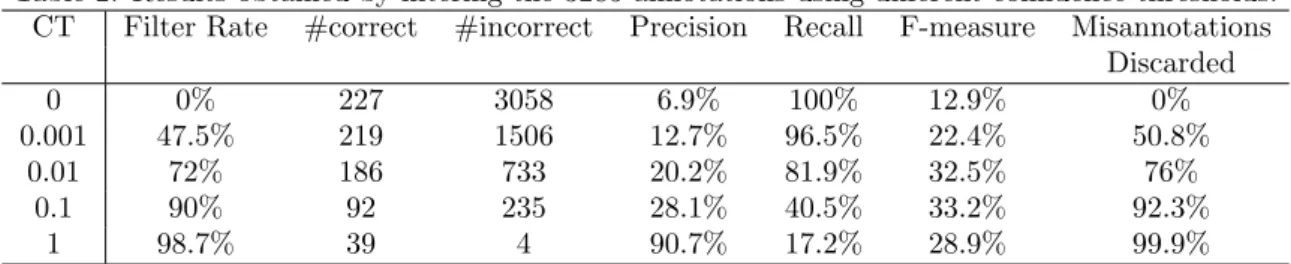
Table 2: Results obtained by filtering the 3285 annotations using different confidence thresholds. CT Filter Rate #correct #incorrect Precision Recall F-measure Misannotations
Discarded 0 0% 227 3058 6.9% 100% 12.9% 0% 0.001 47.5% 219 1506 12.7% 96.5% 22.4% 50.8% 0.01 72% 186 733 20.2% 81.9% 32.5% 76% 0.1 90% 92 235 28.1% 40.5% 33.2% 92.3% 1 98.7% 39 4 90.7% 17.2% 28.9% 99.9%
these annotations is out of CAC objectives. CAC does not discard these annotations, since it assigns an infinite score to them. Therefore, in the first part of our evaluation we disregarded these annotations, but we included them in the end to show the overall impact of CAC on the curation process.
The 3285 annotations having SG > 0 assign 1239 distinct GO terms to 77 UniProt proteins. The 77 proteins were assigned to 87 distinct Pfam families with an average of 1.6 families per protein. These 87 families contained 64863 distinct proteins. Thus, each protein had 6486387 × 1.6 = 1192.9 similar curated proteins on average.
To compare the performance of CAC when applied to over-annotated or under-annotated proteins, we divided the 3285 annotations in three different sets (“Set-1”, “Set-2” and “Set-3”) according to the number of similar curated proteins (SG). Table 1 shows statistical information about each set.
4.1
Results
Each distinct confidence score was used as a confidence threshold to obtain different subsets of the 3285 predicted annotations. For each confidence threshold, the resulting subset contains all the annotations with a confidence score not below the threshold. For a zero confidence threshold, the subset contains all the predicted annotations, since none of them are discarded. As the confidence threshold increases, the size of the subset decreases. For each subset, we calculated: the precision, representing the fraction of correct annotations in the subset; the recall, representing the number of correct annotations in the subset over the number of correct annotations in the original set; and the F-measure = 2×precision×recallprecision+recall , representing the trade-off between precision and recall. Note that if we replace CAC by a random model to filter the annotations, the precision would remain constant. For instance, if we select at random 25% of the annotations in the original set, it is predictable that the selected annotations also contain 25% of the correct annotations in the original set.
Only 227 out of the 3285 annotations submitted to BioCreAtIvE were considered correct, a precision of 6.9%. The real recall is unknown, since the organization of BioCreAtIvE did not measure it. Thus, we assumed a recall of 100% for the original set of annotations. Note that CAC cannot increase recall. As a filter it does not generate new annotations.
Figure 1(a) shows the F-measure for different confidence thresholds. For confidence thresholds smaller than 1, the chart shows that the use of CAC to discard annotations is beneficial by achieving a substantial improvement in F-measure. The F-measure achieves its maximum value when the confidence threshold is around 0.1. Figure 1(c) shows the precision and recall obtained for different confidence thresholds. With a few exceptions, we have a steadily increase in precision as we increase the confidence threshold.
Table 2 shows the accuracy of the predicted annotations when not using CAC (CT = 0), and the accuracy of the subsets of annotations retained by different confidence thresholds. Besides the precision, recall and
0% 5% 10% 15% 20% 25% 30% 35% 40% 45% 0 0.25 0.5 0.75 1 1.25 1.5 1.75 2 2.25 2.5 F-Measure Confidence Threshold without CAC All Proteins Set-1 Set-2 Set-3 (a) F-Measure vs. CT 0% 5% 10% 15% 20% 25% 30% 35% 40% 45% 0% 20% 40% 60% 80% 100% F-Measure Filter Rate without CAC All Proteins Set-1 Set-2 Set-3
(b) F-Measure vs. Filter rate
0% 20% 40% 60% 80% 100% 0% 20% 40% 60% 80% 100% Precision Recall CT=1 CT=0.1 CT=0.01 CT=0.001 without CAC All Proteins Set-1 Set-2 Set-3 (c) Precision vs. Recall
Figure 1: Accuracy of the annotations retained by different confidence thresholds (CT ) after running CAC. The “All Proteins” lines represent all the 3285 annotations. The “Set 1” and “Set 3” lines represent the annotations with the smallest and the largest number of similar curated proteins, respectively. The “Set-2” lines represent all the other annotations not present in “Set 1” and “Set 3.” The “without CAC” baselines represent the original annotations without using CAC. In chart (a) the baseline shows the F-Measure when none of annotations are filtered. In the other charts, the baselines assume a random model to filter the annotations, i.e., having a constant precision for any filter rate.
F-measure, the table shows the number of correct and incorrect annotations that were not discarded by CAC, and the percentage of misannotations discarded by CAC from the original set. For example, by using CT = 0.001 CAC discarded 50.8% (3058−15063058 ) of the misannotations, while maintaining 96.5% (219227) of the correct annotations.
The confidence threshold has no biological meaning to curators. What they would like is just to discard a given amount of annotations to speedup the curation process without loosing a significant part of valuable information. This can be done by increasing CT until a given filter rate is reached. By filter rate we mean the percentage of annotations that are discarded by CAC from the original set. For example, a filter rate of 90% means that only 10% of the original annotations were retained. Figure 1(b) shows the F-measure obtained by CAC for different filter rates. The chart shows that the use of CAC to discard annotations is beneficial by achieving a steady improvement in F-measure as we increase the filter rate, except for filter
Table 3: Results obtained by filtering the 3285 annotations using different filter rates. All Proteins
Filter Rate Precision Recall CT
0% 6.9% 100% 0
70% 19.3% 84.6% 0.008
80% 22.6% 67% 0.025
90% 27.3% 41% 0.094
95% 40.6% 29.5% 0.235
Set-1 Set-2 Set-3
Filter Rate Precision Recall CT Precision Recall CT Precision Recall CT
0% 7.5% 100% 0 7.4% 100% 0 5.8% 100% 0
70% 22.6% 90.6% 0.007 19.8% 81.5% 0.008 15.4% 82% 0.008
80% 27.3% 72.9% 0.028 23.3% 64.2% 0.028 18.4% 67.2% 0.018
90% 32.5% 47.1% 0.091 25.6% 38.3% 0.102 20.8% 36.1% 0.083
95% 40.6% 30.6% 0.263 40% 29.6% 0.243 30.4% 27.9% 0.162
rates larger than 99% (CT > 1). Table 3 shows the precision and the recall of the different sets of annotations over different filter rates, and it also shows the selected CT in each set. The standard deviation of both recall and precision is always less than 5% for the same filter rate, even with a standard deviation of 0.8% in precision in the original sets. The selected CT is almost the same in all sets, except in the “Set-3” where in some cases CT is about 1/3 smaller.
5
Discussion
The increase in precision is already a positive result to GOA curators, since they primarily require high precision in an automated annotation system. In our experiment, CAC increased precision at the cost of a low decrease in recall. The trade-off between precision and recall is worth it, as it is shown by the increase in the F-measure. This is always true except for filter rates larger than 99% (CT > 1), because recall decreases and precision is not improved. For such high confidence thresholds, there are still some misannotations that are not discarded. For example, CAC assigned a high confidence score to the annotation that assigns the GO term “kinase activity” to the protein “Sulfate transporter 1.2,” but this annotation is not in GOA. However, the GO term “protein kinase activity” is annotated to the same protein in GOA. Since the term “kinase activity” is a generalization of “protein kinase activity,” the predicted annotation is correct but still not of interest to curators.
From 3058 misannotations, 4 still remain with a confidence threshold of 1. These 4 annotations assign generic GO terms to proteins. They are correct, but since they are too generic to be of interest to curators they are not defined in GOA. By considering generic annotations as correct, the performance of CAC increases, but this does not reflect the curators’ interest for precise and specific annotations. In addition, it is undesirable to discard these generic annotations, since the evidence substantiating them could be of interest to curators.
The participant of BioCreAtIvE who achieved the largest precision predicted 41 annotations, 14 of which were correct. Using a confidence threshold of 1, CAC selected 43 annotations, 39 of which were correct. On the other hand, the participant who achieved the largest recall predicted 661 annotations, 78 of which were correct. Using a confidence threshold of 0.1, CAC selected 327 annotations, 92 of which were correct. Therefore, by proper adjustment of the confidence threshold we can use CAC to outperform each individual submission to BioCreAtIvE.
For a small decrease in recall we were able to obtain a large improvement in precision, since annotations that clearly do not satisfy the correlation between structure and function are normally incorrect. Unfor-tunately, there are exceptions. Using a confidence threshold of 0.001, CAC discarded 8 out of 227 correct annotations. For these 8 annotations, CAC could not find similar annotations mainly because we restricted the curated annotations to similar but distinct proteins. When we tested CAC without this restriction, 47% of the misannotations were discarded maintaining all the correct annotations, i.e., a 2-fold increase in
preci-Table 4: Results obtained by filtering all the 3740 annotations using different confidence thresholds. CT Filter Rate #correct #incorrect Precision Recall F-measure Misannotations
Discarded 0 0% 259 3481 6.9% 100% 13% 0% 0.001 41.7% 251 1929 11.5% 96.9% 20.6% 44.6% 0.01 63.3% 218 1156 15.9% 84.2% 26.7% 66.8% 0.1 79.1% 124 658 15.9% 47.8% 23.8% 81.0% 1 86.7% 71 427 14.3% 27.4% 18.8% 87.7%
sion while maintaining 100% recall. We applied this restriction to ensure a fair evaluation of CAC. However, in a real application setting, we would not apply this restriction and therefore obtain a higher performance. We can also anticipate that, as the scientific community produces better classification schemes, CAC will also improve its performance.
The results of the three different sets of annotations show that CAC is not biased toward proteins with a large number of similar curated proteins. In Figure 1, the results of these sets were uniform over all the confidence thresholds. The small differences are due to different precision values of each original set. The Set 1 of under-annotated proteins has the highest precision (7.5%) and the Set 3 of over-annotated proteins has the lowest precision (5.8%). The Set 1 achieves a precision of 100% for a recall larger than 20%, because any correct annotation to under-annotated proteins is of interest to curators, i.e., the problem of generic annotations described above is not applicable to these proteins.
The results show that the performance obtained by a given filter rate is preserved when applied to different sets of annotations. Therefore, curators can expect to obtain similar performances in different sets of annotations by using similar filter rates. Using different sets of curated and automated annotations may imply different CT for obtaining the same filter rate. For example, the automated annotations in “Set-3” have more similar curated annotations, thus it is also expected to have larger confidence scores. However, curators can easily adjust CT to obtain a required filter rate.
CAC does not discard new knowledge, but it does not discard the misannotations to under-annotated proteins either. To measure the real impact of using CAC on the curation process we have to take into account the 455 novel annotations. CAC never discards these annotations, leaving the decision to the curator by assigning an infinite confidence score to them. Table 4 shows that including these novel annotations has a small effect on the performance of CAC. For example, by using a filter rate of 41.7% (CT = 0.001) the curator has only to verify 58.3% (100%-41.7%) of the original annotations loosing only 3.1% (100%-96.9%) of the correct annotations. However, the precision for large filter rates is constrained by the precision of the novel annotations. Since CAC does not discard any of the 455 novel annotations, the precision converges to 7% (32 out of 455 annotations are correct) as CT increases. Nevertheless, CAC can overcome this limitation and contribute toward adding new knowledge. Nowadays, there are automated systems that predict generic annotations with high precision. If these generic annotations were considered, CAC would use them to score more specific annotations, which is what curators really want. CAC could also be used to crosscheck annotations predicted by different automated systems. For example, CAC could score annotations predicted by a text-mining system based on annotations predicted by sequence similarity.
6
Conclusions
A significant number of genes and proteins have been functionally characterized by automatic tools, which have also produced a significant number of misannotations. This paper proposes a novel approach that uses curated annotations as domain knowledge for validating these automated annotations. To demonstrate the feasibility and efficiency of our approach, we developed CAC, a novel method to score automated annotations based on similar curated annotations.
We tested CAC with a set of annotations automatically extracted from scientific literature. CAC was able to discard 44.6%, 66.8% and 81% of the misannotations, maintaining 96.9%, 84.2% and 47.8% of the correct annotations, respectively. These results show that CAC can effectively be used to speed up the curation process by discarding a large amount of misannotations without loosing a significant amount of
correct annotations.
The confidence threshold can be adjusted to obtain different filter rates according to the curator’s require-ments. The results obtained by similar filter rates were consistent for different subsets of the annotations, so the performance of CAC is predictable as we change a single tuning parameter.
CAC is an add-on data-mining tool that can be used by any automated annotation system to improve the accuracy and require less effort to curators. CAC is fully automated, since it uses extensive domain knowledge automatically collected from public databases. In addition, CAC can score relationships between other objects than genes and biological properties. All it requires is a similarity measure for each type of object used and a set of curated relationships.
The obtained results show that the approach proposed in this paper can improve the curation process, which might add this validation approach to the list of required steps for automated protein annotation.
References
[1] M. Andrade and P. Bork. Automated extraction of information in Molecular Biology. FEBS Letters, 476:12–17, 2000.
[2] R. Apweiler, A. Bairoch, C. Wu, W. Barker, B. Boeckmann, S. Ferro, E. Gasteiger, H. Huang, R. Lopez, M. Magrane, M. Martin, D. Natale, C. O’Donovan, N. Redaschi, and L. Yeh. UniProt: the universal protein knowledgebase. Nucleic Acids Research, 32(Database issue):D115–D119, 2004.
[3] T. Attwood and D. Parry-Smith. Introduction to Bioinformatics. Longman Higher Education, 1999. [4] M. Bada, R. Stevens, C. Goble, Y. Gil, M. Ashburner, J. Blake, J. Cherry, M. Harris, and S. Lewis. A
short study on the success of the gene ontology. Journal of Web Semantics, 1(1):235–240, 2004. [5] A. Bateman, L. Coin, R. Durbin, R. Finn, V. Hollich, S. Griffiths-Jones, A. Khanna, M. Marshall,
S. Moxon, E. Sonnhammer, D. Studholme, C. Yeats, and S. Eddy. The Pfam protein families database. Nucleic Acids Research, 32(Database issue):D138–D141, 2004.
[6] A. Budanitsky and G. Hirst. Semantic distance in WordNet: An experimental, application-oriented evaluation of five measures. In Proc. of the Workshop on WordNet and Other Lexical Resources co-located with the 2nd North American Chapter of the Association for Computational Linguistics, June 2001.
[7] E. Camon, D. Barrell, E. Dimmer, V. Lee, M. Magrane, J. Maslen, D. Binns, and R. Apweiler. An evaluation of GO annotation retrieval for BioCreAtIvE and GOA. BMC Bioinformatics, 6(Suppl 1):S17, 2005.
[8] E. Camon, M. Magrane, D. Barrell, V. Lee, E. Dimmer, J. Maslen, D. Binns, N. Harte, R. Lopez, and R. Apweiler. The Gene Ontology Annotations (GOA) database: sharing knowledge in UniProt with Gene Ontology. Nucleic Acids Research, 32:262–166, 2004.
[9] F. Couto and M. Silva. Advanced Data Mining Techonologies in Bioinformatics, chapter Mining the BioLiterature: towards automatic annotation of genes and proteins. Idea Group Inc. (in press), 2005. [10] F. Couto, M. Silva, and P. Coutinho. Semantic similarity over the gene ontology: Family correlation
and selecting disjunctive ancestors. In Proc. of the ACM Conference in Information and Knowledge Management, 2005.
[11] D. Devos and A. Valencia. Intrinsic errors in genome annotation. Trends Genetics, 17(8):429–431, 2001. [12] GO-Consortium. The Gene Ontology (GO) database and informatics resource. Nucleic Acids Research,
32(Database issue):D258–D261, 2004.
[13] W. Hersh, R. Bhuptiraju, L. Ross, P. Johnson, A. Cohen, and D. Kraemer. TREC 2004 genomics track overview. In Proc. of the 13th Text REtrieval Conference, 2004.
[14] L. Hirschman, A. Yeh, C. Blaschke, and A. Valencia. Overview of BioCreAtIvE: critical assessment of information extraction for biology. BMC Bioinformatics, 6(Suppl 1):S1, 2005.
[15] J. Jiang and D. Conrath. Semantic similarity based on corpus statistics and lexical taxonomy. In Proc. of the 10th International Conference on Research on Computational Linguistics, 1997.
[16] P. Lord, R. Stevens, A. Brass, and C. Goble. Investigating semantic similarity measures across the Gene Ontology: the relationship between sequence and annotation. Bioinformatics, 19(10):1275–1283, 2003. [17] P. Lord, R. Stevens, A. Brass, and C. Goble. Semantic similarity measures as tools for exploring the
Gene Ontology. In Proc. of the 8th Pacific Symposium on Biocomputing, 2003.
[18] D. Rebholz-Schuhmann, H. Kirsch, and F. Couto. Facts from text - is text mining ready to deliver? PLoS Biology, 3(2):e65, 2005.
[19] P. Resnik. Using information content to evaluate semantic similarity in a taxonomy. In Proc. of the 14th International Joint Conference on Artificial Intelligence, 1995.
[20] H. Shatkay and R. Feldman. Mining the biomedical literature in the genomic era: An overview. Journal of Computational Biology, 10(6):821–855, 2003.
[21] R. Stevens, C. Wroe, P. Lord, and C. Goble. Handbook on Ontologies, chapter Ontologies in Bioinfor-matics. Springer, 2003.